Fountainbleau, FL (Florida) Houses and Residents
| Fountainbleau: | $312,859 |
| Florida: | $354,100 |
Mean price in 2022:
Detached houses: $493,055
Here: $493,055 State: $500,941 Townhouses or other attached units: $303,340
Here: $303,340 State: $370,869 In 2-unit structures: $343,652
Here: $343,652 State: $423,188 In 3-to-4-unit structures: $286,435
Here: $286,435 State: $309,944 In 5-or-more-unit structures: $231,356
Here: $231,356 State: $447,145 Mobile homes: $60,003
Here: $60,003 State: $113,202
Total population: 59,764 (Urban population: 59,518, Rural population: 0)
Houses: 23,577 (21,512 occupied: 9,826 owner occupied, 11,972 renter occupied)
| % of renters here: | 55% |
| State: | 33% |
Housing density: 5,355 houses/condos per square mile
Median price asked for vacant for-sale houses and condos in 2022: $254,113.
Median contract rent in 2022: $1,786 (lower quartile is $1,485, upper quartile is over $2,000)
Median rent asked for vacant for-rent units in 2022: $2,134
Median gross rent in Fountainbleau, FL in 2022: $1,867
Housing units in Fountainbleau with a mortgage: 5,572 (457 second mortgage, 12 home equity loan, 267 both second mortgage and home equity loan)
Houses without a mortgage: 147
Median household income for houses/condos with a mortgage: $72,702
Median household income for apartments without a mortgage: $45,267
Median monthly housing costs: $1,677
Compare current foreclosures near Fountainbleau, FL:
| Photo | Address | Area | Beds / Baths | Price | Details |
|---|---|---|---|---|---|

|
#1
SW 88th St
Miami, FL 33156
|
3,536 sq. feet
|
4 baths 5 beds |
$1,805,000
|
show details |

|
#2
E 35th St
Hialeah, FL 33013
|
1,690 sq. feet
|
1 baths 2 beds |
$436,000
|
show details |

|
#3
SW 38th Ct
Miami, FL 33134
|
2,823 sq. feet
|
4 baths 6 beds |
$1,100,000
|
show details |

|
#4
SW 27th St
Hollywood, FL 33029
|
3,611 sq. feet
|
2 baths 4 beds |
$665,600
|
show details |

|
#5
SW 97th Ave
Hollywood, FL 33025
|
3,191 sq. feet
|
2 baths 5 beds |
$574,900
|
show details |

|
#6
NE 1st Ave Unit #2200
Miami, FL 33132
|
- sq. feet
|
2 baths 1 beds |
$715,000
|
show details |

|
#7
SE 5th St Apt 703
Miami, FL 33131
|
952 sq. feet
|
2 baths 1 beds |
show details | |

|
#8
NW 40th St
Miami, FL 33127
|
1,035 sq. feet
|
1 baths 2 beds |
show details | |

|
#9
NW 34th St # 3111
Miami, FL 33127
|
612 sq. feet
|
1 baths 1 beds |
show details | |

|
#10
NW 34th St # 2212
Miami, FL 33127
|
737 sq. feet
|
1 baths 1 beds |
show details |
| Photo | Address | Area | Beds / Baths | Price | Details |
|---|---|---|---|---|---|

|
#11
SW 168th Pl
Miami, FL 33196
|
1,718 sq. feet
|
2 baths 3 beds |
show details | |

|
#12
Boggs Dr
Miami, FL 33176
|
1,000 sq. feet
|
1 baths 3 beds |
show details | |

|
#13
W 94th Ter
Hialeah, FL 33018
|
1,962 sq. feet
|
3 baths 3 beds |
show details | |

|
#14
NW 47th St
Miami, FL 33127
|
1,297 sq. feet
|
1 baths 3 beds |
show details | |

|
#15
Fontainebleau Blvd Apt 205
Miami, FL 33172
|
1,610 sq. feet
|
2 baths 3 beds |
show details | |

|
#16
Brickell Ave Apt 57e
Miami, FL 33131
|
3,357 sq. feet
|
4 baths 4 beds |
show details | |

|
#17
NW 34th St # 3014
Miami, FL 33127
|
681 sq. feet
|
1 baths 1 beds |
show details | |

|
#18
NE 1st Ave Apt 1901
Miami, FL 33132
|
853 sq. feet
|
2 baths 1 beds |
show details | |

|
#19
NE 1st Ave Apt 1920
Miami, FL 33132
|
1,009 sq. feet
|
2 baths 2 beds |
show details | |

|
#20
Brickell Ave Apt 4105
Miami, FL 33131
|
1,124 sq. feet
|
2 baths 2 beds |
show details |
| Photo | Address | Area | Beds / Baths | Price | Details |
|---|---|---|---|---|---|

|
#21
Brickell Ave Apt 3802
Miami, FL 33131
|
1,146 sq. feet
|
2 baths 2 beds |
show details | |

|
#22
Brickell Ave Apt 1610
Miami, FL 33131
|
1,289 sq. feet
|
3 baths 2 beds |
show details | |

|
#23
NW 108th St
Miami, FL 33167
|
1,364 sq. feet
|
2 baths 3 beds |
show details | |

|
#24
Brickell Bay Dr Ph 4214
Miami, FL 33131
|
1,245 sq. feet
|
2 baths 2 beds |
show details | |

|
#25
Brickell Ave Apt C3905
Miami, FL 33129
|
1,697 sq. feet
|
2 baths 2 beds |
show details | |

|
#26
Brickell Ave Apt 1806
Miami, FL 33129
|
2,403 sq. feet
|
3 baths 2 beds |
show details | |

|
#27
Twin Sabal Dr
Hialeah, FL 33014
|
1,333 sq. feet
|
2 baths 3 beds |
show details | |

|
#28
NW 47th St
Miami, FL 33127
|
1,393 sq. feet
|
1 baths 2 beds |
show details | |

|
#29
SW 134th Ter
Miami, FL 33186
|
1,780 sq. feet
|
3 baths 4 beds |
show details | |

|
#30
SW 7th St Apt 1010
Miami, FL 33130
|
1,370 sq. feet
|
2 baths 2 beds |
show details |
| Photo | Address | Area | Beds / Baths | Price | Details |
|---|---|---|---|---|---|

|
#31
SW 9th St Apt 3909
Miami, FL 33130
|
684 sq. feet
|
2 baths 1 beds |
show details | |

|
#32
SW 9th St Apt 3609
Miami, FL 33130
|
684 sq. feet
|
2 baths 1 beds |
show details | |

|
#33
NW 45th St
Miami, FL 33127
|
1,571 sq. feet
|
1 baths 2 beds |
show details | |

|
#34
SW 111th St
Miami, FL 33196
|
1,330 sq. feet
|
2 baths 3 beds |
show details | |

|
#35
SW 13th St Apt 4409
Miami, FL 33130
|
1,293 sq. feet
|
3 baths 2 beds |
show details | |

|
#36
NW 64th St
Miami, FL 33150
|
1,398 sq. feet
|
1 baths 3 beds |
show details | |

|
#37
SE 6th St # 2510
Miami, FL 33131
|
1,208 sq. feet
|
2 baths 2 beds |
show details | |

|
#38
SW 113th Ter
Miami, FL 33196
|
2,711 sq. feet
|
3 baths 4 beds |
show details | |

|
#39
SE 6th St # 3209
Miami, FL 33131
|
1,373 sq. feet
|
3 baths 2 beds |
show details | |

|
#40
S Miami Ave # 5006
Miami, FL 33130
|
881 sq. feet
|
2 baths 1 beds |
show details |
| Photo | Address | Area | Beds / Baths | Price | Details |
|---|---|---|---|---|---|

|
#41
NW 16th Ave
Miami, FL 33147
|
1,091 sq. feet
|
1 baths 2 beds |
show details | |

|
#42
SW 163rd Ct
Miami, FL 33196
|
1,817 sq. feet
|
3 baths 3 beds |
show details | |

|
#43
NW 46th St
Miami, FL 33127
|
2,561 sq. feet
|
2 baths 5 beds |
show details | |

|
#44
Fillmore St
Miami, FL 33176
|
936 sq. feet
|
1 baths 3 beds |
show details | |

|
#45
NW 6th Ave
Miami, FL 33127
|
1,570 sq. feet
|
3 baths 4 beds |
show details | |

|
#46
SW 106th Ave
Miami, FL 33176
|
1,056 sq. feet
|
2 baths 4 beds |
show details | |

|
#47
Brickell Bay Dr Apt 3724
Miami, FL 33131
|
1,232 sq. feet
|
2 baths 3 beds |
show details | |

|
#48
NW 52nd St
Miami, FL 33127
|
1,390 sq. feet
|
2 baths 3 beds |
show details | |

|
#49
SW 120th Ct # 11-11
Miami, FL 33186
|
850 sq. feet
|
1 baths 2 beds |
show details | |

|
Check over 1 million property listings on Foreclosure.com!
|
browse all offers | |||

 | Thinking of buying condo at Mei on Miami Beach... (65 replies) |
| Need Rental Apartment Recommendations in Kendall, Fountainbleau,Doral (0 replies) |
| I need help finding an affordable Miami Apartment! (18 replies) |
| What's living in mid-beach like? (9 replies) |
| For those unhappy living in Florida (119 replies) |
| Miami Beach hotels that allow self-parking? (11 replies) |

Median year apartment built: 1986
Household type by relationship:
Households: 56,760- Male householders: 11,012 (1,494 living alone), Female householders: 9,989 (2,830 living alone)
9,159 spouses (9,066 opposite-sex spouses), 1,775 unmarried partners, (1,718 opposite-sex unmarried partners), 14,741 children (13,667 natural, 507 adopted, 566 stepchildren), 1,227 grandchildren, 1,164 brothers or sisters, 2,957 parents, 0 foster children, 2,442 other relatives, 2,212 non-relatives
- In group quarters: 77
Size of family households: 5,385 2-persons, 4,723 3-persons, 3,325 4-persons, 1,128 5-persons, 441 6-persons, 146 7-or-more-persons.
Size of nonfamily households: 4,635 1-person, 1,766 2-persons, 164 3-persons, 14 5-persons.
5,214 married couples with children.
2,479 single-parent households (549 men, 1,930 women).
8.0% of residents of Fountainbleau speak English at home.
88.3% of residents speak Spanish at home (45% speak English very well, 21% speak English well, 19% speak English not well, 15% don't speak English at all).
1.9% of residents speak other Indo-European language at home (76% speak English very well, 11% speak English well, 11% speak English not well, 3% don't speak English at all).
1.9% of residents speak Asian or Pacific Island language at home (91% speak English very well, 7% speak English well, 2% speak English not well).
0.3% of residents speak other language at home (81% speak English very well, 19% speak English well, 1% speak English not well).
Foreign born population: 41,541 (73.2%)
(58.1% of them are naturalized citizens)
| Here: | 4.6 |
| State: | 5.9 |
| Here: | 3.7 |
| State: | 4.2 |

- Bedrooms in owner-occupied houses and condos in Fountainbleau, Florida
- 394no bedroom
- 8821 bedroom
- 3,7862 bedrooms
- 3,6593 bedrooms
- 1,0424 bedrooms
- 645+ bedrooms

- Bedrooms in renter-occupied apartments in Fountainbleau, Florida
- 292no bedroom
- 2,8111 bedroom
- 6,5792 bedrooms
- 1,9603 bedrooms
- 3294 bedrooms
- 05+ bedrooms

- Cars and other vehicles available in Fountainbleau in owner-occupied houses/condos
- 655no vehicle
- 3,3421 vehicle
- 4,4312 vehicles
- 1,1203 vehicles
- 2534 vehicles
- 265+ vehicles

- Cars and other vehicles available in Fountainbleau in renter-occupied apartments
- 711no vehicle
- 4,4741 vehicle
- 5,2992 vehicles
- 1,2533 vehicles
- 2344 vehicles
- 05+ vehicles

- Rooms in owner-occupied houses in Fountainbleau, Florida
- 3601 room
- 3122 rooms
- 1,4313 rooms
- 2,6014 rooms
- 2,3755 rooms
- 1,5106 rooms
- 6257 rooms
- 4678 rooms
- 1469+ rooms

- Rooms in renter-occupied apartments in Fountainbleau, Florida
- 2861 room
- 1,2632 rooms
- 3,6633 rooms
- 4,0224 rooms
- 1,4465 rooms
- 7706 rooms
- 3647 rooms
- 1198 rooms
- 399+ rooms


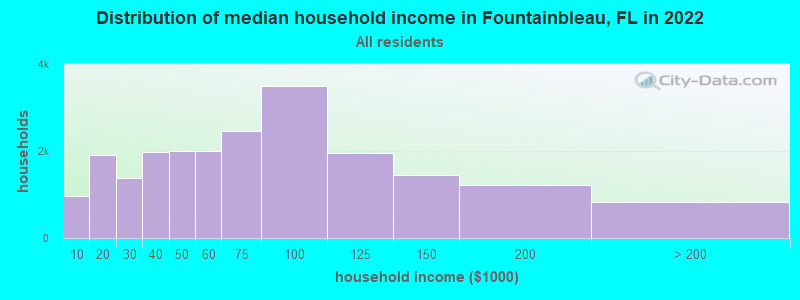
Fountainbleau, FL household income distribution

- 958Less than $10,000
- 1,917$10,000 to $19,999
- 1,374$20,000 to $29,999
- 1,969$30,000 to $39,999
- 1,992$40,000 to $49,999
- 1,999$50,000 to $59,999
- 2,449$60,000 to $74,999
- 3,490$75,000 to $99,999
- 1,948$100,000 to $124,999
- 1,456$125,000 to $149,999
- 1,210$150,000 to $199,999
- 839$200,000 or more
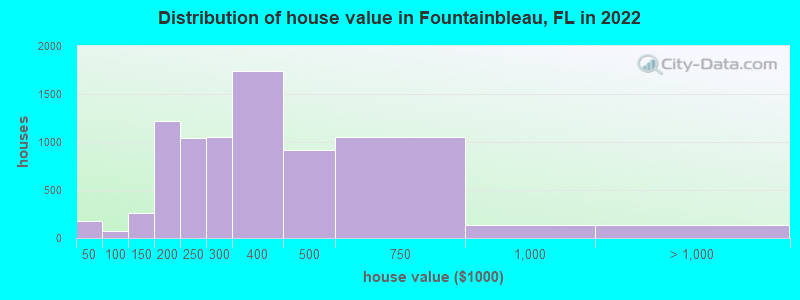
Home value of owner - occupied houses in 2022 in Fountainbleau, FL
-
- 84Less than $10,000
- 7$15,000 to $19,999
- 29$20,000 to $24,999
- 18$30,000 to $34,999
- 36$35,000 to $39,999
- 8$50,000 to $59,999
- 10$60,000 to $69,999
- 19$70,000 to $79,999
- 10$80,000 to $89,999
- 26$90,000 to $99,999
- 88$100,000 to $124,999
- 168$125,000 to $149,999
- 600$150,000 to $174,999
- 616$175,000 to $199,999
- 1,039$200,000 to $249,999
- 1,054$250,000 to $299,999
- 1,738$300,000 to $399,999
- 916$400,000 to $499,999
- 1,054$500,000 to $749,999
- 138$750,000 to $999,999
- 47$1,000,000 to $1,499,999
- 46$1,500,000 to $1,999,999
- 39$2,000,000 or more
Rent paid by renters in 2022 in Fountainbleau, FL
-
- 85$200 to $249
- 40$500 to $549
- 6$550 to $599
- 37$600 to $649
- 110$650 to $699
- 11$750 to $799
- 57$800 to $899
- 200$900 to $999
- 644$1,000 to $1,249
- 2,076$1,250 to $1,499
- 5,729$1,500 to $1,999
- 2,339$2,000 to $2,499
- 250$2,500 to $2,999
- 167$3,000 to $3,499
- 42$3,500 or more
- 258No cash rent


Percentage of workers working in this county: 96.6%
Number of people working at home: 3,809 (11.9% of all workers)
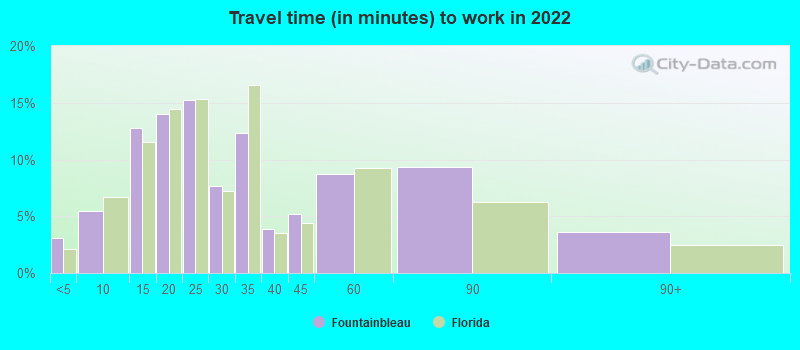
Travel time to work (commute)
- Less than 5 minutes: 202
- 5 to 9 minutes: 1,049
- 10 to 14 minutes: 2,917
- 15 to 19 minutes: 4,158
- 20 to 24 minutes: 4,800
- 25 to 29 minutes: 1,925
- 30 to 34 minutes: 4,669
- 35 to 39 minutes: 1,094
- 40 to 44 minutes: 1,790
- 45 to 59 minutes: 4,029
- 60 to 89 minutes: 966
- 90 or more minutes: 412
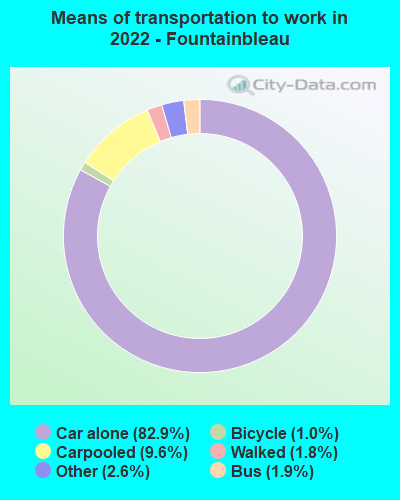
Means of transportation to work:
- Drove a car alone: 8,369 (62.0%)
- Carpooled: 1,095 (8.1%)
- Bus: 184 (1.4%)
- Taxi: 336 (2.5%)
- Bicycle: 134 (1.0%)
- Walked: 211 (1.6%)
- Worked at home: 3,809 (28.2%)

- Unemployment by race in 2022
- Unemployment rate for White non-Hispanic residents
- 0.7%Males
- 3.9%Females
- Unemployment rate for American Indian and Alaska Native residents
- 6.4%Males
- Unemployment rate for other race residents
- 2.3%Males
- 3.9%Females
- Unemployment rate for two or more race residents
- 1.9%Males
- 2.4%Females
- Unemployment rate for Hispanic or Latino residents
- 1.5%Males
- 2.6%Females

- Year of entry for the foreign-born population in Fountainbleau, Florida
- 19,2562010 or later
- 8,4862000 to 2009
- 5,7361990 to 1999
- 13,4491980 to 1989
- 4,6041970 to 1979
- 7,766Before 1970

First ancestries reported:
- American: 487 (1.1%)
- Italian: 290 (0.6%)
- English: 197 (0.4%)
- Brazilian: 160 (0.4%)
- Arab: 89 (0.2%)
- Iranian: 79 (0.2%)
- German: 55 (0.1%)
- Portuguese: 42 (0.09%)
- Irish: 40 (0.09%)
- European: 37 (0.08%)
- Basque: 35 (0.08%)
- Scottish: 32 (0.07%)
- French: 28 (0.06%)
- Jamaican: 28 (0.06%)
- Scotch-Irish: 27 (0.06%)
- Russian: 21 (0.05%)
- Zimbabwean: 21 (0.05%)
- Bulgarian: 20 (0.04%)
- Jordanian: 16 (0.04%)
- British: 14 (0.03%)
- Croatian: 13 (0.03%)
- Bahamian: 12 (0.03%)
- Lebanese: 11 (0.02%)
- Canadian: 11 (0.02%)
- Greek: 9 (0.02%)
- Trinidadian and Tobagonian: 9 (0.02%)
- Austrian: 5 (0.01%)
- Polish: 4 (0.01%)
- Haitian: 3 (0.01%)
Most common places of birth for foreign-born residents (%):
| Fountainbleau: | 45.5% (18,883) |
| Florida: | 22.0% (1,006,576) |
| Fountainbleau: | 17.3% (7,190) |
| Florida: | 5.7% (262,042) |
| Fountainbleau: | 10.9% (4,547) |
| Florida: | 6.5% (298,669) |
| Fountainbleau: | 8.2% (3,392) |
| Florida: | 2.3% (105,066) |
| Fountainbleau: | 2.4% (1,009) |
| Florida: | 3.0% (137,727) |
| Fountainbleau: | 2.4% (994) |
| Florida: | 2.3% (107,160) |
| Fountainbleau: | 1.8% (760) |
| Florida: | 2.1% (96,693) |
| Fountainbleau: | 1.8% (757) |
| Florida: | 2.1% (94,349) |
Place of birth for U.S.-born residents:
- This state: 11,080
- Other state: 2,586
- Northeast: 1,359
- Midwest: 381
- South: 298
- West: 592
87.7% of Fountainbleau residents lived in the same house 1 years ago.
Out of people who lived in different houses, 43.5% lived in this county.
Out of people who lived in different counties, 31.1% lived in Florida.
| Fountainbleau: | 87.7% |
| State average: | 86.3% |
Education attainment for males 25 years and older:
- No schooling: 491
- Nursery to 4th grade: 112
- 5th and 6th grade: 140
- 7th and 8th grade: 106
- 9th grade: 286
- 10th grade: 119
- 11th grade: 132
- 12th grade, no diploma: 2,706
- High school graduate (or equivalency): 4,758
- Less than 1 year of college: 1,054
- Some college more than 1 year, no degree: 1,630
- Associate degree: 1,492
- Bachelor's degree: 4,717
- Master's degree: 1,689
- Professional school degree: 677
- Doctorate degree: 302

Education attainment for females 25 years and older:
- No schooling: 666
- Nursery to 4th grade: 211
- 5th and 6th grade: 219
- 7th and 8th grade: 166
- 9th grade: 279
- 10th grade: 262
- 11th grade: 77
- 12th grade, no diploma: 2,182
- High school graduate (or equivalency): 6,181
- Less than 1 year of college: 766
- Some college more than 1 year, no degree: 2,101
- Associate degree: 2,315
- Bachelor's degree: 5,210
- Master's degree: 1,618
- Professional school degree: 863
- Doctorate degree: 194


Housing units in structures:
- One, detached: 3,197
- One, attached: 3,059
- Two: 1,033
- 3 or 4: 580
- 5 to 9: 1,345
- 10 to 19: 2,492
- 20 to 49: 3,999
- 50 or more: 7,809
- Mobile homes: 46
- Boats, RVs, vans, etc.: 13
Housing units lacking complete kitchen facilities in 2022: 1.0%
House/condo owner moved in on average 14 years ago
Renter moved in on average 2 years ago

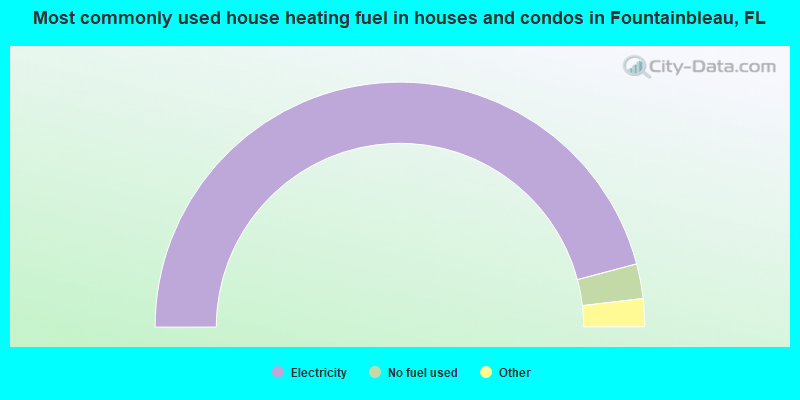
- 91.8%Electricity
- 4.6%No fuel used
- 2.0%Utility gas
- 1.2%Bottled, tank, or LP gas
- 0.2%Fuel oil, kerosene, etc.
- 0.2%Other fuel
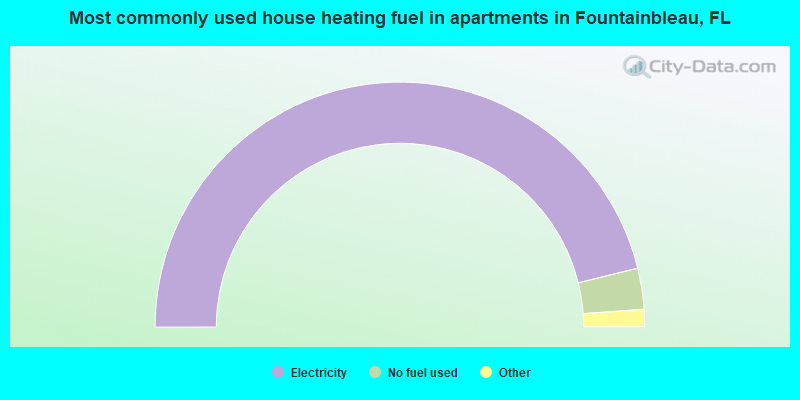
- 92.3%Electricity
- 5.4%No fuel used
- 1.6%Utility gas
- 0.6%Fuel oil, kerosene, etc.
Private vs. public school enrollment:
| Here: | 9.1% |
| Florida: | 15.8% |
| Here: | 6.1% |
| Florida: | 12.9% |
| Here: | 16.0% |
| Florida: | 23.6% |


