Fort Pierce, FL (Florida) Houses and Residents
| Fort Pierce: | $238,324 |
| Florida: | $354,100 |
Mean price in 2022:
Detached houses: $293,721
Here: $293,721 State: $500,941 Townhouses or other attached units: $224,534
Here: $224,534 State: $370,869 In 2-unit structures: $203,762
Here: $203,762 State: $423,188 In 3-to-4-unit structures: $238,787
Here: $238,787 State: $309,944 In 5-or-more-unit structures: $267,182
Here: $267,182 State: $447,145 Mobile homes: $98,226
Here: $98,226 State: $113,202
Total population: 43,601 (Urban population: 37,320, Rural population: 169 (all nonfarm))
Houses: 23,828 (19,235 occupied: 9,026 owner occupied, 10,048 renter occupied)
| % of renters here: | 53% |
| State: | 33% |
Housing density: 1,616 houses/condos per square mile
Median price asked for vacant for-sale houses and condos in 2022: $613,687.
Median contract rent in 2022: $914 (lower quartile is $595, upper quartile is $1,251)
Median rent asked for vacant for-rent units in 2022: $1,662
Median gross rent in Fort Pierce, FL in 2022: $1,086
Housing units in Fort Pierce with a mortgage: 3,987 (319 second mortgage, 37 home equity loan, 197 both second mortgage and home equity loan)
Houses without a mortgage: 19
Median household income for houses/condos with a mortgage: $67,619
Median household income for apartments without a mortgage: $47,770
Median monthly housing costs: $1,074
Compare current foreclosures in Fort Pierce, FL:
| Photo | Address | Area | Beds / Baths | Price | Details |
|---|---|---|---|---|---|

|
#1
Bent Pine Dr
Fort Pierce, FL 34951
|
1,710 sq. feet
|
2 baths 3 beds |
$300,000
|
show details |

|
#2
Bennett Dr
Fort Pierce, FL 34946
|
1,042 sq. feet
|
2 baths 2 beds |
show details | |

|
#3
Santa Clara Blvd
Fort Pierce, FL 34951
|
1,743 sq. feet
|
2 baths 3 beds |
show details | |

|
#4
S Ocean Dr # Ph209
Fort Pierce, FL 34949
|
1,194 sq. feet
|
2 baths 2 beds |
show details | |

|
#5
N 43rd St
Fort Pierce, FL 34946
|
840 sq. feet
|
2 baths 2 beds |
show details | |

|
#6
Fort Pierce Blvd
Fort Pierce, FL 34951
|
1,872 sq. feet
|
2 baths 3 beds |
show details | |

|
#7
Sandpiper Dr Apt B
Fort Pierce, FL 34982
|
946 sq. feet
|
2 baths 1 beds |
show details | |

|
#8
Dayman Ave
Fort Pierce, FL 34950
|
2,122 sq. feet
|
2 baths 3 beds |
show details | |

|
#9
Germani Dr
Fort Pierce, FL 34982
|
1,503 sq. feet
|
2 baths 3 beds |
show details | |

|
#10
N 10th St
Fort Pierce, FL 34950
|
804 sq. feet
|
1 baths 3 beds |
show details |
| Photo | Address | Area | Beds / Baths | Price | Details |
|---|---|---|---|---|---|

|
#11
Mariner Bay Blvd
Fort Pierce, FL 34949
|
2,201 sq. feet
|
3 baths 2 beds |
show details | |

|
#12
N 14th St
Fort Pierce, FL 34950
|
960 sq. feet
|
1 baths 2 beds |
show details | |

|
#13
Osceola Ave
Fort Pierce, FL 34982
|
1,024 sq. feet
|
1 baths 2 beds |
show details | |

|
#14
Tortugas Ave
Fort Pierce, FL 34982
|
1,613 sq. feet
|
2 baths 3 beds |
show details | |

|
#15
Penny Ln
Fort Pierce, FL 34951
|
1,300 sq. feet
|
2 baths 3 beds |
show details | |

|
#16
Indiana Ct
Fort Pierce, FL 34947
|
1,408 sq. feet
|
2 baths 2 beds |
show details | |

|
#17
Bartow St
Fort Pierce, FL 34982
|
1,840 sq. feet
|
2 baths 3 beds |
show details | |

|
#18
N 19th St
Fort Pierce, FL 34950
|
2,541 sq. feet
|
2 baths 3 beds |
show details | |

|
#19
Academy Dr
Fort Pierce, FL 34946
|
1,152 sq. feet
|
1 baths 3 beds |
show details | |

|
#20
Avenue I
Fort Pierce, FL 34947
|
740 sq. feet
|
1 baths 2 beds |
show details |
| Photo | Address | Area | Beds / Baths | Price | Details |
|---|---|---|---|---|---|

|
#21
Penny Ln
Fort Pierce, FL 34951
|
1,324 sq. feet
|
2 baths 3 beds |
show details | |

|
#22
Sunberry Cir
Fort Pierce, FL 34951
|
1,377 sq. feet
|
2 baths 3 beds |
show details | |

|
#23
N 43rd St
Fort Pierce, FL 34946
|
1,159 sq. feet
|
1 baths 2 beds |
show details | |

|
#24
Bent Pine Dr
Fort Pierce, FL 34951
|
2,307 sq. feet
|
2 baths 3 beds |
show details | |

|
#25
Evergreen Ave
Fort Pierce, FL 34947
|
1,672 sq. feet
|
2 baths 3 beds |
show details | |

|
#26
Spanish River Rd
Fort Pierce, FL 34951
|
2,853 sq. feet
|
3 baths 5 beds |
show details | |

|
#27
Grovers Rd
Fort Pierce, FL 34951
|
1,398 sq. feet
|
2 baths 3 beds |
show details | |

|
#28
Delaware Ave
Fort Pierce, FL 34950
|
1,692 sq. feet
|
1 baths 2 beds |
show details | |

|
#29
Picante Cir
Fort Pierce, FL 34951
|
1,530 sq. feet
|
2 baths 2 beds |
show details | |

|
#30
North Blvd
Fort Pierce, FL 34951
|
1,444 sq. feet
|
2 baths 3 beds |
show details |
| Photo | Address | Area | Beds / Baths | Price | Details |
|---|---|---|---|---|---|

|
#31
S 30th St
Fort Pierce, FL 34947
|
1,505 sq. feet
|
2 baths 1 beds |
show details | |

|
#32
Sunset Blvd
Fort Pierce, FL 34982
|
1,933 sq. feet
|
2 baths 3 beds |
show details | |

|
#33
Bayard Rd
Fort Pierce, FL 34951
|
1,224 sq. feet
|
2 baths 2 beds |
show details | |

|
#34
Holiday Ct
Fort Pierce, FL 34982
|
2,486 sq. feet
|
2 baths 3 beds |
show details | |

|
#35
Edgevale Rd
Fort Pierce, FL 34982
|
1,736 sq. feet
|
2 baths 2 beds |
show details | |

|
#36
S 34th St
Fort Pierce, FL 34947
|
1,376 sq. feet
|
2 baths 2 beds |
show details | |

|
#37
Palomar St
Fort Pierce, FL 34951
|
1,014 sq. feet
|
2 baths 2 beds |
show details | |

|
#38
Seagrape Dr
Fort Pierce, FL 34982
|
1,247 sq. feet
|
2 baths 3 beds |
show details | |

|
#39
E Sanderling Ln # C2
Fort Pierce, FL 34982
|
1,330 sq. feet
|
2 baths 2 beds |
show details | |

|
#40
N 41st St
Fort Pierce, FL 34946
|
720 sq. feet
|
1 baths 2 beds |
show details |
| Photo | Address | Area | Beds / Baths | Price | Details |
|---|---|---|---|---|---|

|
#41
Savannah St
Fort Pierce, FL 34982
|
1,884 sq. feet
|
2 baths 4 beds |
show details | |

|
#42
Sunset Blvd
Fort Pierce, FL 34982
|
1,764 sq. feet
|
2 baths 3 beds |
show details | |

|
#43
Belleair Ave
Fort Pierce, FL 34951
|
1,316 sq. feet
|
2 baths 3 beds |
show details | |

|
#44
Citrus Ave
Fort Pierce, FL 34982
|
1,784 sq. feet
|
2 baths 3 beds |
show details | |

|
#45
Saint Lucie Blvd Apt 26
Fort Pierce, FL 34946
|
1,290 sq. feet
|
2 baths 2 beds |
show details | |

|
#46
Oleander Blvd
Fort Pierce, FL 34950
|
2,500 sq. feet
|
3 baths 3 beds |
show details | |

|
#47
Avenue O
Fort Pierce, FL 34950
|
816 sq. feet
|
1 baths 3 beds |
show details | |

|
#48
N 37th St
Fort Pierce, FL 34947
|
1,024 sq. feet
|
1 baths 3 beds |
show details | |

|
#49
Okeechobee Rd
Fort Pierce, FL 34945
|
1,418 sq. feet
|
3 baths - beds |
show details | |

|
Check over 1 million property listings on Foreclosure.com!
|
browse all offers | |||


Median year apartment built: 1986
Household type by relationship:
Households: 50,537- Male householders: 7,987 (2,804 living alone), Female householders: 11,272 (3,829 living alone)
6,624 spouses (6,549 opposite-sex spouses), 1,348 unmarried partners, (1,332 opposite-sex unmarried partners), 15,069 children (14,158 natural, 519 adopted, 391 stepchildren), 1,983 grandchildren, 372 brothers or sisters, 1,041 parents, 0 foster children, 1,350 other relatives, 2,677 non-relatives
- In group quarters: 808
Size of family households: 5,421 2-persons, 2,436 3-persons, 1,462 4-persons, 770 5-persons, 425 6-persons, 632 7-or-more-persons.
Size of nonfamily households: 7,046 1-person, 995 2-persons, 70 3-persons, 54 4-persons.
3,773 married couples with children.
5,836 single-parent households (1,402 men, 4,434 women).
72.1% of residents of Fort Pierce speak English at home.
16.0% of residents speak Spanish at home (59% speak English very well, 20% speak English well, 16% speak English not well, 5% don't speak English at all).
10.9% of residents speak other Indo-European language at home (53% speak English very well, 13% speak English well, 16% speak English not well, 17% don't speak English at all).
0.5% of residents speak Asian or Pacific Island language at home (67% speak English very well, 21% speak English well, 12% speak English not well).
0.7% of residents speak other language at home (74% speak English very well, 13% speak English well, 12% speak English not well).
Foreign born population: 8,503 (16.8%)
(40.4% of them are naturalized citizens)
| Here: | 5.3 |
| State: | 5.9 |
| Here: | 4.4 |
| State: | 4.2 |

- Bedrooms in owner-occupied houses and condos in Fort Pierce, Florida
- 42no bedroom
- 3061 bedroom
- 3,5692 bedrooms
- 4,1163 bedrooms
- 9324 bedrooms
- 625+ bedrooms

- Bedrooms in renter-occupied apartments in Fort Pierce, Florida
- 819no bedroom
- 2,0311 bedroom
- 4,0522 bedrooms
- 2,2353 bedrooms
- 7764 bedrooms
- 1365+ bedrooms

- Cars and other vehicles available in Fort Pierce in owner-occupied houses/condos
- 324no vehicle
- 4,1121 vehicle
- 3,2092 vehicles
- 1,0443 vehicles
- 2804 vehicles
- 575+ vehicles

- Cars and other vehicles available in Fort Pierce in renter-occupied apartments
- 1,881no vehicle
- 5,1091 vehicle
- 2,0112 vehicles
- 9733 vehicles
- 104 vehicles
- 655+ vehicles

- Rooms in owner-occupied houses in Fort Pierce, Florida
- 331 room
- 762 rooms
- 3643 rooms
- 1,8504 rooms
- 2,5225 rooms
- 1,7476 rooms
- 1,0787 rooms
- 5758 rooms
- 7809+ rooms

- Rooms in renter-occupied apartments in Fort Pierce, Florida
- 7971 room
- 2542 rooms
- 1,0773 rooms
- 2,7864 rooms
- 2,6395 rooms
- 1,4166 rooms
- 7147 rooms
- 2148 rooms
- 1519+ rooms


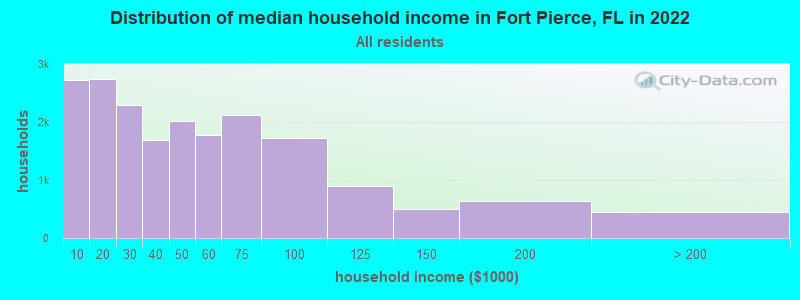
Fort Pierce, FL household income distribution

- 2,718Less than $10,000
- 2,744$10,000 to $19,999
- 2,290$20,000 to $29,999
- 1,698$30,000 to $39,999
- 2,025$40,000 to $49,999
- 1,781$50,000 to $59,999
- 2,120$60,000 to $74,999
- 1,726$75,000 to $99,999
- 897$100,000 to $124,999
- 500$125,000 to $149,999
- 645$150,000 to $199,999
- 451$200,000 or more
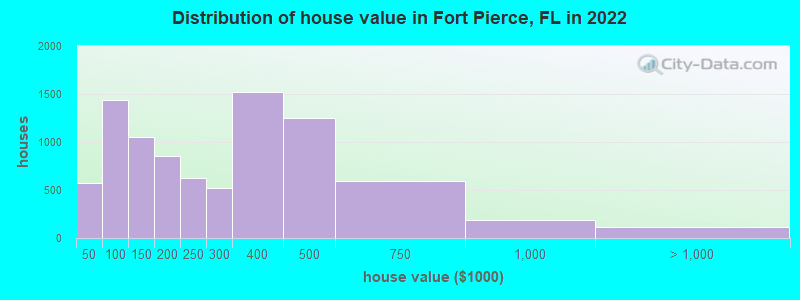
Home value of owner - occupied houses in 2022 in Fort Pierce, FL
-
- 19Less than $10,000
- 44$10,000 to $14,999
- 4$15,000 to $19,999
- 40$20,000 to $24,999
- 34$25,000 to $29,999
- 160$30,000 to $34,999
- 72$35,000 to $39,999
- 199$40,000 to $49,999
- 334$50,000 to $59,999
- 308$60,000 to $69,999
- 141$70,000 to $79,999
- 194$80,000 to $89,999
- 256$90,000 to $99,999
- 715$100,000 to $124,999
- 336$125,000 to $149,999
- 477$150,000 to $174,999
- 375$175,000 to $199,999
- 622$200,000 to $249,999
- 519$250,000 to $299,999
- 1,520$300,000 to $399,999
- 1,244$400,000 to $499,999
- 590$500,000 to $749,999
- 189$750,000 to $999,999
- 86$1,000,000 to $1,499,999
- 25$2,000,000 or more
Rent paid by renters in 2022 in Fort Pierce, FL
-
- 331Less than $100
- 593$100 to $149
- 177$150 to $199
- 129$200 to $249
- 94$250 to $299
- 42$300 to $349
- 60$350 to $399
- 291$400 to $449
- 186$450 to $499
- 169$500 to $549
- 300$550 to $599
- 413$600 to $649
- 316$650 to $699
- 265$700 to $749
- 246$750 to $799
- 664$800 to $899
- 1,407$900 to $999
- 2,126$1,000 to $1,249
- 460$1,250 to $1,499
- 189$1,500 to $1,999
- 198$2,000 to $2,499
- 50$3,500 or more
- 369No cash rent


Percentage of workers working in this county: 82.2%
Number of people working at home: 1,758 (9.5% of all workers)
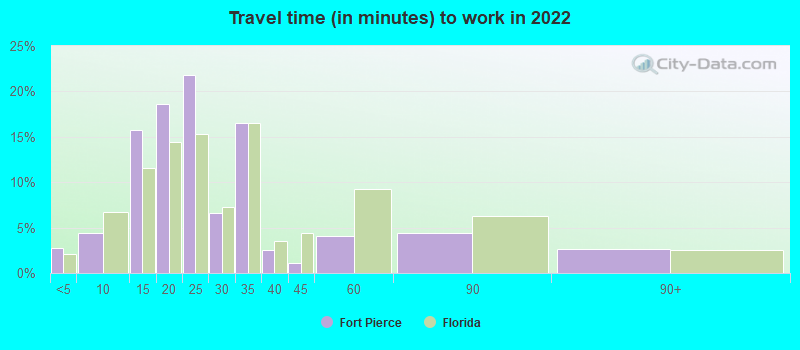
Travel time to work (commute)
- Less than 5 minutes: 351
- 5 to 9 minutes: 845
- 10 to 14 minutes: 2,928
- 15 to 19 minutes: 3,151
- 20 to 24 minutes: 2,372
- 25 to 29 minutes: 677
- 30 to 34 minutes: 3,174
- 35 to 39 minutes: 389
- 40 to 44 minutes: 226
- 45 to 59 minutes: 1,234
- 60 to 89 minutes: 770
- 90 or more minutes: 244
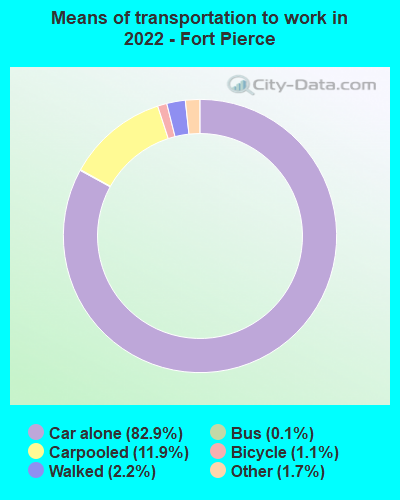
Means of transportation to work:
- Drove a car alone: 21,278 (73.9%)
- Carpooled: 3,534 (12.3%)
- Bus: 29 (0.1%)
- Taxi: 686 (2.4%)
- Bicycle: 494 (1.7%)
- Walked: 588 (2.0%)
- Worked at home: 1,758 (6.1%)

- Unemployment by race in 2022
- Unemployment rate for White non-Hispanic residents
- 7.5%Males
- 8.1%Females
- Unemployment rate for Black residents
- 15.3%Males
- 20.6%Females
- Unemployment rate for American Indian and Alaska Native residents
- 100.0%Females
- Unemployment rate for other race residents
- 1.4%Males
- Unemployment rate for two or more race residents
- 13.6%Males
- Unemployment rate for Hispanic or Latino residents
- 5.5%Males
- 1.9%Females

- Year of entry for the foreign-born population in Fort Pierce, Florida
- 3,6022010 or later
- 2,1112000 to 2009
- 1,5281990 to 1999
- 1,6551980 to 1989
- 7261970 to 1979
- 471Before 1970
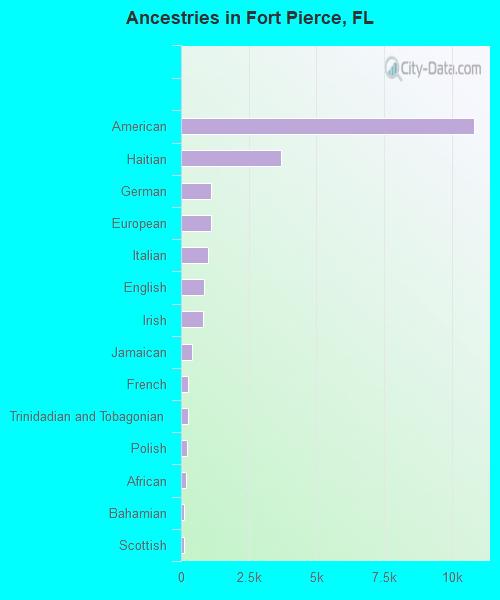
First ancestries reported:
- American: 10,839 (31.4%)
- Haitian: 3,712 (10.7%)
- German: 1,122 (3.2%)
- European: 1,113 (3.2%)
- Italian: 1,004 (2.9%)
- English: 863 (2.5%)
- Irish: 829 (2.4%)
- Jamaican: 407 (1.2%)
- French: 251 (0.7%)
- Trinidadian and Tobagonian: 242 (0.7%)
- Polish: 204 (0.6%)
- African: 203 (0.6%)
- Bahamian: 129 (0.4%)
- Scottish: 123 (0.4%)
- South African: 98 (0.3%)
- French Canadian: 86 (0.2%)
- Brazilian: 80 (0.2%)
- Slavic: 56 (0.2%)
- Norwegian: 54 (0.2%)
- Swedish: 51 (0.1%)
- British: 40 (0.1%)
- Iranian: 39 (0.1%)
- Scotch-Irish: 32 (0.09%)
- Turkish: 29 (0.08%)
- Northern European: 28 (0.08%)
- Guyanese: 28 (0.08%)
- Eastern European: 25 (0.07%)
- Canadian: 23 (0.07%)
- Dutch: 22 (0.06%)
- Russian: 18 (0.05%)
- West Indian: 18 (0.05%)
- Maltese: 17 (0.05%)
- British West Indian: 16 (0.05%)
- Austrian: 15 (0.04%)
- Greek: 13 (0.04%)
- Welsh: 11 (0.03%)
Most common places of birth for foreign-born residents (%):
| Fort Pierce: | 36.4% (2,960) |
| Florida: | 7.5% (342,375) |
| Fort Pierce: | 17.7% (1,440) |
| Florida: | 5.6% (257,152) |
| Fort Pierce: | 5.9% (481) |
| Florida: | 5.0% (227,319) |
| Fort Pierce: | 5.2% (425) |
| Florida: | 2.1% (97,632) |
| Fort Pierce: | 4.9% (399) |
| Florida: | 22.0% (1,006,576) |
| Fort Pierce: | 4.1% (336) |
| Florida: | 2.1% (94,349) |
| Fort Pierce: | 2.9% (237) |
| Florida: | 5.7% (262,042) |
| Fort Pierce: | 2.4% (195) |
| Florida: | 2.7% (122,906) |
| Fort Pierce: | 2.3% (184) |
| Florida: | 0.3% (13,569) |
| Fort Pierce: | 2.2% (179) |
| Florida: | 0.4% (17,749) |
| Fort Pierce: | 1.7% (137) |
| Florida: | 3.0% (137,727) |
Place of birth for U.S.-born residents:
- This state: 25,206
- Other state: 16,006
- Northeast: 7,111
- Midwest: 2,477
- South: 5,555
- West: 774
88.5% of Fort Pierce residents lived in the same house 1 years ago.
Out of people who lived in different houses, 31.3% lived in this county.
Out of people who lived in different counties, 49.9% lived in Florida.
| Fort Pierce: | 88.5% |
| State average: | 86.3% |
Education attainment for males 25 years and older:
- No schooling: 601
- Nursery to 4th grade: 202
- 5th and 6th grade: 64
- 7th and 8th grade: 345
- 9th grade: 815
- 10th grade: 361
- 11th grade: 986
- 12th grade, no diploma: 325
- High school graduate (or equivalency): 4,579
- Less than 1 year of college: 1,130
- Some college more than 1 year, no degree: 2,255
- Associate degree: 899
- Bachelor's degree: 1,555
- Master's degree: 933
- Professional school degree: 395
- Doctorate degree: 295

Education attainment for females 25 years and older:
- No schooling: 439
- Nursery to 4th grade: 28
- 5th and 6th grade: 207
- 7th and 8th grade: 459
- 9th grade: 154
- 10th grade: 837
- 11th grade: 269
- 12th grade, no diploma: 337
- High school graduate (or equivalency): 5,699
- Less than 1 year of college: 1,478
- Some college more than 1 year, no degree: 1,520
- Associate degree: 2,212
- Bachelor's degree: 2,569
- Master's degree: 1,166
- Professional school degree: 110
- Doctorate degree: 153


Housing units in structures:
- One, detached: 9,083
- One, attached: 1,166
- Two: 2,193
- 3 or 4: 3,233
- 5 to 9: 2,466
- 10 to 19: 2,279
- 20 to 49: 1,826
- 50 or more: 991
- Mobile homes: 588
Median worth of mobile homes: $30,622
Housing units lacking complete kitchen facilities in 2022: 2.1%
House/condo owner moved in on average 11 years ago
Renter moved in on average 2 years ago

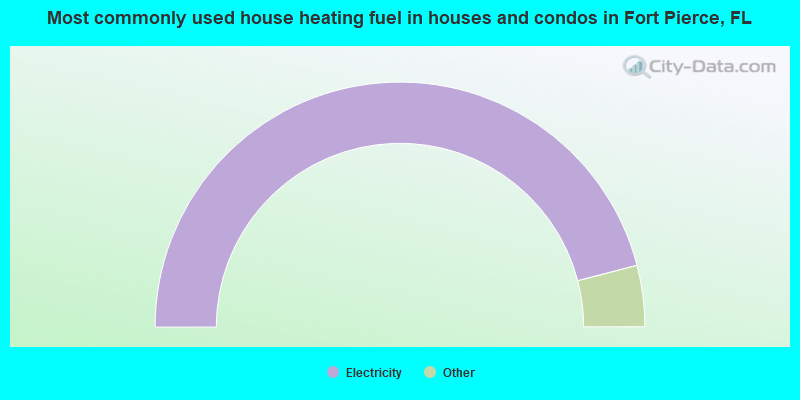
- 91.9%Electricity
- 3.2%Utility gas
- 2.9%No fuel used
- 1.4%Bottled, tank, or LP gas
- 0.4%Solar energy
- 0.2%Wood
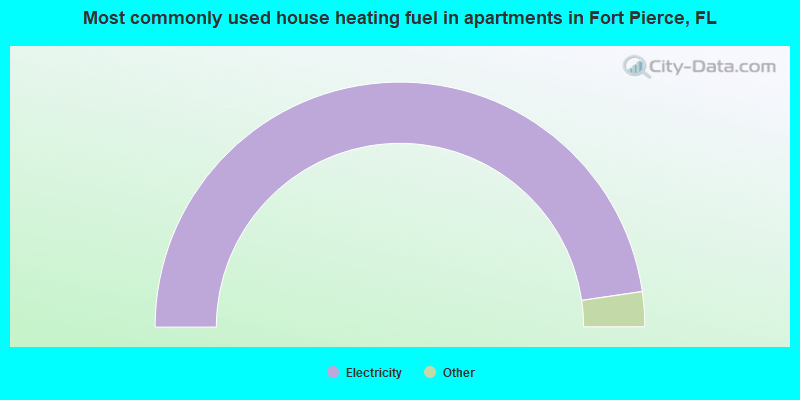
- 95.4%Electricity
- 2.1%No fuel used
- 1.7%Utility gas
- 0.4%Fuel oil, kerosene, etc.
- 0.3%Bottled, tank, or LP gas
- 0.2%Other fuel
Private vs. public school enrollment:
| Here: | 8.3% |
| Florida: | 15.8% |
| Here: | 13.0% |
| Florida: | 12.9% |
| Here: | 13.4% |
| Florida: | 23.6% |


