Fort Meade, MD (Maryland) Houses and Residents
| Fort Meade: | |
| Maryland: |
Total population: 9,327 (All urban)
Houses: 3,429 (2,979 occupied: 7 owner occupied, 2,991 renter occupied)
| % of renters here: | 100% |
| State: | 32% |
Housing density: 521 houses/condos per square mile
Median price asked for vacant for-sale houses and condos in 2022 in this county: $157,543.
Median contract rent in 2022: over $2,000 (lower quartile is $1,821, upper quartile is over $2,000)
Median rent asked for vacant for-rent units in 2022: $2,517
Median gross rent in Fort Meade, MD in 2022: over $2,000
Housing units in Fort Meade with a mortgage: 0 (0 second mortgage, 0 home equity loan, 0 both second mortgage and home equity loan)
Houses without a mortgage: 0
Compare current foreclosures near Fort Meade, MD:
| Photo | Address | Area | Beds / Baths | Price | Details |
|---|---|---|---|---|---|

|
#1
Light St
Baltimore, MD 21230
|
1,554 sq. feet
|
1 baths 2 beds |
$254,900
|
show details |

|
#2
Wicklow Rd
Baltimore, MD 21229
|
1,152 sq. feet
|
1 baths 3 beds |
$112,000
|
show details |

|
#3
Francis St
Baltimore, MD 21217
|
2,038 sq. feet
|
2 baths 4 beds |
$45,500
|
show details |

|
#4
Roxy Dr
Windsor Mill, MD 21244
|
2,880 sq. feet
|
2 baths 4 beds |
$486,000
|
show details |

|
#5
Heming Ln
Bowie, MD 20716
|
1,800 sq. feet
|
2 baths 3 beds |
$400,000
|
show details |

|
#6
23rd Pl
Hyattsville, MD 20783
|
1,188 sq. feet
|
2 baths 4 beds |
$379,600
|
show details |

|
#7
E 28th St
Baltimore, MD 21218
|
1,244 sq. feet
|
1 baths 2 beds |
$298,900
|
show details |

|
#8
Bay Ridge Rd
Edgewater, MD 21037
|
2,951 sq. feet
|
3 baths 3 beds |
$615,000
|
show details |

|
#9
3rd St
Lanham, MD 20706
|
1,104 sq. feet
|
2 baths 3 beds |
$369,200
|
show details |

|
#10
Hammersmith Cir
Silver Spring, MD 20906
|
1,152 sq. feet
|
1 baths 3 beds |
$328,600
|
show details |
| Photo | Address | Area | Beds / Baths | Price | Details |
|---|---|---|---|---|---|

|
#11
E Ostend St
Baltimore, MD 21230
|
1,470 sq. feet
|
2 baths 2 beds |
$364,000
|
show details |

|
#12
Fitzgibbon Ct
Bowie, MD 20721
|
1,300 sq. feet
|
2 baths 3 beds |
$369,200
|
show details |

|
#13
S Bouldin St
Baltimore, MD 21224
|
1,160 sq. feet
|
2 baths 2 beds |
$259,900
|
show details |

|
#14
N Decker Ave
Baltimore, MD 21213
|
950 sq. feet
|
1 baths 2 beds |
$145,000
|
show details |

|
#15
N Curley St
Baltimore, MD 21224
|
1,008 sq. feet
|
1 baths 3 beds |
$41,000
|
show details |

|
#16
Rayner Ave
Baltimore, MD 21216
|
1,456 sq. feet
|
1 baths 3 beds |
$42,900
|
show details |

|
#17
Baker St
Baltimore, MD 21216
|
1,500 sq. feet
|
1 baths 3 beds |
$54,900
|
show details |

|
#18
Piano Ln # 99
Silver Spring, MD 20904
|
1,377 sq. feet
|
2 baths 3 beds |
show details | |

|
#19
Braden Loop
Glen Burnie, MD 21061
|
2,513 sq. feet
|
2 baths 3 beds |
show details | |

|
#20
5th St
Brooklyn, MD 21225
|
1,232 sq. feet
|
1 baths - beds |
$49,900
|
show details |
| Photo | Address | Area | Beds / Baths | Price | Details |
|---|---|---|---|---|---|

|
#21
Kathland Ave
Gwynn Oak, MD 21207
|
2,942 sq. feet
|
2 baths 5 beds |
show details | |

|
#22
Carlisle Ave
Baltimore, MD 21216
|
2,028 sq. feet
|
2 baths 4 beds |
show details | |

|
#23
Benhill Ave
Curtis Bay, MD 21226
|
1,034 sq. feet
|
1 baths 2 beds |
show details | |

|
#24
Myrtle Ave
Bowie, MD 20720
|
3,436 sq. feet
|
2 baths 4 beds |
show details | |

|
#25
Marksworth Rd
Gwynn Oak, MD 21207
|
1,720 sq. feet
|
3 baths 3 beds |
show details | |

|
#26
Monticello Rd
Baltimore, MD 21216
|
1,984 sq. feet
|
3 baths 3 beds |
show details | |

|
#27
Maryland Ave
Baltimore, MD 21218
|
3,888 sq. feet
|
4 baths 6 beds |
show details | |

|
#28
N Calvert St
Baltimore, MD 21218
|
3,200 sq. feet
|
3 baths 9 beds |
show details | |

|
#29
Manheim Ave
Beltsville, MD 20705
|
992 sq. feet
|
2 baths 4 beds |
show details | |

|
#30
Manor Ln
Ellicott City, MD 21042
|
864 sq. feet
|
1 baths 2 beds |
show details |
| Photo | Address | Area | Beds / Baths | Price | Details |
|---|---|---|---|---|---|

|
#31
Kinship Rd
Dundalk, MD 21222
|
1,044 sq. feet
|
1 baths 3 beds |
show details | |

|
#32
Washburn Ave
Brooklyn, MD 21225
|
2,318 sq. feet
|
2 baths 4 beds |
show details | |

|
#33
Lyndhurst Ave
Baltimore, MD 21216
|
1,998 sq. feet
|
2 baths 4 beds |
show details | |

|
#34
Cypress St
Curtis Bay, MD 21226
|
656 sq. feet
|
1 baths 1 beds |
show details | |

|
#35
Henderson Chapel Ln
Bowie, MD 20720
|
4,002 sq. feet
|
3 baths 4 beds |
show details | |

|
#36
Dorchester Rd
Glen Burnie, MD 21060
|
1,586 sq. feet
|
2 baths 4 beds |
show details | |

|
#37
Coolidge Ave
Baltimore, MD 21229
|
1,252 sq. feet
|
1 baths 3 beds |
show details | |

|
#38
Weather Worn Way Unit B
Columbia, MD 21046
|
1,146 sq. feet
|
2 baths - beds |
show details | |

|
#39
Clifton Ave
Baltimore, MD 21217
|
- sq. feet
|
1 baths 3 beds |
show details | |

|
#40
Oakview Village Drive
Glen Burnie, MD 21061
|
2,790 sq. feet
|
2 baths - beds |
show details |
| Photo | Address | Area | Beds / Baths | Price | Details |
|---|---|---|---|---|---|

|
#41
N Ashburton St
Baltimore, MD 21216
|
1,166 sq. feet
|
1 baths 3 beds |
show details | |

|
#42
James St
Baltimore, MD 21223
|
1,378 sq. feet
|
1 baths 1 beds |
show details | |

|
#43
Cedar Dr
Gwynn Oak, MD 21207
|
1,834 sq. feet
|
2 baths 4 beds |
show details | |

|
#44
Penhurst Ave
Baltimore, MD 21215
|
2,743 sq. feet
|
3 baths 6 beds |
show details | |

|
#45
Whitmore Ave
Baltimore, MD 21216
|
1,102 sq. feet
|
2 baths 4 beds |
show details | |

|
#46
Saddle Creek Drive
Burtonsville, MD 20866
|
3,222 sq. feet
|
2 baths 4 beds |
show details | |

|
#47
Cleveland St
Baltimore, MD 21230
|
1,232 sq. feet
|
1 baths 3 beds |
show details | |

|
#48
Dillon St
Baltimore, MD 21224
|
1,800 sq. feet
|
2 baths 3 beds |
show details | |

|
#49
N Curley St
Baltimore, MD 21205
|
974 sq. feet
|
1 baths 2 beds |
show details | |

|
Check over 1 million property listings on Foreclosure.com!
|
browse all offers | |||


Household type by relationship:
Households: 10,099- Male householders: 2,115 (205 living alone), Female householders: 848 (96 living alone)
2,147 spouses (2,110 opposite-sex spouses), 5 unmarried partners, (5 opposite-sex unmarried partners), 3,478 children (3,329 natural, 46 adopted, 102 stepchildren), 150 grandchildren, 34 brothers or sisters, 242 parents, 0 foster children, 60 other relatives, 380 non-relatives
- In group quarters: 636
Size of family households: 626 2-persons, 758 3-persons, 450 4-persons, 277 5-persons, 172 6-persons, 32 7-or-more-persons.
Size of nonfamily households: 317 1-person, 295 2-persons, 32 3-persons.
2,819 married couples with children.
321 single-parent households (35 men, 286 women).
79.5% of residents of Fort Meade speak English at home.
6.9% of residents speak Spanish at home (74% speak English very well, 16% speak English well, 9% speak English not well, 2% don't speak English at all).
2.4% of residents speak other Indo-European language at home (61% speak English very well, 25% speak English well, 14% speak English not well).
9.1% of residents speak Asian or Pacific Island language at home (78% speak English very well, 8% speak English well, 5% speak English not well, 9% don't speak English at all).
0.9% of residents speak other language at home (96% speak English very well, 4% speak English not well).
Foreign born population: 926 (9.2%)
(68.9% of them are naturalized citizens)
| Here: | -666666666.0 |
| State: | 7.3 |
| Here: | 5.1 |
| State: | 4.2 |
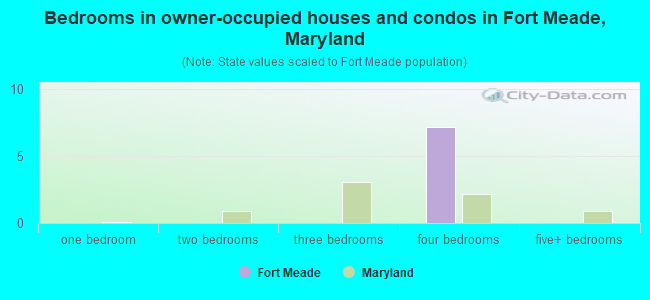
- Bedrooms in owner-occupied houses and condos in Fort Meade, Maryland
- 0no bedroom
- 01 bedroom
- 02 bedrooms
- 03 bedrooms
- 74 bedrooms
- 05+ bedrooms
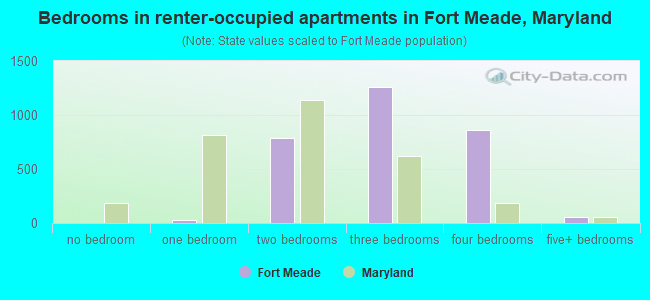
- Bedrooms in renter-occupied apartments in Fort Meade, Maryland
- 0no bedroom
- 301 bedroom
- 7882 bedrooms
- 1,2583 bedrooms
- 8604 bedrooms
- 555+ bedrooms
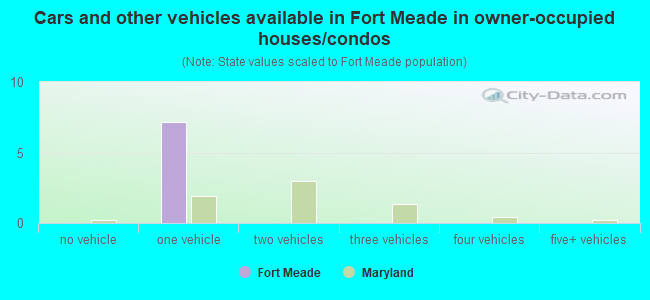
- Cars and other vehicles available in Fort Meade in owner-occupied houses/condos
- 0no vehicle
- 71 vehicle
- 02 vehicles
- 03 vehicles
- 04 vehicles
- 05+ vehicles
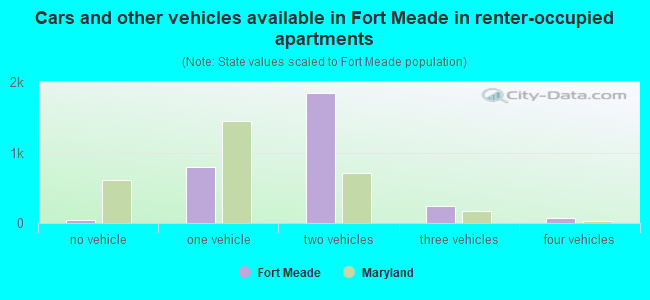
- Cars and other vehicles available in Fort Meade in renter-occupied apartments
- 49no vehicle
- 7991 vehicle
- 1,8372 vehicles
- 2373 vehicles
- 694 vehicles
- 05+ vehicles
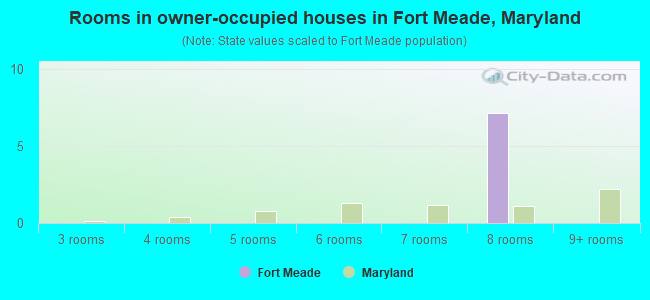
- Rooms in owner-occupied houses in Fort Meade, Maryland
- 01 room
- 02 rooms
- 03 rooms
- 04 rooms
- 05 rooms
- 06 rooms
- 07 rooms
- 78 rooms
- 09+ rooms
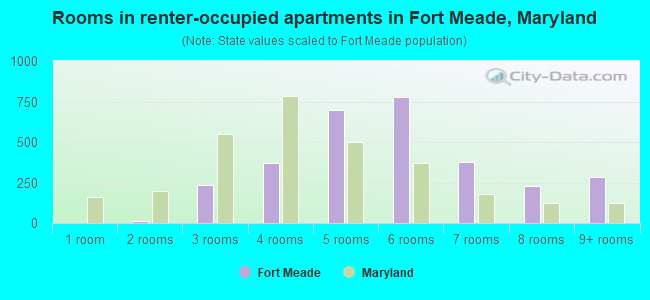
- Rooms in renter-occupied apartments in Fort Meade, Maryland
- 01 room
- 142 rooms
- 2353 rooms
- 3724 rooms
- 6975 rooms
- 7806 rooms
- 3777 rooms
- 2318 rooms
- 2879+ rooms
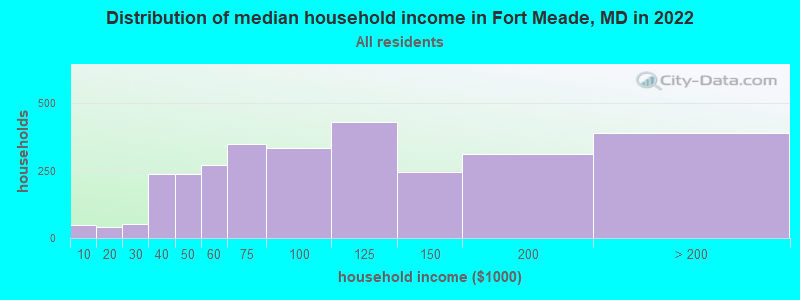
Fort Meade, MD household income distribution

- 49Less than $10,000
- 41$10,000 to $19,999
- 53$20,000 to $29,999
- 236$30,000 to $39,999
- 236$40,000 to $49,999
- 270$50,000 to $59,999
- 349$60,000 to $74,999
- 334$75,000 to $99,999
- 431$100,000 to $124,999
- 245$125,000 to $149,999
- 312$150,000 to $199,999
- 390$200,000 or more
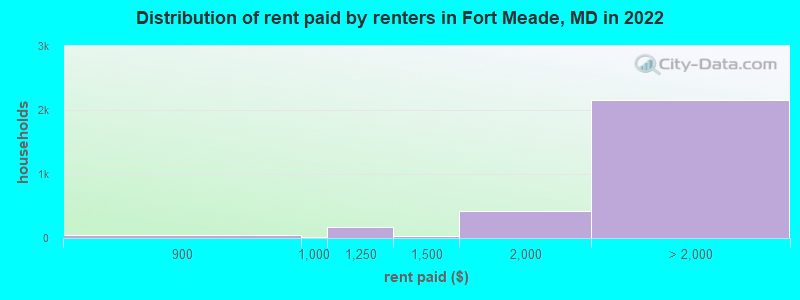
Rent paid by renters in 2022 in Fort Meade, MD
-
- 11$550 to $599
- 41$800 to $899
- 8$900 to $999
- 173$1,000 to $1,249
- 31$1,250 to $1,499
- 421$1,500 to $1,999
- 1,117$2,000 to $2,499
- 834$2,500 to $2,999
- 145$3,000 to $3,499
- 13$3,500 or more
- 40No cash rent
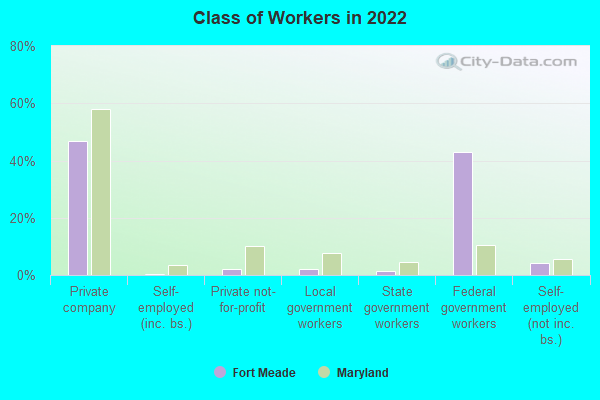
Percentage of workers working in this county: 87.4%
Number of people working at home: 472 (9.5% of all workers)
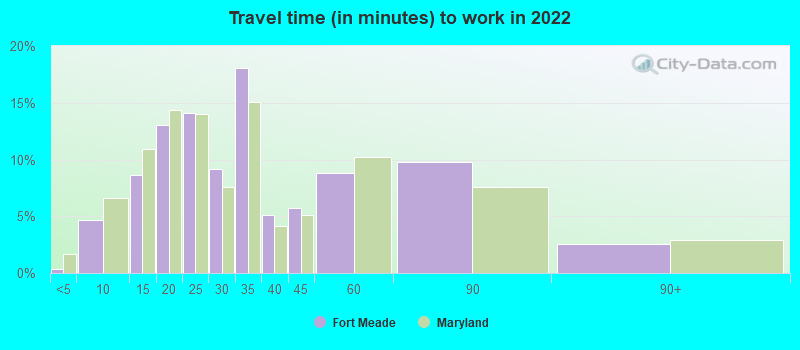
Travel time to work (commute)
- Less than 5 minutes: 96
- 5 to 9 minutes: 1,019
- 10 to 14 minutes: 929
- 15 to 19 minutes: 976
- 20 to 24 minutes: 620
- 25 to 29 minutes: 122
- 30 to 34 minutes: 151
- 35 to 39 minutes: 35
- 40 to 44 minutes: 70
- 45 to 59 minutes: 137
- 60 to 89 minutes: 233
- 90 or more minutes: 36
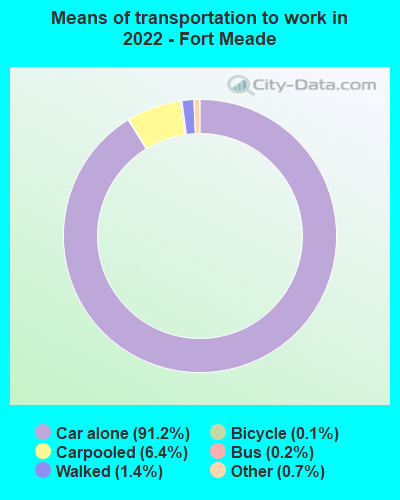
Means of transportation to work:
- Drove a car alone: 24,846 (85.6%)
- Carpooled: 1,766 (6.1%)
- Bus: 24 (0.1%)
- Subway or elevated rail: 6 (0.0%)
- Long-distance train or commuter rail: 3 (0.0%)
- Ferryboat: 1 (0.0%)
- Taxi: 218 (0.8%)
- Bicycle: 33 (0.1%)
- Walked: 389 (1.3%)
- Worked at home: 472 (1.6%)
- Unemployment by race in 2022
- Unemployment rate for White non-Hispanic residents
- 0.6%Males
- 5.0%Females
- Unemployment rate for Black residents
- 6.5%Males
- 1.4%Females
- Unemployment rate for Asian residents
- 3.0%Females
- Unemployment rate for two or more race residents
- 5.3%Females
- Unemployment rate for Hispanic or Latino residents
- 2.5%Males
- 1.6%Females
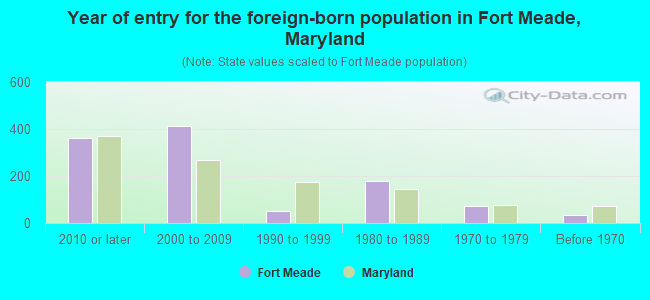
- Year of entry for the foreign-born population in Fort Meade, Maryland
- 3602010 or later
- 4112000 to 2009
- 521990 to 1999
- 1801980 to 1989
- 711970 to 1979
- 33Before 1970
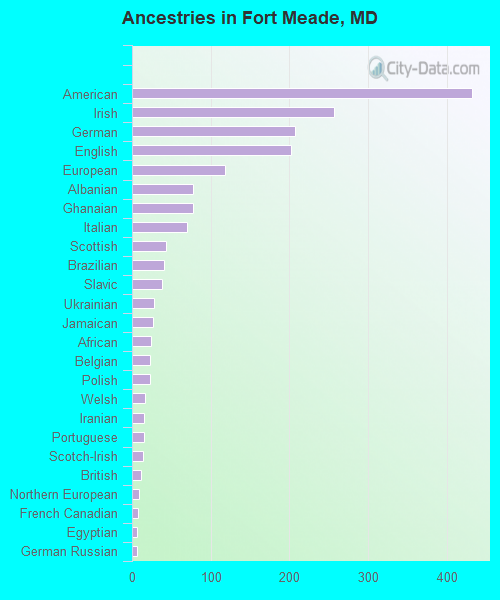
First ancestries reported:
- American: 432 (8.7%)
- Irish: 257 (5.2%)
- German: 207 (4.2%)
- English: 202 (4.1%)
- European: 118 (2.4%)
- Albanian: 78 (1.6%)
- Ghanaian: 78 (1.6%)
- Italian: 70 (1.4%)
- Scottish: 43 (0.9%)
- Brazilian: 41 (0.8%)
- Slavic: 38 (0.8%)
- Ukrainian: 28 (0.6%)
- Jamaican: 27 (0.5%)
- African: 24 (0.5%)
- Belgian: 23 (0.5%)
- Polish: 23 (0.5%)
- Welsh: 16 (0.3%)
- Iranian: 15 (0.3%)
- Portuguese: 15 (0.3%)
- Scotch-Irish: 14 (0.3%)
- British: 12 (0.2%)
- Northern European: 9 (0.2%)
- French Canadian: 7 (0.1%)
- Egyptian: 6 (0.1%)
- German Russian: 6 (0.1%)
- British West Indian: 6 (0.1%)
- Jordanian: 5 (0.1%)
- Moroccan: 4 (0.08%)
- Guyanese: 4 (0.08%)
- Macedonian: 4 (0.08%)
Most common places of birth for foreign-born residents (%):
| Fort Meade: | 30.5% (292) |
| Maryland: | 3.8% (36,698) |
| Fort Meade: | 20.0% (191) |
| Maryland: | 4.6% (44,742) |
| Fort Meade: | 7.7% (74) |
| Maryland: | 6.4% (61,725) |
| Fort Meade: | 5.3% (51) |
| Maryland: | 3.5% (34,065) |
| Fort Meade: | 4.3% (41) |
| Maryland: | 0.7% (6,326) |
| Fort Meade: | 3.6% (34) |
| Maryland: | 3.4% (32,635) |
| Fort Meade: | 3.2% (31) |
| Maryland: | 0.3% (2,949) |
| Fort Meade: | 3.1% (30) |
| Maryland: | 1.2% (11,980) |
| Fort Meade: | 3.0% (29) |
| Maryland: | 1.8% (17,774) |
| Fort Meade: | 2.1% (20) |
| Maryland: | 0.1% (738) |
| Fort Meade: | 1.8% (17) |
| Maryland: | 1.2% (11,265) |
Place of birth for U.S.-born residents:
- This state: 1,350
- Other state: 7,347
- Northeast: 1,155
- Midwest: 1,151
- South: 3,479
- West: 1,683
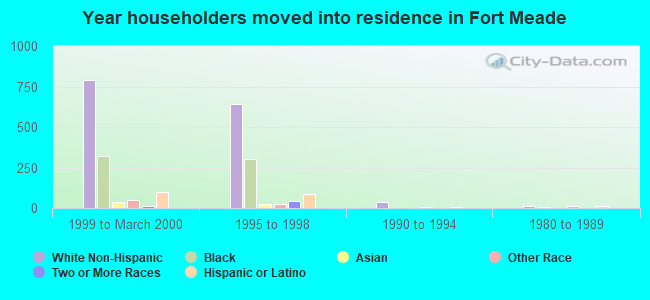
67.6% of Fort Meade residents lived in the same house 1 years ago.
Out of people who lived in different houses, 15.4% lived in this county.
Out of people who lived in different counties, 26.2% lived in Maryland.
| Fort Meade: | 67.6% |
| State average: | 88.5% |
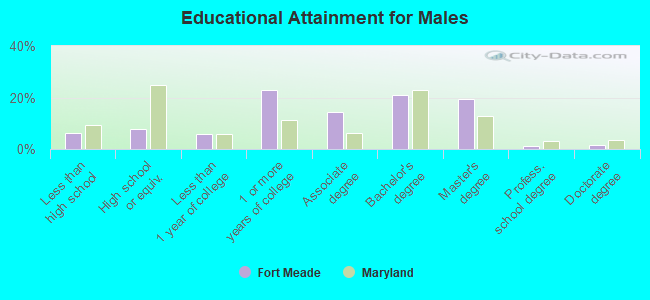
Education attainment for males 25 years and older:
- No schooling: 44
- Nursery to 4th grade: 0
- 5th and 6th grade: 0
- 7th and 8th grade: 0
- 9th grade: 0
- 10th grade: 5
- 11th grade: 46
- 12th grade, no diploma: 75
- High school graduate (or equivalency): 216
- Less than 1 year of college: 159
- Some college more than 1 year, no degree: 627
- Associate degree: 390
- Bachelor's degree: 576
- Master's degree: 527
- Professional school degree: 28
- Doctorate degree: 40
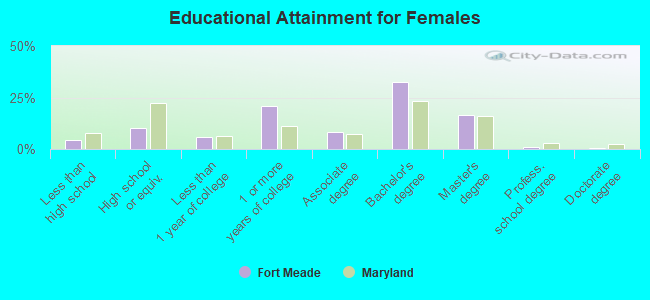
Education attainment for females 25 years and older:
- No schooling: 20
- Nursery to 4th grade: 0
- 5th and 6th grade: 0
- 7th and 8th grade: 0
- 9th grade: 0
- 10th grade: 0
- 11th grade: 0
- 12th grade, no diploma: 99
- High school graduate (or equivalency): 265
- Less than 1 year of college: 149
- Some college more than 1 year, no degree: 544
- Associate degree: 216
- Bachelor's degree: 855
- Master's degree: 433
- Professional school degree: 19
- Doctorate degree: 11


Housing units in structures:
- One, detached: 582
- One, attached: 2,123
- Two: 143
- 3 or 4: 88
- 5 to 9: 55
- 10 to 19: 232
- 20 to 49: 128
- 50 or more: 75
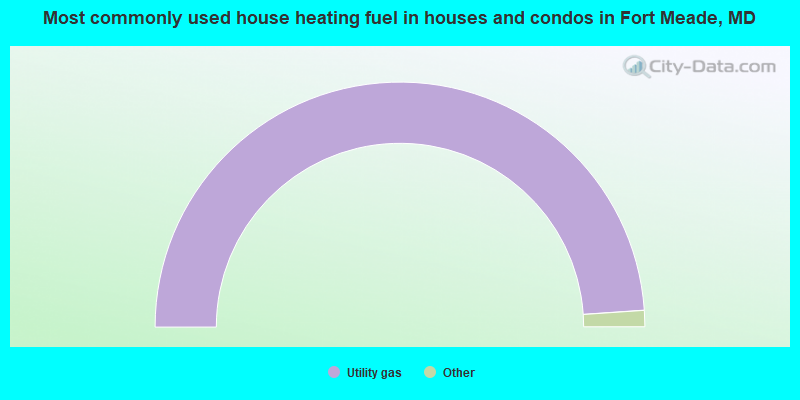
- 100.0%Utility gas
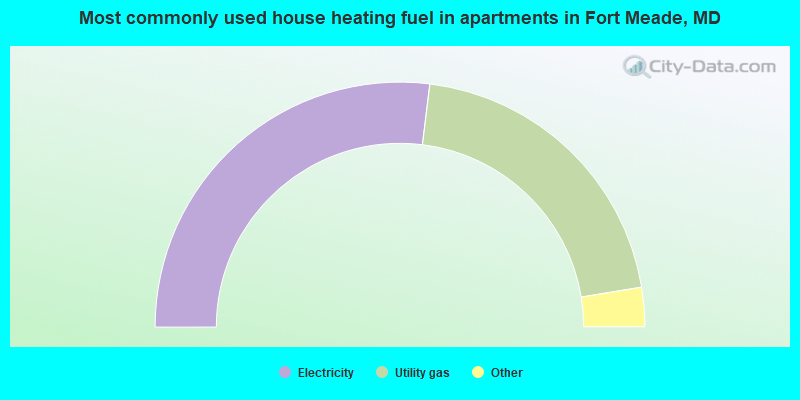
- 53.9%Electricity
- 40.9%Utility gas
- 3.2%Solar energy
- 1.4%Bottled, tank, or LP gas
- 0.3%Other fuel
- 0.2%No fuel used
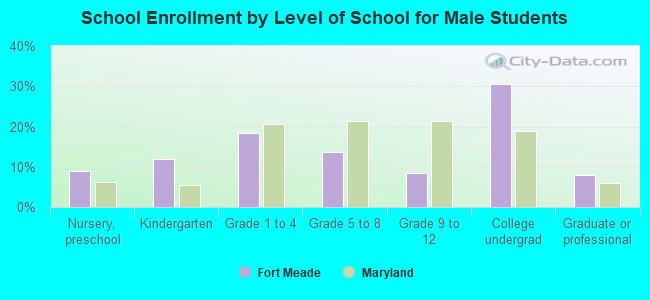
Private vs. public school enrollment:
| Here: | 21.3% |
| Maryland: | 15.2% |
| Here: | 11.1% |
| Maryland: | 14.4% |
| Here: | 10.0% |
| Maryland: | 20.2% |