Fort Drum, NY (New York) Houses and Residents
Total population: 12,955 (Urban population: 11,394 (all inside urban clusters), Rural population: 729 (all nonfarm) )
Houses: 4,858 (4,606 occupied: 128 owner occupied, 4,528 renter occupied )
% of renters here:
97%State:
46%
Housing density: 192 houses/condos per square mile
Median price asked for vacant for-sale houses and condos in 2022 in this county: $102,223.
Median contract rent in 2022: $1,528 (lower quartile is $1,238, upper quartile is $1,702)
Median rent asked for vacant for-rent units in 2022: $2,064
Median gross rent in Fort Drum, NY in 2022: $1,454
Housing units in Fort Drum with a mortgage: 0 (0 second mortgage, 0 home equity loan, 0 both second mortgage and home equity loan )Houses without a mortgage: 0
Median household income for apartments without a mortgage: $42,647
Median monthly housing costs: $1,436
Data:
Median house or condo value ($)
Median house or condo value ($ change since 2000)
Median house or condo value ($) - White
Median house or condo value ($) - Black or African American
Median house or condo value ($) - Asian
Median house or condo value ($) - Hispanic or Latino
Median house or condo value ($) - American Indian and Alaska Native
Median house or condo value ($) - Multirace
Median house or condo value ($) - Other Race
Median price asked for mobile homes ($)
Household density (households per square mile)
Mean house or condo value by units in structure - 1, detached ($)
Mean house or condo value by units in structure - 1, attached ($)
Mean house or condo value by units in structure - 2 ($)
Mean house or condo value by units in structure by units in structure - 3 or 4 ($)
Mean house or condo value by units in structure - 5 or more ($)
Mean house or condo value by units in structure - Boat, RV, van, etc. ($)
Mean house or condo value by units in structure - Mobile home ($)
Median contract rent ($)
Median contract rent - Lower quartile ($)
Median contract rent - Upper quartile ($)
Median gross rent ($)
Urban houses (%)
Rural houses (%)
Houses occupied (%)
Houses occupied (% change since 2000)
Houses owner occupied (%)
Houses owner occupied (% change since 2000)
Houses renter occupied (%)
Houses renter occupied (% change since 2000)
Vacant housing units - For rent (%)
Vacant housing units - For rent (% change since 2000)
Vacant housing units - For sale only (%)
Vacant housing units - For sale only (% change since 2000)
Vacant housing units - Rented or sold, not occupied (%)
Vacant housing units - Rented or sold, not occupied (% change since 2000)
Vacant housing units - For seasonal, recreational, or occasional use (%)
Vacant housing units - For seasonal, recreational, or occasional use (% change since 2000)
Vacant housing units - For migrant workers (%)
Vacant housing units - For migrant workers (% change since 2000)
Vacant housing units - Other vacant (%)
Vacant housing units - Other vacant (% change since 2000)
Median monthly housing costs ($)
Median household income for houses/condos with a mortgage ($)
Median household income for houses/condos without a mortgage ($)
Median household income ($)
Median household income ($) - White
Median household income ($) - Black or African American
Median household income ($) - Asian
Median household income ($) - Hispanic or Latino
Median household income ($) - American Indian and Alaska Native
Median household income ($) - Multirace
Median household income ($) - Other Race
Mortgage status - with mortgage (%)
Mortgage status - with second mortgage (%)
Mortgage status - with home equity loan (%)
Mortgage status - with both second mortgage and home equity loan (%)
Mortgage status - without a mortgage (%)
Median year house/condo built
Median year apartment built
Household type by relationship - Male householder living alone (%)
Household type by relationship - Male householder not living alone (%)
Household type by relationship - Female householder living alone (%)
Household type by relationship - Female householder not living alone (%)
Household type by relationship - Opposite-Sex spouse (%)
Household type by relationship - Same-Sex spouse (%)
Household type by relationship - Opposite-Sex unmarried partner (%)
Household type by relationship - Same-Sex unmarried partner (%)
Household type by relationship - In group quarters (%)
Size of family households - 2-person household (%)
Size of family households - 3-person household (%)
Size of family households - 4-person household (%)
Size of family households - 5-person household (%)
Size of family households - 6-person household (%)
Size of family households - 7-or-more-person household (%)
Size of nonfamily households - 1-person household (%)
Size of nonfamily households - 2-person household (%)
Size of nonfamily households - 3-person household (%)
Size of nonfamily households - 4-person household (%)
Size of nonfamily households - 5-person household (%)
Size of nonfamily households - 6-person household (%)
Size of nonfamily households - 7-or-moreperson household (%)
Year house built - Built 2010 or later (%)
Year house built - Built 2000 to 2009 (%)
Year house built - Built 1990 to 1999 (%)
Year house built - Built 1980 to 1989 (%)
Year house built - Built 1970 to 1979 (%)
Year house built - Built 1960 to 1969 (%)
Year house built - Built 1950 to 1959 (%)
Year house built - Built 1940 to 1949 (%)
Year house built - Built 1939 or earlier (%)
Median number of rooms in houses and condos
Median number of rooms in apartments
Median number of bedrooms in owner occupied houses
Mean number of bedrooms in owner occupied houses
Median number of bedrooms in renter occupied houses
Mean number of bedrooms in renter occupied houses
Median number of vehichles in owner occupied houses
Mean number of vehichles in owner occupied houses
Median number of vehichles in renter occupied houses
Mean number of vehichles in renter occupied houses
Rooms in owner-occupied houses - 1 room (%)
Rooms in owner-occupied houses - 2 rooms (%)
Rooms in owner-occupied houses - 3 rooms (%)
Rooms in owner-occupied houses - 4 rooms (%)
Rooms in owner-occupied houses - 5 rooms (%)
Rooms in owner-occupied houses - 6 rooms (%)
Rooms in owner-occupied houses - 7 rooms (%)
Rooms in owner-occupied houses - 8 rooms (%)
Rooms in owner-occupied houses - 9+ rooms (%)
Rooms in renter-occupied houses - 1 room (%)
Rooms in renter-occupied houses - 2 rooms (%)
Rooms in renter-occupied houses - 3 rooms (%)
Rooms in renter-occupied houses - 4 rooms (%)
Rooms in renter-occupied houses - 5 rooms (%)
Rooms in renter-occupied houses - 6 rooms (%)
Rooms in renter-occupied houses - 7 rooms (%)
Rooms in renter-occupied houses - 8 rooms (%)
Rooms in renter-occupied houses - 9+ rooms (%)
Bedrooms in owner-occupied houses - no bedrooms (%)
Bedrooms in owner-occupied houses - 1 bedroom (%)
Bedrooms in owner-occupied houses - 2 bedrooms (%)
Bedrooms in owner-occupied houses - 3 bedrooms (%)
Bedrooms in owner-occupied houses - 4 bedrooms (%)
Bedrooms in owner-occupied houses - 5+ bedrooms (%)
Bedrooms in renter-occupied houses - no bedrooms (%)
Bedrooms in renter-occupied houses - 1 bedroom (%)
Bedrooms in renter-occupied houses - 2 bedrooms (%)
Bedrooms in renter-occupied houses - 3 bedrooms (%)
Bedrooms in renter-occupied houses - 4 bedrooms (%)
Bedrooms in renter-occupied houses - 5+ bedrooms (%)
Vehicles available in owner-occupied houses - no vehicle available (%)
Vehicles available in owner-occupied houses - 1 vehicle available(%)
Vehicles available in owner-occupied houses - 2 Vehicles available (%)
Vehicles available in owner-occupied houses - 3 Vehicles available (%)
Vehicles available in owner-occupied houses - 4 Vehicles available (%)
Vehicles available in owner-occupied houses - 5+ Vehicles available (%)
Vehicles available in renter-occupied houses - no vehicle available (%)
Vehicles available in renter-occupied houses - 1 vehicle available (%)
Vehicles available in renter-occupied houses - 2 Vehicles available (%)
Vehicles available in renter-occupied houses - 3 Vehicles available (%)
Vehicles available in renter-occupied houses - 4 Vehicles available (%)
Vehicles available in renter-occupied houses - 5+ Vehicles available (%)
Housing units in structures - 1, detached (%)
Housing units in structures - 1, attached (%)
Housing units in structures - 2 (%)
Housing units in structures - 3 or 4 (%)
Housing units in structures - 5 to 9 (%)
Housing units in structures - 10 to 19 (%)
Housing units in structures - 20 to 49 (%)
Housing units in structures - 50 or more (%)
Housing units in structures - Mobile home (%)
Housing units in structures - Boat, RV, van, etc. (%)
Housing units in structures - Owners - 1, detached (%)
Housing units in structures - Owners - 1, attached (%)
Housing units in structures - Owners - 2 (%)
Housing units in structures - Owners - 3 or 4 (%)
Housing units in structures - Owners - 5 to 9 (%)
Housing units in structures - Owners - 10 to 19 (%)
Housing units in structures - Owners - 20 to 49 (%)
Housing units in structures - Owners - 50 or more (%)
Housing units in structures - Owners - Mobile home (%)
Housing units in structures - Owners - Boat, RV, van, etc. (%)
Housing units in structures - Renters - 1, detached (%)
Housing units in structures - Renters - 1, attached (%)
Housing units in structures - Renters - 2 (%)
Housing units in structures - Renters - 3 or 4 (%)
Housing units in structures - Renters - 5 to 9 (%)
Housing units in structures - Renters - 10 to 19 (%)
Housing units in structures - Renters - 20 to 49 (%)
Housing units in structures - Renters - 50 or more (%)
Housing units in structures - Renters - Mobile home (%)
Housing units in structures - Renters - Boat, RV, van, etc. (%)
House/condo owner moved in on average (years ago)
Renter moved in on average (years ago)
Year householder moved into unit - Moved in 1999 to March 2000 (%)
Year householder moved into unit - Moved in 1999 to March 2000 (%) - White
Year householder moved into unit - Moved in 1999 to March 2000 (%) - Black or African American
Year householder moved into unit - Moved in 1999 to March 2000 (%) - Asian
Year householder moved into unit - Moved in 1999 to March 2000 (%) - Hispanic or Latino
Year householder moved into unit - Moved in 1999 to March 2000 (%) - American Indian and Alaska Native
Year householder moved into unit - Moved in 1999 to March 2000 (%) - Multirace
Year householder moved into unit - Moved in 1999 to March 2000 (%) - Other Race
Year householder moved into unit - Moved in 1995 to 1998 (%)
Year householder moved into unit - Moved in 1995 to 1998 (%) - White
Year householder moved into unit - Moved in 1995 to 1998 (%) - Black or African American
Year householder moved into unit - Moved in 1995 to 1998 (%) - Asian
Year householder moved into unit - Moved in 1995 to 1998 (%) - Hispanic or Latino
Year householder moved into unit - Moved in 1995 to 1998 (%) - American Indian and Alaska Native
Year householder moved into unit - Moved in 1995 to 1998 (%) - Multirace
Year householder moved into unit - Moved in 1995 to 1998 (%) - Other Race
Year householder moved into unit - Moved in 1990 to 1994 (%)
Year householder moved into unit - Moved in 1990 to 1994 (%) - White
Year householder moved into unit - Moved in 1990 to 1994 (%) - Black or African American
Year householder moved into unit - Moved in 1990 to 1994 (%) - Asian
Year householder moved into unit - Moved in 1990 to 1994 (%) - Hispanic or Latino
Year householder moved into unit - Moved in 1990 to 1994 (%) - American Indian and Alaska Native
Year householder moved into unit - Moved in 1990 to 1994 (%) - Multirace
Year householder moved into unit - Moved in 1990 to 1994 (%) - Other Race
Year householder moved into unit - Moved in 1980 to 1989 (%)
Year householder moved into unit - Moved in 1980 to 1989 (%) - White
Year householder moved into unit - Moved in 1980 to 1989 (%) - Black or African American
Year householder moved into unit - Moved in 1980 to 1989 (%) - Asian
Year householder moved into unit - Moved in 1980 to 1989 (%) - Hispanic or Latino
Year householder moved into unit - Moved in 1980 to 1989 (%) - American Indian and Alaska Native
Year householder moved into unit - Moved in 1980 to 1989 (%) - Multirace
Year householder moved into unit - Moved in 1980 to 1989 (%) - Other Race
Year householder moved into unit - Moved in 1970 to 1979 (%)
Year householder moved into unit - Moved in 1970 to 1979 (%) - White
Year householder moved into unit - Moved in 1970 to 1979 (%) - Black or African American
Year householder moved into unit - Moved in 1970 to 1979 (%) - Asian
Year householder moved into unit - Moved in 1970 to 1979 (%) - Hispanic or Latino
Year householder moved into unit - Moved in 1970 to 1979 (%) - American Indian and Alaska Native
Year householder moved into unit - Moved in 1970 to 1979 (%) - Multirace
Year householder moved into unit - Moved in 1970 to 1979 (%) - Other Race
Year householder moved into unit - Moved in 1969 or earlier (%)
Year householder moved into unit - Moved in 1969 or earlier (%) - White
Year householder moved into unit - Moved in 1969 or earlier (%) - Black or African American
Year householder moved into unit - Moved in 1969 or earlier (%) - Asian
Year householder moved into unit - Moved in 1969 or earlier (%) - Hispanic or Latino
Year householder moved into unit - Moved in 1969 or earlier (%) - American Indian and Alaska Native
Year householder moved into unit - Moved in 1969 or earlier (%) - Multirace
Year householder moved into unit - Moved in 1969 or earlier (%) - Other Race
Housing units lacking complete plumbing facilities (%)
Housing units lacking complete kitchen facilities (%)
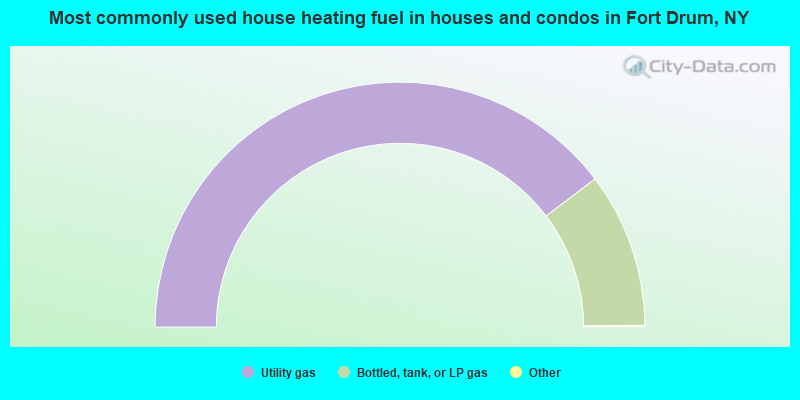
House heating fuel used in houses and condos - Utility gas (%)
House heating fuel used in houses and condos - Bottled, tank, or LP gas (%)
House heating fuel used in houses and condos - Electricity (%)
House heating fuel used in houses and condos - Fuel oil, kerosene, etc. (%)
House heating fuel used in houses and condos - Coal or coke (%)
House heating fuel used in houses and condos - Wood (%)
House heating fuel used in houses and condos - Solar energy (%)
House heating fuel used in houses and condos - Other fuel (%)
House heating fuel used in houses and condos - No fuel used (%)
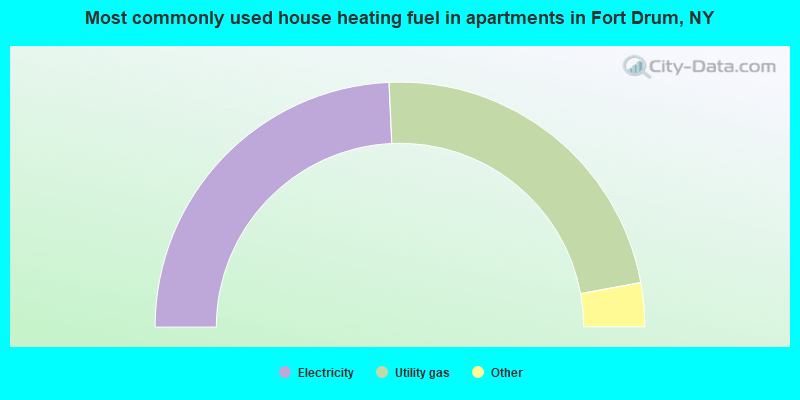
House heating fuel used in apartments - Utility gas (%)
House heating fuel used in apartments - Bottled, tank, or LP gas (%)
House heating fuel used in apartments - Electricity (%)
House heating fuel used in apartments - Fuel oil, kerosene, etc. (%)
House heating fuel used in apartments - Coal or coke (%)
House heating fuel used in apartments - Wood (%)
House heating fuel used in apartments - Solar energy (%)
House heating fuel used in apartments - Other fuel (%)
House heating fuel used in apartments - No fuel used (%)
Median year house/condo built: 2006Median year apartment built: 1997Household type by relationship:
Households: 16,185
Male householders: 3,727 (478 living alone ), Female householders: 827 (182 living alone )3,385 spouses (3,330 opposite-sex spouses ), 33 unmarried partners , (33 opposite-sex unmarried partners ), 5,475 children (5,139 natural , 24 adopted , 310 stepchildren ), 134 grandchildren , 24 brothers or sisters , 38 parents , 0 foster children , 29 other relatives , 163 non-relatives In group quarters: 2,345
Size of family households: 1,258 2-persons , 817 3-persons , 982 4-persons , 556 5-persons , 129 6-persons , 173 7-or-more-persons .
Size of nonfamily households: 744 1-person , 59 2-persons .
4,984 married couples with children. single-parent households (46 men , 279 women ).
76.2% of residents of Fort Drum speak English at home. of residents speak Spanish at home (66% speak English very well , 30% speak English well , 2% speak English not well , 3% don't speak English at all ).of residents speak other Indo-European language at home (57% speak English very well , 40% speak English well , 3% speak English not well ).of residents speak Asian or Pacific Island language at home (71% speak English very well , 29% speak English well ).of residents speak other language at home (90% speak English very well , 10% speak English well ).
Foreign born population: 1,645 (10.2%)of them are naturalized citizens )
Median number of rooms in houses and condos: Here:
-656862744.4State:
6.3
Median number of rooms in apartments
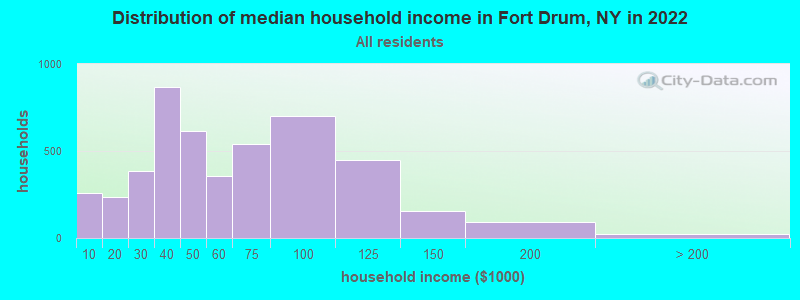
Fort Drum, NY household income distribution 256 Less than $10,000238 $10,000 to $19,999387 $20,000 to $29,999867 $30,000 to $39,999614 $40,000 to $49,999357 $50,000 to $59,999540 $60,000 to $74,999704 $75,000 to $99,999447 $100,000 to $124,999153 $125,000 to $149,99993 $150,000 to $199,99921 $200,000 or more
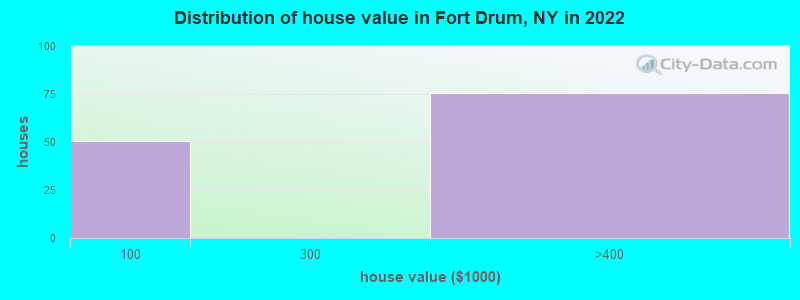
Home value of owner - occupied houses in 2022 in Fort Drum, NY 26 $70,000 to $79,99923 $80,000 to $89,99975 $300,000 to $399,999Rent paid by renters in 2022 in Fort Drum, NY 28 $400 to $44933 $550 to $59916 $750 to $79910 $900 to $9991,346 $1,000 to $1,249842 $1,250 to $1,4991,941 $1,500 to $1,999255 $2,000 to $2,49916 $2,500 to $2,99912 $3,500 or more
Percentage of workers working in this county: 97.7%Number of people working at home: 1,394 (16.8% of all workers )
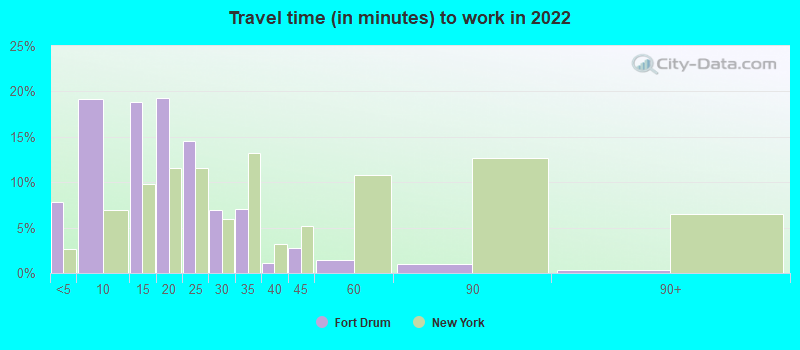
Travel time to work (commute)
Less than 5 minutes: 8785 to 9 minutes: 2,41710 to 14 minutes: 1,75115 to 19 minutes: 1,13120 to 24 minutes: 63725 to 29 minutes: 10130 to 34 minutes: 6835 to 39 minutes: 340 to 44 minutes: 13945 to 59 minutes: 6160 to 89 minutes: 4890 or more minutes: 0
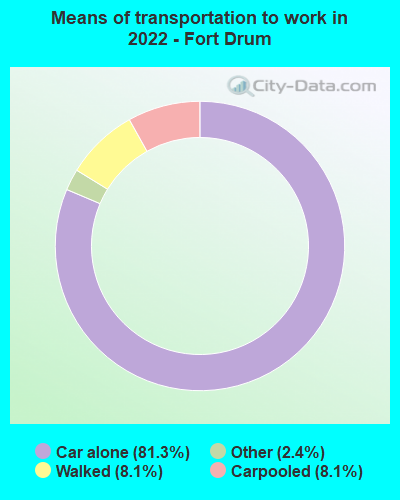
Means of transportation to work:
Drove a car alone: 11,195 (73.3%)Carpooled: 1,187 (7.8%)Taxi: 411 (2.7%)Walked: 1,135 (7.4%)Worked at home: 1,394 (9.1%)
Unemployment by race in 2022
Unemployment rate for White non-Hispanic residents 21.6% FemalesUnemployment rate for Black residents 12.1% Males6.3% FemalesUnemployment rate for two or more race residents 6.9% MalesUnemployment rate for Hispanic or Latino residents 3.9% Males10.0% Females
Year of entry for the foreign-born population in Fort Drum, New York
857 2010 or later 300 2000 to 2009 131 1990 to 1999 440 1980 to 1989 81 1970 to 1979 22 Before 1970
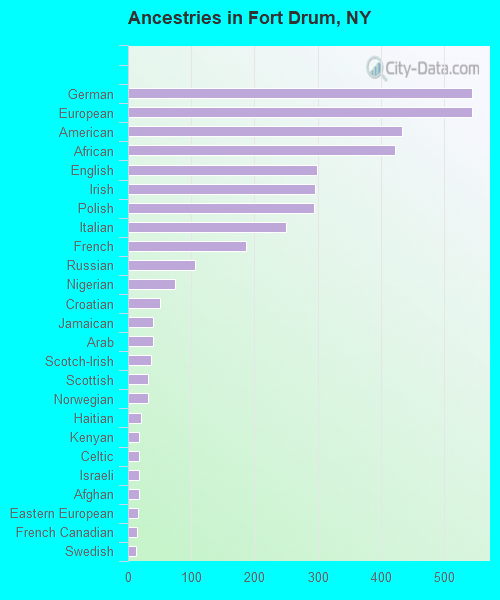
First ancestries reported:
German: 544 (7.5%)
European: 544 (7.5%)
American: 434 (6.0%)
African: 422 (5.8%)
English: 299 (4.1%)
Irish: 296 (4.1%)
Polish: 294 (4.1%)
Italian: 250 (3.4%)
French: 186 (2.6%)
Russian: 106 (1.5%)
Nigerian: 75 (1.0%)
Croatian: 51 (0.7%)
Jamaican: 40 (0.6%)
Arab: 39 (0.5%)
Scotch-Irish: 37 (0.5%)
Scottish: 32 (0.4%)
Norwegian: 31 (0.4%)
Haitian: 20 (0.3%)
Kenyan: 18 (0.2%)
Celtic: 18 (0.2%)
Israeli: 17 (0.2%)
Afghan: 17 (0.2%)
Eastern European: 16 (0.2%)
French Canadian: 14 (0.2%)
Swedish: 13 (0.2%)
Syrian: 10 (0.1%)
British: 8 (0.1%)
Hungarian: 6 (0.08%)
Greek: 6 (0.08%)
Canadian: 5 (0.07%)
Ukrainian: 4 (0.06%)
Slovak: 3 (0.04%)
Portuguese: 2 (0.03%) Most common places of birth for foreign-born residents (%): Guyana Fort Drum:
11.0% (150)New York:
3.8% (172,129)
Mexico Fort Drum:
10.0% (136)New York:
4.8% (214,559)
Other Western Africa Fort Drum:
9.0% (122)New York:
0.4% (19,133)
Philippines Fort Drum:
8.6% (117)New York:
2.0% (91,070)
Korea Fort Drum:
6.8% (93)New York:
1.8% (82,786)
Russia Fort Drum:
5.7% (77)New York:
1.7% (75,802)
China, excluding Hong Kong and Taiwan Fort Drum:
4.3% (59)New York:
9.1% (410,910)
France Fort Drum:
4.2% (57)New York:
0.6% (25,782)
Honduras Fort Drum:
4.1% (55)New York:
1.2% (55,571)
Ecuador Fort Drum:
4.0% (54)New York:
3.9% (177,448)
Nepal Fort Drum:
3.5% (48)New York:
0.4% (17,363)
Panama Fort Drum:
3.2% (44)New York:
0.4% (18,218)
Dominican Republic Fort Drum:
2.8% (38)New York:
11.1% (501,040)
Other Middle Africa Fort Drum:
2.4% (33)New York:
0.0% (1,367)
Israel Fort Drum:
2.2% (30)New York:
0.7% (29,743)
Spain Fort Drum:
1.9% (26)New York:
0.3% (14,949)
Democratic Republic of Congo (Zaire) Fort Drum:
1.7% (23)New York:
0.1% (2,563)
Kazakhstan Fort Drum:
1.5% (21)New York:
0.1% (6,042)
Place of birth for U.S.-born residents:
This state: 2,371Other state: 11,056Northeast: 916Midwest: 1,411South: 5,474West: 3,406 62.5% of Fort Drum residents lived in the same house 1 years ago.
Out of people who lived in different houses, 14.3% lived in this county.
Out of people who lived in different counties, 6.9% lived in New York.
Fort Drum:
62.5%State average:
89.6%
Education attainment for males 25 years and older:
No schooling: 0Nursery to 4th grade: 05th and 6th grade: 07th and 8th grade: 09th grade: 010th grade: 011th grade: 012th grade, no diploma: 9High school graduate (or equivalency): 690Less than 1 year of college: 741Some college more than 1 year, no degree: 462Associate degree: 671Bachelor's degree: 812Master's degree: 141Professional school degree: 14Doctorate degree: 20
Education attainment for females 25 years and older:
No schooling: 63Nursery to 4th grade: 05th and 6th grade: 07th and 8th grade: 09th grade: 010th grade: 011th grade: 2312th grade, no diploma: 0High school graduate (or equivalency): 467Less than 1 year of college: 172Some college more than 1 year, no degree: 637Associate degree: 308Bachelor's degree: 962Master's degree: 87Professional school degree: 10Doctorate degree: 18
Housing units in structures:
One, detached: 612One, attached: 1,666Two: 3813 or 4: 1,7005 to 9: 10010 to 19: 11520 to 49: 15450 or more: 126Housing units lacking complete plumbing facilities in 2022: 0.9%Housing units lacking complete kitchen facilities in 2022: 0.4%Private vs. public school enrollment:
Students in private schools in grades 1 to 8 (elementary and middle school): 266 Students in private schools in grades 9 to 12 (high school): 0 Students in private undergraduate colleges: 505