Fort Dodge, IA (Iowa) Houses and Residents
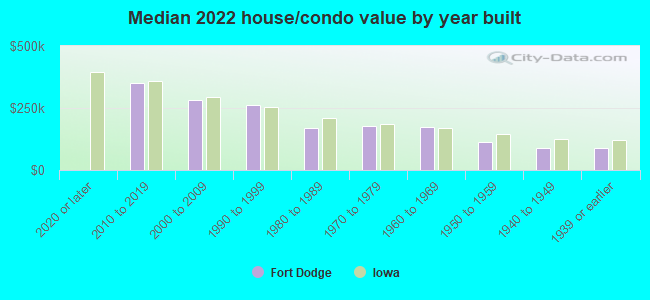
Estimated median house or condo value in 2022: $132,448 (it was $64,000 in 2000 )
Fort Dodge:
$132,448Iowa:
$194,600
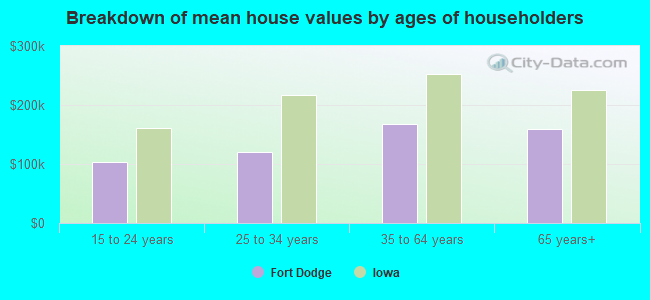
Lower value quartile - upper value quartile: $80,168 - $203,885Mean price in 2022: Detached houses: $163,210 Here:
$163,210State:
$245,224
Townhouses or other attached units: $217,813 Here:
$217,813State:
$238,767
In 2-unit structures: $177,145 Here:
$177,145State:
$243,070
In 5-or-more-unit structures: $371,232 Here:
$371,232State:
$190,519
Mobile homes: $35,880 Here:
$35,880State:
$51,271
Total population: 24,594 (Urban population: 23,955 (all inside urban clusters), Rural population: 1,170 (26 farm, 1,144 nonfarm ))
Houses: 11,467 (10,559 occupied: 6,788 owner occupied, 3,943 renter occupied )
% of renters here:
37%State:
28%
Housing density: 787 houses/condos per square mile
Median price asked for vacant for-sale houses and condos in 2022: $57,016.
Median contract rent in 2022: $607 (lower quartile is $501, upper quartile is $725)
Median rent asked for vacant for-rent units in 2022: $561
Median gross rent in Fort Dodge, IA in 2022: $730
Housing units in Fort Dodge with a mortgage: 3,631 (210 second mortgage, 0 home equity loan, 178 both second mortgage and home equity loan )Houses without a mortgage: 78
Median household income for houses/condos with a mortgage: $79,078
Median household income for apartments without a mortgage: $57,178
Median monthly housing costs: $764
Data:
Median house or condo value ($)
Median house or condo value ($ change since 2000)
Median house or condo value ($) - White
Median house or condo value ($) - Black or African American
Median house or condo value ($) - Asian
Median house or condo value ($) - Hispanic or Latino
Median house or condo value ($) - American Indian and Alaska Native
Median house or condo value ($) - Multirace
Median house or condo value ($) - Other Race
Median price asked for mobile homes ($)
Household density (households per square mile)
Mean house or condo value by units in structure - 1, detached ($)
Mean house or condo value by units in structure - 1, attached ($)
Mean house or condo value by units in structure - 2 ($)
Mean house or condo value by units in structure by units in structure - 3 or 4 ($)
Mean house or condo value by units in structure - 5 or more ($)
Mean house or condo value by units in structure - Boat, RV, van, etc. ($)
Mean house or condo value by units in structure - Mobile home ($)
Median contract rent ($)
Median contract rent - Lower quartile ($)
Median contract rent - Upper quartile ($)
Median gross rent ($)
Urban houses (%)
Rural houses (%)
Houses occupied (%)
Houses occupied (% change since 2000)
Houses owner occupied (%)
Houses owner occupied (% change since 2000)
Houses renter occupied (%)
Houses renter occupied (% change since 2000)
Vacant housing units - For rent (%)
Vacant housing units - For rent (% change since 2000)
Vacant housing units - For sale only (%)
Vacant housing units - For sale only (% change since 2000)
Vacant housing units - Rented or sold, not occupied (%)
Vacant housing units - Rented or sold, not occupied (% change since 2000)
Vacant housing units - For seasonal, recreational, or occasional use (%)
Vacant housing units - For seasonal, recreational, or occasional use (% change since 2000)
Vacant housing units - For migrant workers (%)
Vacant housing units - For migrant workers (% change since 2000)
Vacant housing units - Other vacant (%)
Vacant housing units - Other vacant (% change since 2000)
Median monthly housing costs ($)
Median household income for houses/condos with a mortgage ($)
Median household income for houses/condos without a mortgage ($)
Median household income ($)
Median household income ($) - White
Median household income ($) - Black or African American
Median household income ($) - Asian
Median household income ($) - Hispanic or Latino
Median household income ($) - American Indian and Alaska Native
Median household income ($) - Multirace
Median household income ($) - Other Race
Mortgage status - with mortgage (%)
Mortgage status - with second mortgage (%)
Mortgage status - with home equity loan (%)
Mortgage status - with both second mortgage and home equity loan (%)
Mortgage status - without a mortgage (%)
Median year house/condo built
Median year apartment built
Household type by relationship - Male householder living alone (%)
Household type by relationship - Male householder not living alone (%)
Household type by relationship - Female householder living alone (%)
Household type by relationship - Female householder not living alone (%)
Household type by relationship - Opposite-Sex spouse (%)
Household type by relationship - Same-Sex spouse (%)
Household type by relationship - Opposite-Sex unmarried partner (%)
Household type by relationship - Same-Sex unmarried partner (%)
Household type by relationship - In group quarters (%)
Size of family households - 2-person household (%)
Size of family households - 3-person household (%)
Size of family households - 4-person household (%)
Size of family households - 5-person household (%)
Size of family households - 6-person household (%)
Size of family households - 7-or-more-person household (%)
Size of nonfamily households - 1-person household (%)
Size of nonfamily households - 2-person household (%)
Size of nonfamily households - 3-person household (%)
Size of nonfamily households - 4-person household (%)
Size of nonfamily households - 5-person household (%)
Size of nonfamily households - 6-person household (%)
Size of nonfamily households - 7-or-moreperson household (%)
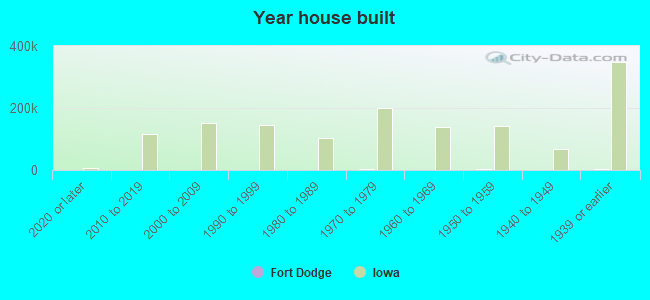
Year house built - Built 2010 or later (%)
Year house built - Built 2000 to 2009 (%)
Year house built - Built 1990 to 1999 (%)
Year house built - Built 1980 to 1989 (%)
Year house built - Built 1970 to 1979 (%)
Year house built - Built 1960 to 1969 (%)
Year house built - Built 1950 to 1959 (%)
Year house built - Built 1940 to 1949 (%)
Year house built - Built 1939 or earlier (%)
Median number of rooms in houses and condos
Median number of rooms in apartments
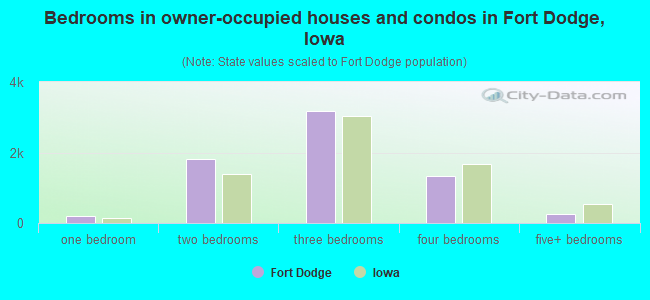
Median number of bedrooms in owner occupied houses
Mean number of bedrooms in owner occupied houses
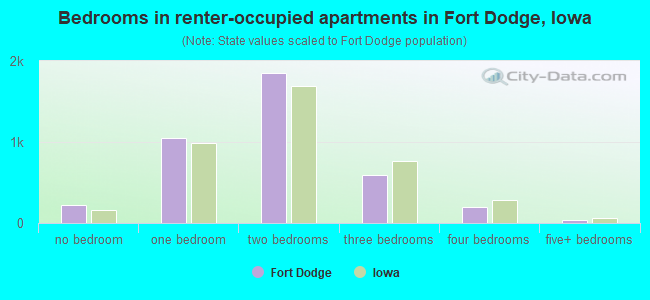
Median number of bedrooms in renter occupied houses
Mean number of bedrooms in renter occupied houses
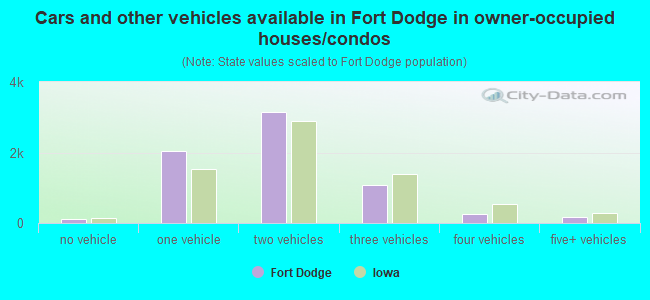
Median number of vehichles in owner occupied houses
Mean number of vehichles in owner occupied houses
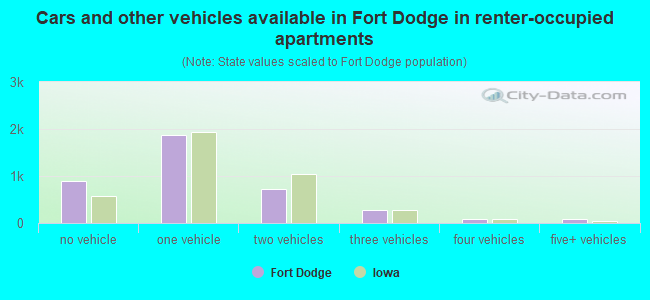
Median number of vehichles in renter occupied houses
Mean number of vehichles in renter occupied houses
Rooms in owner-occupied houses - 1 room (%)
Rooms in owner-occupied houses - 2 rooms (%)
Rooms in owner-occupied houses - 3 rooms (%)
Rooms in owner-occupied houses - 4 rooms (%)
Rooms in owner-occupied houses - 5 rooms (%)
Rooms in owner-occupied houses - 6 rooms (%)
Rooms in owner-occupied houses - 7 rooms (%)
Rooms in owner-occupied houses - 8 rooms (%)
Rooms in owner-occupied houses - 9+ rooms (%)
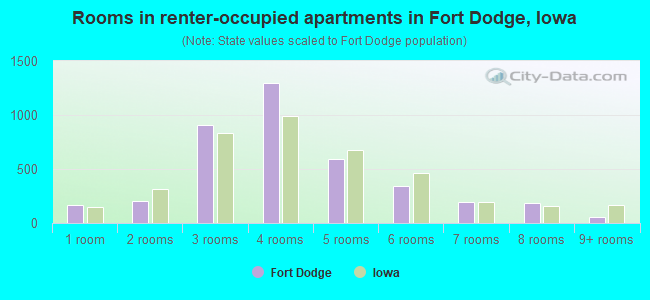
Rooms in renter-occupied houses - 1 room (%)
Rooms in renter-occupied houses - 2 rooms (%)
Rooms in renter-occupied houses - 3 rooms (%)
Rooms in renter-occupied houses - 4 rooms (%)
Rooms in renter-occupied houses - 5 rooms (%)
Rooms in renter-occupied houses - 6 rooms (%)
Rooms in renter-occupied houses - 7 rooms (%)
Rooms in renter-occupied houses - 8 rooms (%)
Rooms in renter-occupied houses - 9+ rooms (%)
Bedrooms in owner-occupied houses - no bedrooms (%)
Bedrooms in owner-occupied houses - 1 bedroom (%)
Bedrooms in owner-occupied houses - 2 bedrooms (%)
Bedrooms in owner-occupied houses - 3 bedrooms (%)
Bedrooms in owner-occupied houses - 4 bedrooms (%)
Bedrooms in owner-occupied houses - 5+ bedrooms (%)
Bedrooms in renter-occupied houses - no bedrooms (%)
Bedrooms in renter-occupied houses - 1 bedroom (%)
Bedrooms in renter-occupied houses - 2 bedrooms (%)
Bedrooms in renter-occupied houses - 3 bedrooms (%)
Bedrooms in renter-occupied houses - 4 bedrooms (%)
Bedrooms in renter-occupied houses - 5+ bedrooms (%)
Vehicles available in owner-occupied houses - no vehicle available (%)
Vehicles available in owner-occupied houses - 1 vehicle available(%)
Vehicles available in owner-occupied houses - 2 Vehicles available (%)
Vehicles available in owner-occupied houses - 3 Vehicles available (%)
Vehicles available in owner-occupied houses - 4 Vehicles available (%)
Vehicles available in owner-occupied houses - 5+ Vehicles available (%)
Vehicles available in renter-occupied houses - no vehicle available (%)
Vehicles available in renter-occupied houses - 1 vehicle available (%)
Vehicles available in renter-occupied houses - 2 Vehicles available (%)
Vehicles available in renter-occupied houses - 3 Vehicles available (%)
Vehicles available in renter-occupied houses - 4 Vehicles available (%)
Vehicles available in renter-occupied houses - 5+ Vehicles available (%)
Housing units in structures - 1, detached (%)
Housing units in structures - 1, attached (%)
Housing units in structures - 2 (%)
Housing units in structures - 3 or 4 (%)
Housing units in structures - 5 to 9 (%)
Housing units in structures - 10 to 19 (%)
Housing units in structures - 20 to 49 (%)
Housing units in structures - 50 or more (%)
Housing units in structures - Mobile home (%)
Housing units in structures - Boat, RV, van, etc. (%)
Housing units in structures - Owners - 1, detached (%)
Housing units in structures - Owners - 1, attached (%)
Housing units in structures - Owners - 2 (%)
Housing units in structures - Owners - 3 or 4 (%)
Housing units in structures - Owners - 5 to 9 (%)
Housing units in structures - Owners - 10 to 19 (%)
Housing units in structures - Owners - 20 to 49 (%)
Housing units in structures - Owners - 50 or more (%)
Housing units in structures - Owners - Mobile home (%)
Housing units in structures - Owners - Boat, RV, van, etc. (%)
Housing units in structures - Renters - 1, detached (%)
Housing units in structures - Renters - 1, attached (%)
Housing units in structures - Renters - 2 (%)
Housing units in structures - Renters - 3 or 4 (%)
Housing units in structures - Renters - 5 to 9 (%)
Housing units in structures - Renters - 10 to 19 (%)
Housing units in structures - Renters - 20 to 49 (%)
Housing units in structures - Renters - 50 or more (%)
Housing units in structures - Renters - Mobile home (%)
Housing units in structures - Renters - Boat, RV, van, etc. (%)
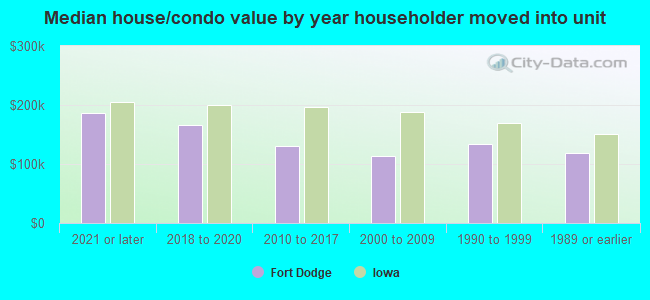
House/condo owner moved in on average (years ago)
Renter moved in on average (years ago)
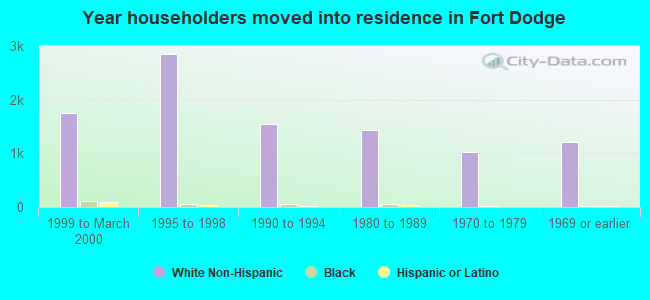
Year householder moved into unit - Moved in 1999 to March 2000 (%)
Year householder moved into unit - Moved in 1999 to March 2000 (%) - White
Year householder moved into unit - Moved in 1999 to March 2000 (%) - Black or African American
Year householder moved into unit - Moved in 1999 to March 2000 (%) - Asian
Year householder moved into unit - Moved in 1999 to March 2000 (%) - Hispanic or Latino
Year householder moved into unit - Moved in 1999 to March 2000 (%) - American Indian and Alaska Native
Year householder moved into unit - Moved in 1999 to March 2000 (%) - Multirace
Year householder moved into unit - Moved in 1999 to March 2000 (%) - Other Race
Year householder moved into unit - Moved in 1995 to 1998 (%)
Year householder moved into unit - Moved in 1995 to 1998 (%) - White
Year householder moved into unit - Moved in 1995 to 1998 (%) - Black or African American
Year householder moved into unit - Moved in 1995 to 1998 (%) - Asian
Year householder moved into unit - Moved in 1995 to 1998 (%) - Hispanic or Latino
Year householder moved into unit - Moved in 1995 to 1998 (%) - American Indian and Alaska Native
Year householder moved into unit - Moved in 1995 to 1998 (%) - Multirace
Year householder moved into unit - Moved in 1995 to 1998 (%) - Other Race
Year householder moved into unit - Moved in 1990 to 1994 (%)
Year householder moved into unit - Moved in 1990 to 1994 (%) - White
Year householder moved into unit - Moved in 1990 to 1994 (%) - Black or African American
Year householder moved into unit - Moved in 1990 to 1994 (%) - Asian
Year householder moved into unit - Moved in 1990 to 1994 (%) - Hispanic or Latino
Year householder moved into unit - Moved in 1990 to 1994 (%) - American Indian and Alaska Native
Year householder moved into unit - Moved in 1990 to 1994 (%) - Multirace
Year householder moved into unit - Moved in 1990 to 1994 (%) - Other Race
Year householder moved into unit - Moved in 1980 to 1989 (%)
Year householder moved into unit - Moved in 1980 to 1989 (%) - White
Year householder moved into unit - Moved in 1980 to 1989 (%) - Black or African American
Year householder moved into unit - Moved in 1980 to 1989 (%) - Asian
Year householder moved into unit - Moved in 1980 to 1989 (%) - Hispanic or Latino
Year householder moved into unit - Moved in 1980 to 1989 (%) - American Indian and Alaska Native
Year householder moved into unit - Moved in 1980 to 1989 (%) - Multirace
Year householder moved into unit - Moved in 1980 to 1989 (%) - Other Race
Year householder moved into unit - Moved in 1970 to 1979 (%)
Year householder moved into unit - Moved in 1970 to 1979 (%) - White
Year householder moved into unit - Moved in 1970 to 1979 (%) - Black or African American
Year householder moved into unit - Moved in 1970 to 1979 (%) - Asian
Year householder moved into unit - Moved in 1970 to 1979 (%) - Hispanic or Latino
Year householder moved into unit - Moved in 1970 to 1979 (%) - American Indian and Alaska Native
Year householder moved into unit - Moved in 1970 to 1979 (%) - Multirace
Year householder moved into unit - Moved in 1970 to 1979 (%) - Other Race
Year householder moved into unit - Moved in 1969 or earlier (%)
Year householder moved into unit - Moved in 1969 or earlier (%) - White
Year householder moved into unit - Moved in 1969 or earlier (%) - Black or African American
Year householder moved into unit - Moved in 1969 or earlier (%) - Asian
Year householder moved into unit - Moved in 1969 or earlier (%) - Hispanic or Latino
Year householder moved into unit - Moved in 1969 or earlier (%) - American Indian and Alaska Native
Year householder moved into unit - Moved in 1969 or earlier (%) - Multirace
Year householder moved into unit - Moved in 1969 or earlier (%) - Other Race
Housing units lacking complete plumbing facilities (%)
Housing units lacking complete kitchen facilities (%)
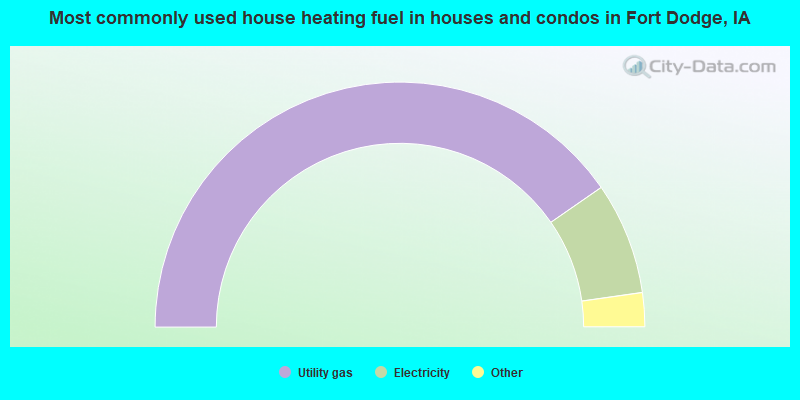
House heating fuel used in houses and condos - Utility gas (%)
House heating fuel used in houses and condos - Bottled, tank, or LP gas (%)
House heating fuel used in houses and condos - Electricity (%)
House heating fuel used in houses and condos - Fuel oil, kerosene, etc. (%)
House heating fuel used in houses and condos - Coal or coke (%)
House heating fuel used in houses and condos - Wood (%)
House heating fuel used in houses and condos - Solar energy (%)
House heating fuel used in houses and condos - Other fuel (%)
House heating fuel used in houses and condos - No fuel used (%)
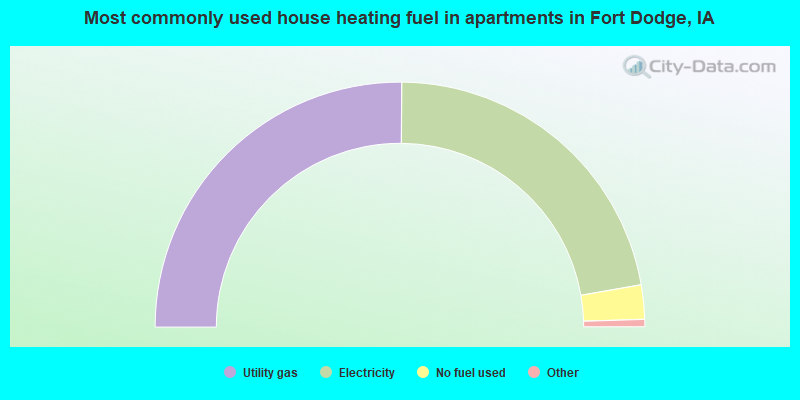
House heating fuel used in apartments - Utility gas (%)
House heating fuel used in apartments - Bottled, tank, or LP gas (%)
House heating fuel used in apartments - Electricity (%)
House heating fuel used in apartments - Fuel oil, kerosene, etc. (%)
House heating fuel used in apartments - Coal or coke (%)
House heating fuel used in apartments - Wood (%)
House heating fuel used in apartments - Solar energy (%)
House heating fuel used in apartments - Other fuel (%)
House heating fuel used in apartments - No fuel used (%)
Median year house/condo built: 1955Median year apartment built: 1962Household type by relationship:
Households: 24,941
Male householders: 5,057 (1,953 living alone ), Female householders: 5,382 (2,381 living alone )3,600 spouses (3,589 opposite-sex spouses ), 1,042 unmarried partners , (1,033 opposite-sex unmarried partners ), 5,834 children (5,395 natural , 181 adopted , 256 stepchildren ), 255 grandchildren , 159 brothers or sisters , 192 parents , 0 foster children , 56 other relatives , 637 non-relatives In group quarters: 2,721
Size of family households: 2,562 2-persons , 1,242 3-persons , 788 4-persons , 431 5-persons , 223 6-persons , 80 7-or-more-persons .
Size of nonfamily households: 4,507 1-person , 780 2-persons , 57 3-persons , 84 4-persons .
2,697 married couples with children. single-parent households (736 men , 1,133 women ).
93.8% of residents of Fort Dodge speak English at home. of residents speak Spanish at home (86% speak English very well , 6% speak English well , 8% speak English not well ).of residents speak other Indo-European language at home (30% speak English very well , 27% speak English well , 43% don't speak English at all ).of residents speak Asian or Pacific Island language at home (42% speak English very well , 21% speak English well , 29% speak English not well , 8% don't speak English at all ).of residents speak other language at home (32% speak English very well , 10% speak English well , 19% speak English not well , 38% don't speak English at all ).
Foreign born population: 926 (3.7%)of them are naturalized citizens )
Median number of rooms in houses and condos:
Median number of rooms in apartments
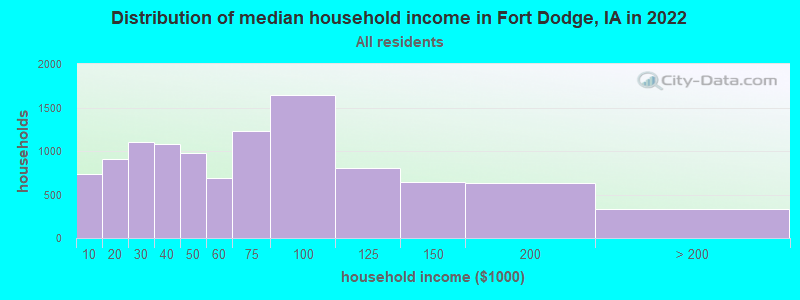
Fort Dodge, IA household income distribution 730 Less than $10,000903 $10,000 to $19,9991,102 $20,000 to $29,9991,083 $30,000 to $39,999978 $40,000 to $49,999685 $50,000 to $59,9991,225 $60,000 to $74,9991,647 $75,000 to $99,999807 $100,000 to $124,999640 $125,000 to $149,999628 $150,000 to $199,999332 $200,000 or more
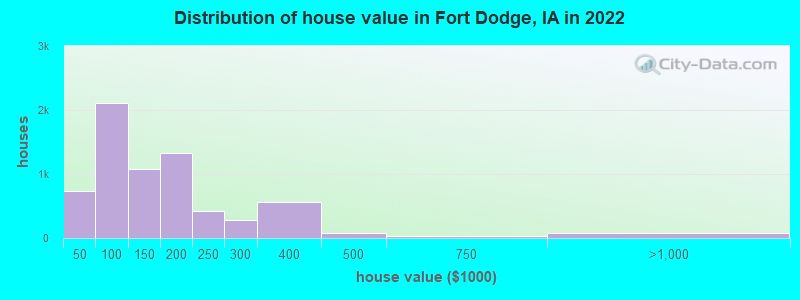
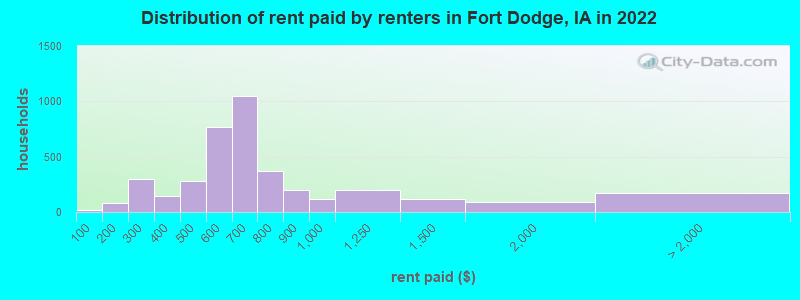
Home value of owner - occupied houses in 2022 in Fort Dodge, IA 177 Less than $10,00024 $10,000 to $14,99917 $15,000 to $19,99967 $20,000 to $24,99920 $25,000 to $29,999129 $30,000 to $34,999112 $35,000 to $39,999188 $40,000 to $49,999280 $50,000 to $59,999333 $60,000 to $69,999538 $70,000 to $79,999448 $80,000 to $89,999320 $90,000 to $99,999504 $100,000 to $124,999576 $125,000 to $149,999698 $150,000 to $174,999636 $175,000 to $199,999415 $200,000 to $249,999275 $250,000 to $299,999557 $300,000 to $399,99985 $400,000 to $499,99929 $500,000 to $749,99954 $750,000 to $999,99912 $1,000,000 to $1,499,99914 $2,000,000 or moreRent paid by renters in 2022 in Fort Dodge, IA 13 Less than $10046 $100 to $14932 $150 to $19988 $200 to $249207 $250 to $29961 $300 to $34986 $350 to $399105 $400 to $449179 $450 to $499505 $500 to $549265 $550 to $599810 $600 to $649232 $650 to $699279 $700 to $74986 $750 to $799196 $800 to $899116 $900 to $999194 $1,000 to $1,249121 $1,250 to $1,49989 $1,500 to $1,9998 $3,000 to $3,499167 No cash rent
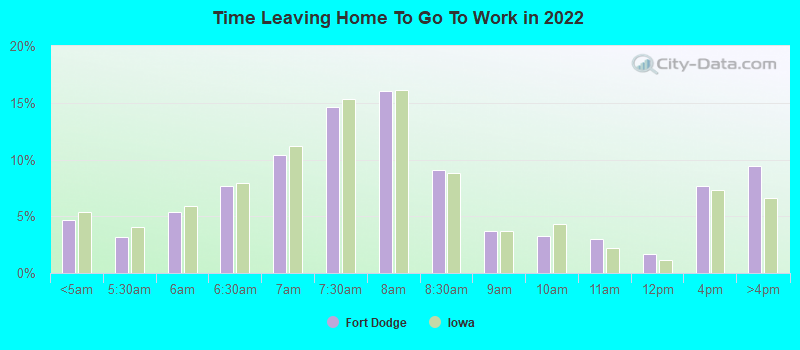
Percentage of workers working in this county: 89.9%Number of people working at home: 441 (3.8% of all workers )
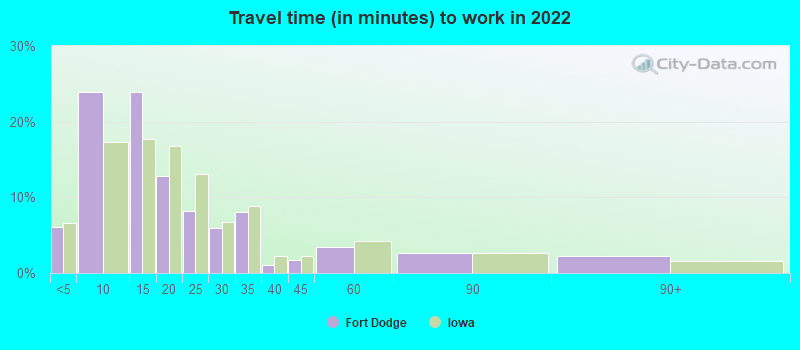
Travel time to work (commute)
Less than 5 minutes: 6905 to 9 minutes: 3,44510 to 14 minutes: 2,97115 to 19 minutes: 1,38120 to 24 minutes: 69025 to 29 minutes: 28230 to 34 minutes: 56335 to 39 minutes: 6140 to 44 minutes: 7845 to 59 minutes: 26860 to 89 minutes: 40890 or more minutes: 237
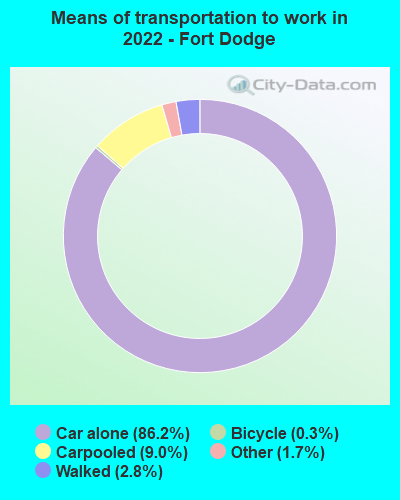
Means of transportation to work:
Drove a car alone: 11,904 (82.0%)Carpooled: 1,308 (9.0%)Ferryboat: 5 (0.0%)Taxi: 221 (1.5%)Bicycle: 47 (0.3%)Walked: 385 (2.7%)Worked at home: 441 (3.0%)
Unemployment by race in 2022
Unemployment rate for White non-Hispanic residents 2.9% Males1.6% FemalesUnemployment rate for Black residents 21.6% Males7.5% FemalesUnemployment rate for two or more race residents 6.0% Males0.3% FemalesUnemployment rate for Hispanic or Latino residents 2.1% Females
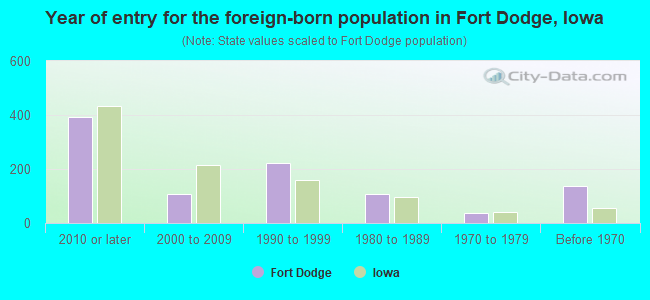
Year of entry for the foreign-born population in Fort Dodge, Iowa
394 2010 or later 106 2000 to 2009 221 1990 to 1999 108 1980 to 1989 37 1970 to 1979 137 Before 1970
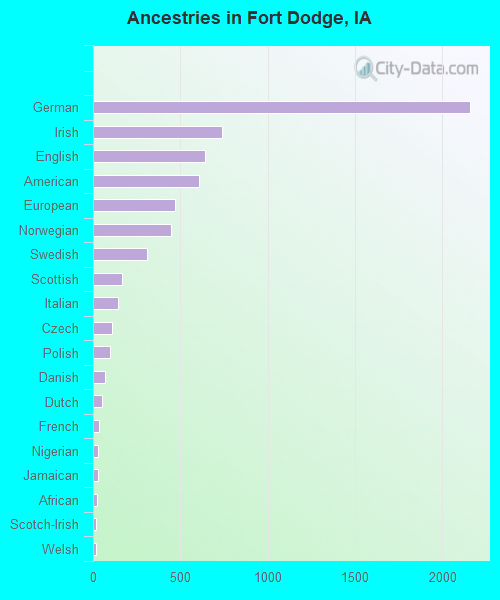
First ancestries reported:
German: 2,161 (23.0%)
Irish: 739 (7.9%)
English: 644 (6.8%)
American: 606 (6.4%)
European: 467 (5.0%)
Norwegian: 449 (4.8%)
Swedish: 309 (3.3%)
Scottish: 169 (1.8%)
Italian: 141 (1.5%)
Czech: 111 (1.2%)
Polish: 99 (1.1%)
Danish: 71 (0.8%)
Dutch: 49 (0.5%)
French: 35 (0.4%)
Nigerian: 31 (0.3%)
Jamaican: 30 (0.3%)
African: 25 (0.3%)
Scotch-Irish: 20 (0.2%)
Welsh: 20 (0.2%)
Lithuanian: 17 (0.2%)
Lebanese: 16 (0.2%)
Kenyan: 16 (0.2%)
British: 15 (0.2%)
Northern European: 12 (0.1%)
Canadian: 8 (0.08%)
Swiss: 7 (0.07%)
Russian: 5 (0.05%)
Scandinavian: 5 (0.05%)
West Indian: 4 (0.04%)
Somali: 3 (0.03%)
Australian: 2 (0.02%)
Hungarian: 2 (0.02%) Most common places of birth for foreign-born residents (%): Mexico Fort Dodge:
34.6% (306)Iowa:
23.3% (41,625)
China, excluding Hong Kong and Taiwan Fort Dodge:
12.7% (112)Iowa:
4.6% (8,194)
Philippines Fort Dodge:
10.5% (93)Iowa:
2.6% (4,675)
Other Northern America Fort Dodge:
10.2% (90)Iowa:
0.1% (117)
Korea Fort Dodge:
4.5% (40)Iowa:
2.9% (5,155)
Thailand Fort Dodge:
3.7% (33)Iowa:
2.0% (3,595)
Eritrea Fort Dodge:
3.5% (31)Iowa:
0.5% (898)
Australia Fort Dodge:
3.5% (31)Iowa:
0.2% (397)
Haiti Fort Dodge:
2.8% (25)Iowa:
0.4% (788)
Kenya Fort Dodge:
2.1% (19)Iowa:
0.7% (1,188)
Jamaica Fort Dodge:
1.7% (15)Iowa:
0.2% (303)
Place of birth for U.S.-born residents:
This state: 18,299Other state: 5,598Northeast: 425Midwest: 2,942South: 933West: 1,311 83.5% of Fort Dodge residents lived in the same house 1 years ago.
Out of people who lived in different houses, 28.3% lived in this county.
Out of people who lived in different counties, 66.4% lived in Iowa.
Fort Dodge:
83.5%State average:
87.2%
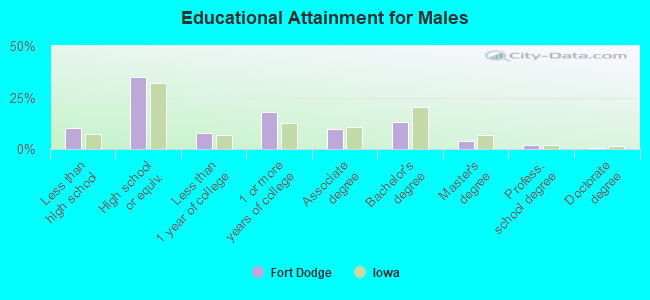
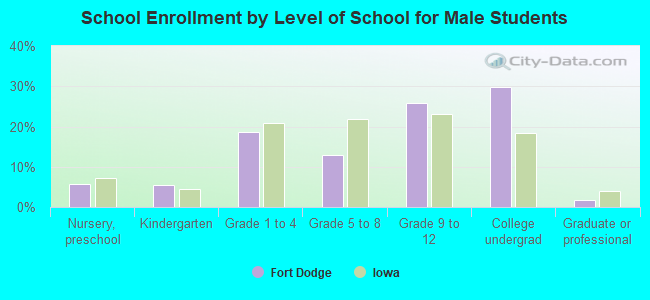
Education attainment for males 25 years and older:
No schooling: 121Nursery to 4th grade: 05th and 6th grade: 07th and 8th grade: 209th grade: 11110th grade: 11311th grade: 21612th grade, no diploma: 278High school graduate (or equivalency): 2,899Less than 1 year of college: 636Some college more than 1 year, no degree: 1,511Associate degree: 819Bachelor's degree: 1,097Master's degree: 318Professional school degree: 147Doctorate degree: 35
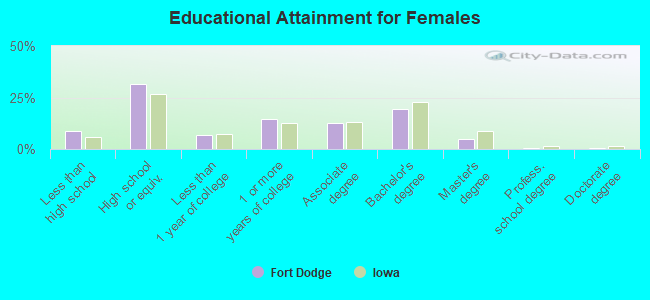
Education attainment for females 25 years and older:
No schooling: 92Nursery to 4th grade: 365th and 6th grade: 07th and 8th grade: 769th grade: 4210th grade: 4711th grade: 30112th grade, no diploma: 113High school graduate (or equivalency): 2,542Less than 1 year of college: 554Some college more than 1 year, no degree: 1,188Associate degree: 1,031Bachelor's degree: 1,588Master's degree: 382Professional school degree: 43Doctorate degree: 58
Housing units in structures:
One, detached: 8,125One, attached: 302Two: 6063 or 4: 5865 to 9: 22310 to 19: 37420 to 49: 53550 or more: 303Mobile homes: 330Boats, RVs, vans, etc.: 78Median worth of mobile homes: $11,901
Housing units lacking complete plumbing facilities in 2022: 4.2%Housing units lacking complete kitchen facilities in 2022: 2.1%House/condo owner moved in on average 13 years ago
Renter moved in on average 3 years ago
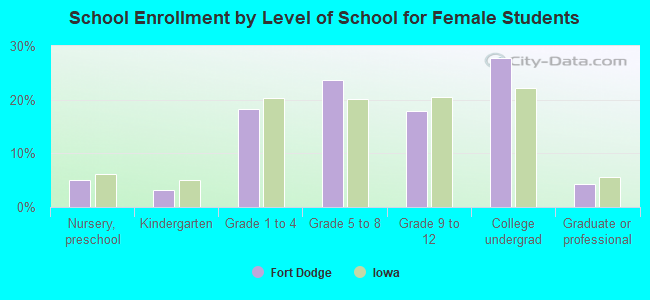
Private vs. public school enrollment:
Students in private schools in grades 1 to 8 (elementary and middle school): 135 Students in private schools in grades 9 to 12 (high school): 430 Students in private undergraduate colleges: 287