Floral Park, NY (New York) Houses and Residents
Estimated median house or condo value in 2022: $723,489 (it was $264,900 in 2000 )
Floral Park:
$723,489New York:
$400,400
Lower value quartile - upper value quartile: $561,127 - $894,247Mean price in 2022: Detached houses: $823,682 Here:
$823,682State:
$476,719
Townhouses or other attached units: $757,017 Here:
$757,017State:
$699,270
In 2-unit structures: $731,290 Here:
$731,290State:
$713,077
In 5-or-more-unit structures: $226,939 Here:
$226,939State:
$912,009
Total population: 15,967 (All urban)
Houses: 5,701 (5,524 occupied: 4,781 owner occupied, 733 renter occupied )
% of renters here:
13%State:
46%
Housing density: 4,155 houses/condos per square mile
Median price asked for vacant for-sale houses and condos in 2022: $17,176,868.
Median contract rent in 2022: $1,979 (lower quartile is $1,455, upper quartile is over $2,000)
Median rent asked for vacant for-rent units in 2022: $1,835
Median gross rent in Floral Park, NY in 2022: over $2,000
Housing units in Floral Park with a mortgage: 2,653 (246 second mortgage, 4 home equity loan, 233 both second mortgage and home equity loan )Houses without a mortgage: 234
Median household income for houses/condos with a mortgage: $209,878
Median household income for apartments without a mortgage: $118,279
Median monthly housing costs: $2,170
Data:
Median house or condo value ($)
Median house or condo value ($ change since 2000)
Median house or condo value ($) - White
Median house or condo value ($) - Black or African American
Median house or condo value ($) - Asian
Median house or condo value ($) - Hispanic or Latino
Median house or condo value ($) - American Indian and Alaska Native
Median house or condo value ($) - Multirace
Median house or condo value ($) - Other Race
Median price asked for mobile homes ($)
Household density (households per square mile)
Mean house or condo value by units in structure - 1, detached ($)
Mean house or condo value by units in structure - 1, attached ($)
Mean house or condo value by units in structure - 2 ($)
Mean house or condo value by units in structure by units in structure - 3 or 4 ($)
Mean house or condo value by units in structure - 5 or more ($)
Mean house or condo value by units in structure - Boat, RV, van, etc. ($)
Mean house or condo value by units in structure - Mobile home ($)
Median contract rent ($)
Median contract rent - Lower quartile ($)
Median contract rent - Upper quartile ($)
Median gross rent ($)
Urban houses (%)
Rural houses (%)
Houses occupied (%)
Houses occupied (% change since 2000)
Houses owner occupied (%)
Houses owner occupied (% change since 2000)
Houses renter occupied (%)
Houses renter occupied (% change since 2000)
Vacant housing units - For rent (%)
Vacant housing units - For rent (% change since 2000)
Vacant housing units - For sale only (%)
Vacant housing units - For sale only (% change since 2000)
Vacant housing units - Rented or sold, not occupied (%)
Vacant housing units - Rented or sold, not occupied (% change since 2000)
Vacant housing units - For seasonal, recreational, or occasional use (%)
Vacant housing units - For seasonal, recreational, or occasional use (% change since 2000)
Vacant housing units - For migrant workers (%)
Vacant housing units - For migrant workers (% change since 2000)
Vacant housing units - Other vacant (%)
Vacant housing units - Other vacant (% change since 2000)
Median monthly housing costs ($)
Median household income for houses/condos with a mortgage ($)
Median household income for houses/condos without a mortgage ($)
Median household income ($)
Median household income ($) - White
Median household income ($) - Black or African American
Median household income ($) - Asian
Median household income ($) - Hispanic or Latino
Median household income ($) - American Indian and Alaska Native
Median household income ($) - Multirace
Median household income ($) - Other Race
Mortgage status - with mortgage (%)
Mortgage status - with second mortgage (%)
Mortgage status - with home equity loan (%)
Mortgage status - with both second mortgage and home equity loan (%)
Mortgage status - without a mortgage (%)
Median year house/condo built
Median year apartment built
Household type by relationship - Male householder living alone (%)
Household type by relationship - Male householder not living alone (%)
Household type by relationship - Female householder living alone (%)
Household type by relationship - Female householder not living alone (%)
Household type by relationship - Opposite-Sex spouse (%)
Household type by relationship - Same-Sex spouse (%)
Household type by relationship - Opposite-Sex unmarried partner (%)
Household type by relationship - Same-Sex unmarried partner (%)
Household type by relationship - In group quarters (%)
Size of family households - 2-person household (%)
Size of family households - 3-person household (%)
Size of family households - 4-person household (%)
Size of family households - 5-person household (%)
Size of family households - 6-person household (%)
Size of family households - 7-or-more-person household (%)
Size of nonfamily households - 1-person household (%)
Size of nonfamily households - 2-person household (%)
Size of nonfamily households - 3-person household (%)
Size of nonfamily households - 4-person household (%)
Size of nonfamily households - 5-person household (%)
Size of nonfamily households - 6-person household (%)
Size of nonfamily households - 7-or-moreperson household (%)
Year house built - Built 2010 or later (%)
Year house built - Built 2000 to 2009 (%)
Year house built - Built 1990 to 1999 (%)
Year house built - Built 1980 to 1989 (%)
Year house built - Built 1970 to 1979 (%)
Year house built - Built 1960 to 1969 (%)
Year house built - Built 1950 to 1959 (%)
Year house built - Built 1940 to 1949 (%)
Year house built - Built 1939 or earlier (%)
Median number of rooms in houses and condos
Median number of rooms in apartments
Median number of bedrooms in owner occupied houses
Mean number of bedrooms in owner occupied houses
Median number of bedrooms in renter occupied houses
Mean number of bedrooms in renter occupied houses
Median number of vehichles in owner occupied houses
Mean number of vehichles in owner occupied houses
Median number of vehichles in renter occupied houses
Mean number of vehichles in renter occupied houses
Rooms in owner-occupied houses - 1 room (%)
Rooms in owner-occupied houses - 2 rooms (%)
Rooms in owner-occupied houses - 3 rooms (%)
Rooms in owner-occupied houses - 4 rooms (%)
Rooms in owner-occupied houses - 5 rooms (%)
Rooms in owner-occupied houses - 6 rooms (%)
Rooms in owner-occupied houses - 7 rooms (%)
Rooms in owner-occupied houses - 8 rooms (%)
Rooms in owner-occupied houses - 9+ rooms (%)
Rooms in renter-occupied houses - 1 room (%)
Rooms in renter-occupied houses - 2 rooms (%)
Rooms in renter-occupied houses - 3 rooms (%)
Rooms in renter-occupied houses - 4 rooms (%)
Rooms in renter-occupied houses - 5 rooms (%)
Rooms in renter-occupied houses - 6 rooms (%)
Rooms in renter-occupied houses - 7 rooms (%)
Rooms in renter-occupied houses - 8 rooms (%)
Rooms in renter-occupied houses - 9+ rooms (%)
Bedrooms in owner-occupied houses - no bedrooms (%)
Bedrooms in owner-occupied houses - 1 bedroom (%)
Bedrooms in owner-occupied houses - 2 bedrooms (%)
Bedrooms in owner-occupied houses - 3 bedrooms (%)
Bedrooms in owner-occupied houses - 4 bedrooms (%)
Bedrooms in owner-occupied houses - 5+ bedrooms (%)
Bedrooms in renter-occupied houses - no bedrooms (%)
Bedrooms in renter-occupied houses - 1 bedroom (%)
Bedrooms in renter-occupied houses - 2 bedrooms (%)
Bedrooms in renter-occupied houses - 3 bedrooms (%)
Bedrooms in renter-occupied houses - 4 bedrooms (%)
Bedrooms in renter-occupied houses - 5+ bedrooms (%)
Vehicles available in owner-occupied houses - no vehicle available (%)
Vehicles available in owner-occupied houses - 1 vehicle available(%)
Vehicles available in owner-occupied houses - 2 Vehicles available (%)
Vehicles available in owner-occupied houses - 3 Vehicles available (%)
Vehicles available in owner-occupied houses - 4 Vehicles available (%)
Vehicles available in owner-occupied houses - 5+ Vehicles available (%)
Vehicles available in renter-occupied houses - no vehicle available (%)
Vehicles available in renter-occupied houses - 1 vehicle available (%)
Vehicles available in renter-occupied houses - 2 Vehicles available (%)
Vehicles available in renter-occupied houses - 3 Vehicles available (%)
Vehicles available in renter-occupied houses - 4 Vehicles available (%)
Vehicles available in renter-occupied houses - 5+ Vehicles available (%)
Housing units in structures - 1, detached (%)
Housing units in structures - 1, attached (%)
Housing units in structures - 2 (%)
Housing units in structures - 3 or 4 (%)
Housing units in structures - 5 to 9 (%)
Housing units in structures - 10 to 19 (%)
Housing units in structures - 20 to 49 (%)
Housing units in structures - 50 or more (%)
Housing units in structures - Mobile home (%)
Housing units in structures - Boat, RV, van, etc. (%)
Housing units in structures - Owners - 1, detached (%)
Housing units in structures - Owners - 1, attached (%)
Housing units in structures - Owners - 2 (%)
Housing units in structures - Owners - 3 or 4 (%)
Housing units in structures - Owners - 5 to 9 (%)
Housing units in structures - Owners - 10 to 19 (%)
Housing units in structures - Owners - 20 to 49 (%)
Housing units in structures - Owners - 50 or more (%)
Housing units in structures - Owners - Mobile home (%)
Housing units in structures - Owners - Boat, RV, van, etc. (%)
Housing units in structures - Renters - 1, detached (%)
Housing units in structures - Renters - 1, attached (%)
Housing units in structures - Renters - 2 (%)
Housing units in structures - Renters - 3 or 4 (%)
Housing units in structures - Renters - 5 to 9 (%)
Housing units in structures - Renters - 10 to 19 (%)
Housing units in structures - Renters - 20 to 49 (%)
Housing units in structures - Renters - 50 or more (%)
Housing units in structures - Renters - Mobile home (%)
Housing units in structures - Renters - Boat, RV, van, etc. (%)
House/condo owner moved in on average (years ago)
Renter moved in on average (years ago)
Year householder moved into unit - Moved in 1999 to March 2000 (%)
Year householder moved into unit - Moved in 1999 to March 2000 (%) - White
Year householder moved into unit - Moved in 1999 to March 2000 (%) - Black or African American
Year householder moved into unit - Moved in 1999 to March 2000 (%) - Asian
Year householder moved into unit - Moved in 1999 to March 2000 (%) - Hispanic or Latino
Year householder moved into unit - Moved in 1999 to March 2000 (%) - American Indian and Alaska Native
Year householder moved into unit - Moved in 1999 to March 2000 (%) - Multirace
Year householder moved into unit - Moved in 1999 to March 2000 (%) - Other Race
Year householder moved into unit - Moved in 1995 to 1998 (%)
Year householder moved into unit - Moved in 1995 to 1998 (%) - White
Year householder moved into unit - Moved in 1995 to 1998 (%) - Black or African American
Year householder moved into unit - Moved in 1995 to 1998 (%) - Asian
Year householder moved into unit - Moved in 1995 to 1998 (%) - Hispanic or Latino
Year householder moved into unit - Moved in 1995 to 1998 (%) - American Indian and Alaska Native
Year householder moved into unit - Moved in 1995 to 1998 (%) - Multirace
Year householder moved into unit - Moved in 1995 to 1998 (%) - Other Race
Year householder moved into unit - Moved in 1990 to 1994 (%)
Year householder moved into unit - Moved in 1990 to 1994 (%) - White
Year householder moved into unit - Moved in 1990 to 1994 (%) - Black or African American
Year householder moved into unit - Moved in 1990 to 1994 (%) - Asian
Year householder moved into unit - Moved in 1990 to 1994 (%) - Hispanic or Latino
Year householder moved into unit - Moved in 1990 to 1994 (%) - American Indian and Alaska Native
Year householder moved into unit - Moved in 1990 to 1994 (%) - Multirace
Year householder moved into unit - Moved in 1990 to 1994 (%) - Other Race
Year householder moved into unit - Moved in 1980 to 1989 (%)
Year householder moved into unit - Moved in 1980 to 1989 (%) - White
Year householder moved into unit - Moved in 1980 to 1989 (%) - Black or African American
Year householder moved into unit - Moved in 1980 to 1989 (%) - Asian
Year householder moved into unit - Moved in 1980 to 1989 (%) - Hispanic or Latino
Year householder moved into unit - Moved in 1980 to 1989 (%) - American Indian and Alaska Native
Year householder moved into unit - Moved in 1980 to 1989 (%) - Multirace
Year householder moved into unit - Moved in 1980 to 1989 (%) - Other Race
Year householder moved into unit - Moved in 1970 to 1979 (%)
Year householder moved into unit - Moved in 1970 to 1979 (%) - White
Year householder moved into unit - Moved in 1970 to 1979 (%) - Black or African American
Year householder moved into unit - Moved in 1970 to 1979 (%) - Asian
Year householder moved into unit - Moved in 1970 to 1979 (%) - Hispanic or Latino
Year householder moved into unit - Moved in 1970 to 1979 (%) - American Indian and Alaska Native
Year householder moved into unit - Moved in 1970 to 1979 (%) - Multirace
Year householder moved into unit - Moved in 1970 to 1979 (%) - Other Race
Year householder moved into unit - Moved in 1969 or earlier (%)
Year householder moved into unit - Moved in 1969 or earlier (%) - White
Year householder moved into unit - Moved in 1969 or earlier (%) - Black or African American
Year householder moved into unit - Moved in 1969 or earlier (%) - Asian
Year householder moved into unit - Moved in 1969 or earlier (%) - Hispanic or Latino
Year householder moved into unit - Moved in 1969 or earlier (%) - American Indian and Alaska Native
Year householder moved into unit - Moved in 1969 or earlier (%) - Multirace
Year householder moved into unit - Moved in 1969 or earlier (%) - Other Race
Housing units lacking complete plumbing facilities (%)
Housing units lacking complete kitchen facilities (%)
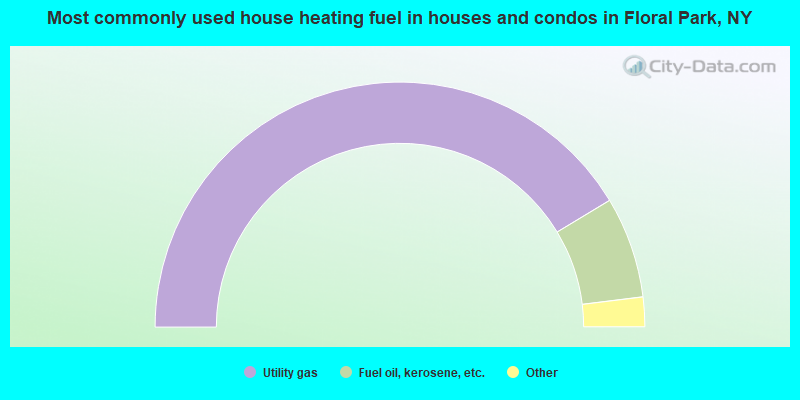
House heating fuel used in houses and condos - Utility gas (%)
House heating fuel used in houses and condos - Bottled, tank, or LP gas (%)
House heating fuel used in houses and condos - Electricity (%)
House heating fuel used in houses and condos - Fuel oil, kerosene, etc. (%)
House heating fuel used in houses and condos - Coal or coke (%)
House heating fuel used in houses and condos - Wood (%)
House heating fuel used in houses and condos - Solar energy (%)
House heating fuel used in houses and condos - Other fuel (%)
House heating fuel used in houses and condos - No fuel used (%)
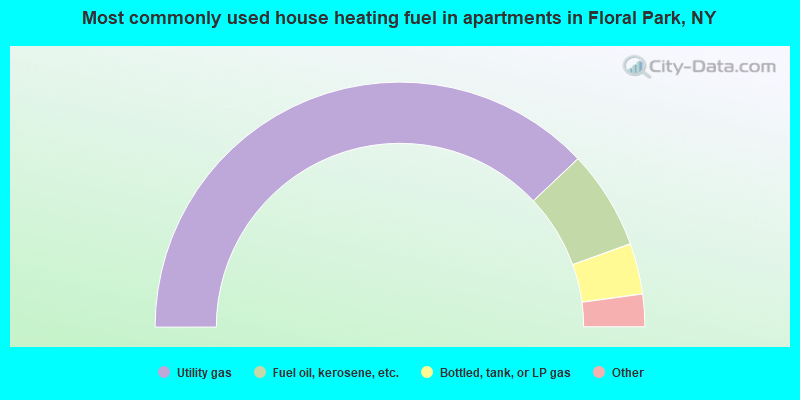
House heating fuel used in apartments - Utility gas (%)
House heating fuel used in apartments - Bottled, tank, or LP gas (%)
House heating fuel used in apartments - Electricity (%)
House heating fuel used in apartments - Fuel oil, kerosene, etc. (%)
House heating fuel used in apartments - Coal or coke (%)
House heating fuel used in apartments - Wood (%)
House heating fuel used in apartments - Solar energy (%)
House heating fuel used in apartments - Other fuel (%)
House heating fuel used in apartments - No fuel used (%)
Median year house/condo built: 1938Median year apartment built: 1947Household type by relationship:
Households: 15,829
Male householders: 2,821 (363 living alone ), Female householders: 2,654 (601 living alone )3,554 spouses (3,533 opposite-sex spouses ), 200 unmarried partners , (200 opposite-sex unmarried partners ), 5,495 children (5,409 natural , 61 adopted , 23 stepchildren ), 142 grandchildren , 70 brothers or sisters , 426 parents , 0 foster children , 195 other relatives , 241 non-relatives In group quarters: 27
Size of family households: 1,643 2-persons , 883 3-persons , 1,016 4-persons , 486 5-persons , 177 6-persons , 87 7-or-more-persons .
Size of nonfamily households: 1,006 1-person , 214 2-persons , 8 3-persons .
2,860 married couples with children. single-parent households (88 men , 237 women ).
74.8% of residents of Floral Park speak English at home. of residents speak Spanish at home (73% speak English very well , 18% speak English well , 7% speak English not well , 2% don't speak English at all ).of residents speak other Indo-European language at home (84% speak English very well , 11% speak English well , 5% speak English not well ).of residents speak Asian or Pacific Island language at home (57% speak English very well , 26% speak English well , 17% speak English not well ).of residents speak other language at home (82% speak English very well , 7% speak English well , 11% speak English not well ).
Foreign born population: 3,320 (21.0%)of them are naturalized citizens )
Median number of rooms in houses and condos:
Median number of rooms in apartments
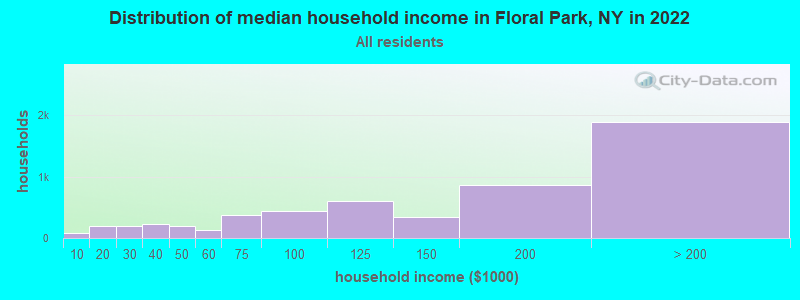
Floral Park, NY household income distribution 81 Less than $10,000189 $10,000 to $19,999192 $20,000 to $29,999228 $30,000 to $39,999196 $40,000 to $49,999131 $50,000 to $59,999379 $60,000 to $74,999444 $75,000 to $99,999601 $100,000 to $124,999338 $125,000 to $149,999857 $150,000 to $199,9991,889 $200,000 or more
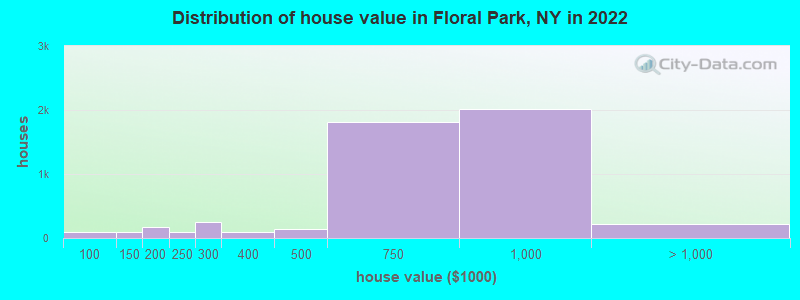
Home value of owner - occupied houses in 2022 in Floral Park, NY 35 $70,000 to $79,9995 $80,000 to $89,99947 $90,000 to $99,99989 $100,000 to $124,999155 $150,000 to $174,99910 $175,000 to $199,99987 $200,000 to $249,999244 $250,000 to $299,99991 $300,000 to $399,999138 $400,000 to $499,9991,819 $500,000 to $749,9992,020 $750,000 to $999,999114 $1,000,000 to $1,499,9993 $1,500,000 to $1,999,999106 $2,000,000 or moreRent paid by renters in 2022 in Floral Park, NY 15 $400 to $4496 $650 to $69966 $1,000 to $1,24978 $1,250 to $1,499168 $1,500 to $1,999134 $2,000 to $2,499122 $2,500 to $2,9995 $3,000 to $3,49965 $3,500 or more85 No cash rent
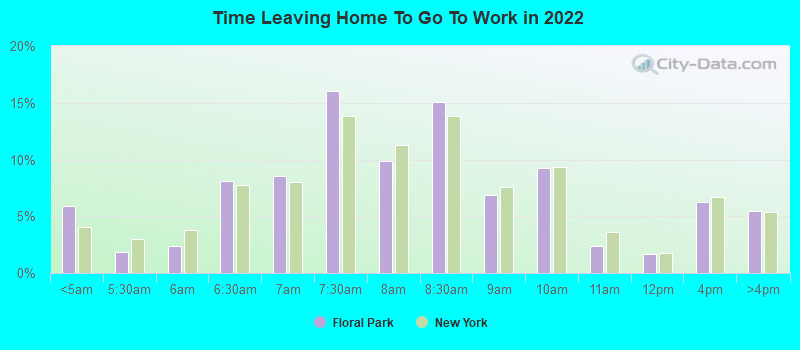
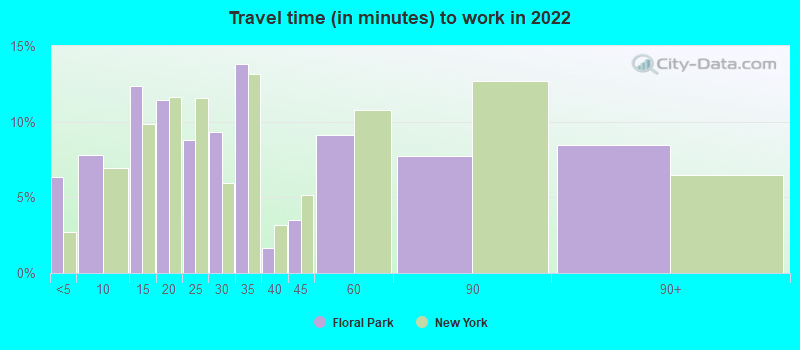
Percentage of workers working in this county: 54.2%Number of people working at home: 1,085 (13.0% of all workers )
Travel time to work (commute)
Less than 5 minutes: 2575 to 9 minutes: 54010 to 14 minutes: 35115 to 19 minutes: 64320 to 24 minutes: 56425 to 29 minutes: 73330 to 34 minutes: 81335 to 39 minutes: 13740 to 44 minutes: 54945 to 59 minutes: 1,02260 to 89 minutes: 1,03290 or more minutes: 620
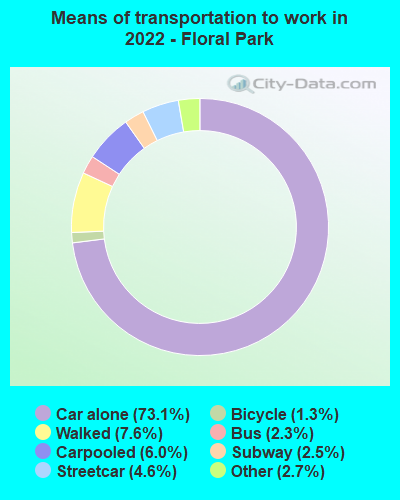
Means of transportation to work:
Drove a car alone: 3,021 (58.1%)Carpooled: 240 (4.6%)Bus : 90 (1.7%)Subway or elevated rail : 167 (3.2%)Long-distance train or commuter rail : 89 (1.7%)Taxi: 158 (3.0%)Bicycle: 83 (1.6%)Walked: 340 (6.5%)Worked at home: 1,085 (20.9%)
Unemployment by race in 2022
Unemployment rate for White non-Hispanic residents 3.6% Males1.5% FemalesUnemployment rate for Black residents 20.2% FemalesUnemployment rate for Asian residents 3.1% Males11.0% FemalesUnemployment rate for two or more race residents 1.4% FemalesUnemployment rate for Hispanic or Latino residents 3.3% Females
Year of entry for the foreign-born population in Floral Park, New York
454 2010 or later 751 2000 to 2009 817 1990 to 1999 530 1980 to 1989 222 1970 to 1979 720 Before 1970
First ancestries reported:
Irish: 1,668 (22.1%)
Italian: 1,366 (18.1%)
American: 617 (8.2%)
Polish: 219 (2.9%)
German: 180 (2.4%)
English: 154 (2.0%)
Hungarian: 81 (1.1%)
European: 74 (1.0%)
British: 71 (0.9%)
Turkish: 61 (0.8%)
Lithuanian: 49 (0.6%)
Ukrainian: 33 (0.4%)
Armenian: 31 (0.4%)
Croatian: 27 (0.4%)
Scotch-Irish: 26 (0.3%)
Haitian: 19 (0.3%)
Scottish: 17 (0.2%)
Iraqi: 16 (0.2%)
Portuguese: 15 (0.2%)
Jamaican: 13 (0.2%)
Austrian: 13 (0.2%)
Guyanese: 13 (0.2%)
Greek: 11 (0.1%)
Eastern European: 10 (0.1%)
Maltese: 9 (0.1%)
French Canadian: 7 (0.09%)
Northern European: 7 (0.09%)
Swedish: 6 (0.08%)
Albanian: 5 (0.07%)
Canadian: 5 (0.07%)
Scandinavian: 5 (0.07%)
French: 4 (0.05%)
Afghan: 4 (0.05%)
Iranian: 4 (0.05%)
Slavic: 3 (0.04%)
Swiss: 3 (0.04%) Most common places of birth for foreign-born residents (%): China, excluding Hong Kong and Taiwan Floral Park:
16.0% (514)New York:
9.1% (410,910)
India Floral Park:
11.0% (354)New York:
3.5% (158,432)
Ireland Floral Park:
8.1% (261)New York:
0.6% (26,772)
Dominican Republic Floral Park:
5.4% (172)New York:
11.1% (501,040)
Italy Floral Park:
4.7% (152)New York:
1.8% (81,374)
Philippines Floral Park:
4.5% (144)New York:
2.0% (91,070)
Guatemala Floral Park:
3.6% (117)New York:
1.4% (61,245)
El Salvador Floral Park:
3.0% (95)New York:
2.4% (108,067)
Turkey Floral Park:
3.0% (95)New York:
0.5% (21,009)
Colombia Floral Park:
2.4% (78)New York:
2.5% (111,920)
Peru Floral Park:
2.4% (78)New York:
1.2% (54,759)
Argentina Floral Park:
2.4% (77)New York:
0.5% (21,928)
England Floral Park:
2.0% (63)New York:
0.5% (23,058)
Taiwan Floral Park:
2.0% (63)New York:
0.7% (30,619)
Haiti Floral Park:
1.9% (60)New York:
2.8% (126,936)
United Kingdom, excluding England and Scotland Floral Park:
1.8% (58)New York:
0.8% (33,869)
Other South America Floral Park:
1.8% (57)New York:
0.2% (8,613)
Malaysia Floral Park:
1.7% (54)New York:
0.3% (11,967)
Hungary Floral Park:
1.6% (52)New York:
0.2% (8,808)
Germany Floral Park:
1.6% (51)New York:
0.9% (38,713)
Guyana Floral Park:
1.6% (51)New York:
3.8% (172,129)
Place of birth for U.S.-born residents:
This state: 11,660Other state: 687Northeast: 187Midwest: 162South: 197West: 152 92.6% of Floral Park residents lived in the same house 1 years ago.
Out of people who lived in different houses, 20.0% lived in this county.
Out of people who lived in different counties, 95.2% lived in New York.
Floral Park:
92.6%State average:
89.6%
Education attainment for males 25 years and older:
No schooling: 194Nursery to 4th grade: 155th and 6th grade: 97th and 8th grade: 189th grade: 010th grade: 2511th grade: 612th grade, no diploma: 96High school graduate (or equivalency): 860Less than 1 year of college: 219Some college more than 1 year, no degree: 414Associate degree: 503Bachelor's degree: 2,043Master's degree: 792Professional school degree: 215Doctorate degree: 412
Education attainment for females 25 years and older:
No schooling: 124Nursery to 4th grade: 45th and 6th grade: 97th and 8th grade: 139th grade: 010th grade: 1511th grade: 2112th grade, no diploma: 86High school graduate (or equivalency): 1,004Less than 1 year of college: 151Some college more than 1 year, no degree: 320Associate degree: 267Bachelor's degree: 1,862Master's degree: 1,364Professional school degree: 201Doctorate degree: 102
Housing units in structures:
One, detached: 4,054One, attached: 75Two: 7843 or 4: 1415 to 9: 10810 to 19: 25520 to 49: 26050 or more: 22Housing units lacking complete plumbing facilities in 2022: 0.1%Housing units lacking complete kitchen facilities in 2022: 0.2%House/condo owner moved in on average 16 years ago
Renter moved in on average 4 years ago
Private vs. public school enrollment:
Students in private schools in grades 1 to 8 (elementary and middle school): 233 Students in private schools in grades 9 to 12 (high school): 328 Students in private undergraduate colleges: 268