Elmwood Park, NJ (New Jersey) Houses and Residents
Estimated median house or condo value in 2022: $448,145 (it was $191,200 in 2000 )
Elmwood Park:
$448,145New Jersey:
$428,900
Lower value quartile - upper value quartile: $338,421 - $528,034Mean price in 2022: Detached houses: $440,802 Here:
$440,802State:
$537,591
Townhouses or other attached units: $443,580 Here:
$443,580State:
$381,113
In 2-unit structures: $530,460 Here:
$530,460State:
$444,476
In 3-to-4-unit structures: $545,313 Here:
$545,313State:
$457,463
In 5-or-more-unit structures: $295,688 Here:
$295,688State:
$368,745
Total population: 20,374 (Urban population: 18,925, Rural population: 0)
Houses: 7,511 (7,265 occupied: 3,937 owner occupied, 3,366 renter occupied )
% of renters here:
46%State:
35%
Housing density: 2,830 houses/condos per square mile
Median price asked for vacant for-sale houses and condos in 2022: $576,924.
Median contract rent in 2022: $1,759 (lower quartile is $1,467, upper quartile is over $2,000)
Median rent asked for vacant for-rent units in 2022: $7,471
Median gross rent in Elmwood Park, NJ in 2022: $1,946
Housing units in Elmwood Park with a mortgage: 2,331 (247 second mortgage, 48 home equity loan, 221 both second mortgage and home equity loan )Houses without a mortgage: 169
Median household income for houses/condos with a mortgage: $112,305
Median household income for apartments without a mortgage: $87,151
Median monthly housing costs: $1,886
Data:
Median house or condo value ($)
Median house or condo value ($ change since 2000)
Median house or condo value ($) - White
Median house or condo value ($) - Black or African American
Median house or condo value ($) - Asian
Median house or condo value ($) - Hispanic or Latino
Median house or condo value ($) - American Indian and Alaska Native
Median house or condo value ($) - Multirace
Median house or condo value ($) - Other Race
Median price asked for mobile homes ($)
Household density (households per square mile)
Mean house or condo value by units in structure - 1, detached ($)
Mean house or condo value by units in structure - 1, attached ($)
Mean house or condo value by units in structure - 2 ($)
Mean house or condo value by units in structure by units in structure - 3 or 4 ($)
Mean house or condo value by units in structure - 5 or more ($)
Mean house or condo value by units in structure - Boat, RV, van, etc. ($)
Mean house or condo value by units in structure - Mobile home ($)
Median contract rent ($)
Median contract rent - Lower quartile ($)
Median contract rent - Upper quartile ($)
Median gross rent ($)
Urban houses (%)
Rural houses (%)
Houses occupied (%)
Houses occupied (% change since 2000)
Houses owner occupied (%)
Houses owner occupied (% change since 2000)
Houses renter occupied (%)
Houses renter occupied (% change since 2000)
Vacant housing units - For rent (%)
Vacant housing units - For rent (% change since 2000)
Vacant housing units - For sale only (%)
Vacant housing units - For sale only (% change since 2000)
Vacant housing units - Rented or sold, not occupied (%)
Vacant housing units - Rented or sold, not occupied (% change since 2000)
Vacant housing units - For seasonal, recreational, or occasional use (%)
Vacant housing units - For seasonal, recreational, or occasional use (% change since 2000)
Vacant housing units - For migrant workers (%)
Vacant housing units - For migrant workers (% change since 2000)
Vacant housing units - Other vacant (%)
Vacant housing units - Other vacant (% change since 2000)
Median monthly housing costs ($)
Median household income for houses/condos with a mortgage ($)
Median household income for houses/condos without a mortgage ($)
Median household income ($)
Median household income ($) - White
Median household income ($) - Black or African American
Median household income ($) - Asian
Median household income ($) - Hispanic or Latino
Median household income ($) - American Indian and Alaska Native
Median household income ($) - Multirace
Median household income ($) - Other Race
Mortgage status - with mortgage (%)
Mortgage status - with second mortgage (%)
Mortgage status - with home equity loan (%)
Mortgage status - with both second mortgage and home equity loan (%)
Mortgage status - without a mortgage (%)
Median year house/condo built
Median year apartment built
Household type by relationship - Male householder living alone (%)
Household type by relationship - Male householder not living alone (%)
Household type by relationship - Female householder living alone (%)
Household type by relationship - Female householder not living alone (%)
Household type by relationship - Opposite-Sex spouse (%)
Household type by relationship - Same-Sex spouse (%)
Household type by relationship - Opposite-Sex unmarried partner (%)
Household type by relationship - Same-Sex unmarried partner (%)
Household type by relationship - In group quarters (%)
Size of family households - 2-person household (%)
Size of family households - 3-person household (%)
Size of family households - 4-person household (%)
Size of family households - 5-person household (%)
Size of family households - 6-person household (%)
Size of family households - 7-or-more-person household (%)
Size of nonfamily households - 1-person household (%)
Size of nonfamily households - 2-person household (%)
Size of nonfamily households - 3-person household (%)
Size of nonfamily households - 4-person household (%)
Size of nonfamily households - 5-person household (%)
Size of nonfamily households - 6-person household (%)
Size of nonfamily households - 7-or-moreperson household (%)
Year house built - Built 2010 or later (%)
Year house built - Built 2000 to 2009 (%)
Year house built - Built 1990 to 1999 (%)
Year house built - Built 1980 to 1989 (%)
Year house built - Built 1970 to 1979 (%)
Year house built - Built 1960 to 1969 (%)
Year house built - Built 1950 to 1959 (%)
Year house built - Built 1940 to 1949 (%)
Year house built - Built 1939 or earlier (%)
Median number of rooms in houses and condos
Median number of rooms in apartments
Median number of bedrooms in owner occupied houses
Mean number of bedrooms in owner occupied houses
Median number of bedrooms in renter occupied houses
Mean number of bedrooms in renter occupied houses
Median number of vehichles in owner occupied houses
Mean number of vehichles in owner occupied houses
Median number of vehichles in renter occupied houses
Mean number of vehichles in renter occupied houses
Rooms in owner-occupied houses - 1 room (%)
Rooms in owner-occupied houses - 2 rooms (%)
Rooms in owner-occupied houses - 3 rooms (%)
Rooms in owner-occupied houses - 4 rooms (%)
Rooms in owner-occupied houses - 5 rooms (%)
Rooms in owner-occupied houses - 6 rooms (%)
Rooms in owner-occupied houses - 7 rooms (%)
Rooms in owner-occupied houses - 8 rooms (%)
Rooms in owner-occupied houses - 9+ rooms (%)
Rooms in renter-occupied houses - 1 room (%)
Rooms in renter-occupied houses - 2 rooms (%)
Rooms in renter-occupied houses - 3 rooms (%)
Rooms in renter-occupied houses - 4 rooms (%)
Rooms in renter-occupied houses - 5 rooms (%)
Rooms in renter-occupied houses - 6 rooms (%)
Rooms in renter-occupied houses - 7 rooms (%)
Rooms in renter-occupied houses - 8 rooms (%)
Rooms in renter-occupied houses - 9+ rooms (%)
Bedrooms in owner-occupied houses - no bedrooms (%)
Bedrooms in owner-occupied houses - 1 bedroom (%)
Bedrooms in owner-occupied houses - 2 bedrooms (%)
Bedrooms in owner-occupied houses - 3 bedrooms (%)
Bedrooms in owner-occupied houses - 4 bedrooms (%)
Bedrooms in owner-occupied houses - 5+ bedrooms (%)
Bedrooms in renter-occupied houses - no bedrooms (%)
Bedrooms in renter-occupied houses - 1 bedroom (%)
Bedrooms in renter-occupied houses - 2 bedrooms (%)
Bedrooms in renter-occupied houses - 3 bedrooms (%)
Bedrooms in renter-occupied houses - 4 bedrooms (%)
Bedrooms in renter-occupied houses - 5+ bedrooms (%)
Vehicles available in owner-occupied houses - no vehicle available (%)
Vehicles available in owner-occupied houses - 1 vehicle available(%)
Vehicles available in owner-occupied houses - 2 Vehicles available (%)
Vehicles available in owner-occupied houses - 3 Vehicles available (%)
Vehicles available in owner-occupied houses - 4 Vehicles available (%)
Vehicles available in owner-occupied houses - 5+ Vehicles available (%)
Vehicles available in renter-occupied houses - no vehicle available (%)
Vehicles available in renter-occupied houses - 1 vehicle available (%)
Vehicles available in renter-occupied houses - 2 Vehicles available (%)
Vehicles available in renter-occupied houses - 3 Vehicles available (%)
Vehicles available in renter-occupied houses - 4 Vehicles available (%)
Vehicles available in renter-occupied houses - 5+ Vehicles available (%)
Housing units in structures - 1, detached (%)
Housing units in structures - 1, attached (%)
Housing units in structures - 2 (%)
Housing units in structures - 3 or 4 (%)
Housing units in structures - 5 to 9 (%)
Housing units in structures - 10 to 19 (%)
Housing units in structures - 20 to 49 (%)
Housing units in structures - 50 or more (%)
Housing units in structures - Mobile home (%)
Housing units in structures - Boat, RV, van, etc. (%)
Housing units in structures - Owners - 1, detached (%)
Housing units in structures - Owners - 1, attached (%)
Housing units in structures - Owners - 2 (%)
Housing units in structures - Owners - 3 or 4 (%)
Housing units in structures - Owners - 5 to 9 (%)
Housing units in structures - Owners - 10 to 19 (%)
Housing units in structures - Owners - 20 to 49 (%)
Housing units in structures - Owners - 50 or more (%)
Housing units in structures - Owners - Mobile home (%)
Housing units in structures - Owners - Boat, RV, van, etc. (%)
Housing units in structures - Renters - 1, detached (%)
Housing units in structures - Renters - 1, attached (%)
Housing units in structures - Renters - 2 (%)
Housing units in structures - Renters - 3 or 4 (%)
Housing units in structures - Renters - 5 to 9 (%)
Housing units in structures - Renters - 10 to 19 (%)
Housing units in structures - Renters - 20 to 49 (%)
Housing units in structures - Renters - 50 or more (%)
Housing units in structures - Renters - Mobile home (%)
Housing units in structures - Renters - Boat, RV, van, etc. (%)
House/condo owner moved in on average (years ago)
Renter moved in on average (years ago)
Year householder moved into unit - Moved in 1999 to March 2000 (%)
Year householder moved into unit - Moved in 1999 to March 2000 (%) - White
Year householder moved into unit - Moved in 1999 to March 2000 (%) - Black or African American
Year householder moved into unit - Moved in 1999 to March 2000 (%) - Asian
Year householder moved into unit - Moved in 1999 to March 2000 (%) - Hispanic or Latino
Year householder moved into unit - Moved in 1999 to March 2000 (%) - American Indian and Alaska Native
Year householder moved into unit - Moved in 1999 to March 2000 (%) - Multirace
Year householder moved into unit - Moved in 1999 to March 2000 (%) - Other Race
Year householder moved into unit - Moved in 1995 to 1998 (%)
Year householder moved into unit - Moved in 1995 to 1998 (%) - White
Year householder moved into unit - Moved in 1995 to 1998 (%) - Black or African American
Year householder moved into unit - Moved in 1995 to 1998 (%) - Asian
Year householder moved into unit - Moved in 1995 to 1998 (%) - Hispanic or Latino
Year householder moved into unit - Moved in 1995 to 1998 (%) - American Indian and Alaska Native
Year householder moved into unit - Moved in 1995 to 1998 (%) - Multirace
Year householder moved into unit - Moved in 1995 to 1998 (%) - Other Race
Year householder moved into unit - Moved in 1990 to 1994 (%)
Year householder moved into unit - Moved in 1990 to 1994 (%) - White
Year householder moved into unit - Moved in 1990 to 1994 (%) - Black or African American
Year householder moved into unit - Moved in 1990 to 1994 (%) - Asian
Year householder moved into unit - Moved in 1990 to 1994 (%) - Hispanic or Latino
Year householder moved into unit - Moved in 1990 to 1994 (%) - American Indian and Alaska Native
Year householder moved into unit - Moved in 1990 to 1994 (%) - Multirace
Year householder moved into unit - Moved in 1990 to 1994 (%) - Other Race
Year householder moved into unit - Moved in 1980 to 1989 (%)
Year householder moved into unit - Moved in 1980 to 1989 (%) - White
Year householder moved into unit - Moved in 1980 to 1989 (%) - Black or African American
Year householder moved into unit - Moved in 1980 to 1989 (%) - Asian
Year householder moved into unit - Moved in 1980 to 1989 (%) - Hispanic or Latino
Year householder moved into unit - Moved in 1980 to 1989 (%) - American Indian and Alaska Native
Year householder moved into unit - Moved in 1980 to 1989 (%) - Multirace
Year householder moved into unit - Moved in 1980 to 1989 (%) - Other Race
Year householder moved into unit - Moved in 1970 to 1979 (%)
Year householder moved into unit - Moved in 1970 to 1979 (%) - White
Year householder moved into unit - Moved in 1970 to 1979 (%) - Black or African American
Year householder moved into unit - Moved in 1970 to 1979 (%) - Asian
Year householder moved into unit - Moved in 1970 to 1979 (%) - Hispanic or Latino
Year householder moved into unit - Moved in 1970 to 1979 (%) - American Indian and Alaska Native
Year householder moved into unit - Moved in 1970 to 1979 (%) - Multirace
Year householder moved into unit - Moved in 1970 to 1979 (%) - Other Race
Year householder moved into unit - Moved in 1969 or earlier (%)
Year householder moved into unit - Moved in 1969 or earlier (%) - White
Year householder moved into unit - Moved in 1969 or earlier (%) - Black or African American
Year householder moved into unit - Moved in 1969 or earlier (%) - Asian
Year householder moved into unit - Moved in 1969 or earlier (%) - Hispanic or Latino
Year householder moved into unit - Moved in 1969 or earlier (%) - American Indian and Alaska Native
Year householder moved into unit - Moved in 1969 or earlier (%) - Multirace
Year householder moved into unit - Moved in 1969 or earlier (%) - Other Race
Housing units lacking complete plumbing facilities (%)
Housing units lacking complete kitchen facilities (%)
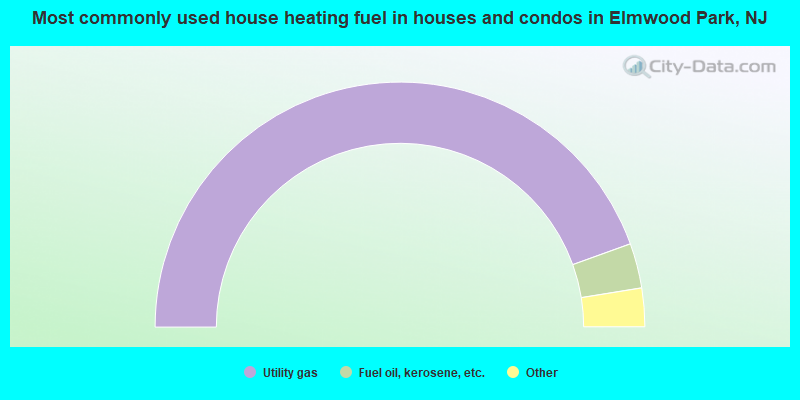
House heating fuel used in houses and condos - Utility gas (%)
House heating fuel used in houses and condos - Bottled, tank, or LP gas (%)
House heating fuel used in houses and condos - Electricity (%)
House heating fuel used in houses and condos - Fuel oil, kerosene, etc. (%)
House heating fuel used in houses and condos - Coal or coke (%)
House heating fuel used in houses and condos - Wood (%)
House heating fuel used in houses and condos - Solar energy (%)
House heating fuel used in houses and condos - Other fuel (%)
House heating fuel used in houses and condos - No fuel used (%)
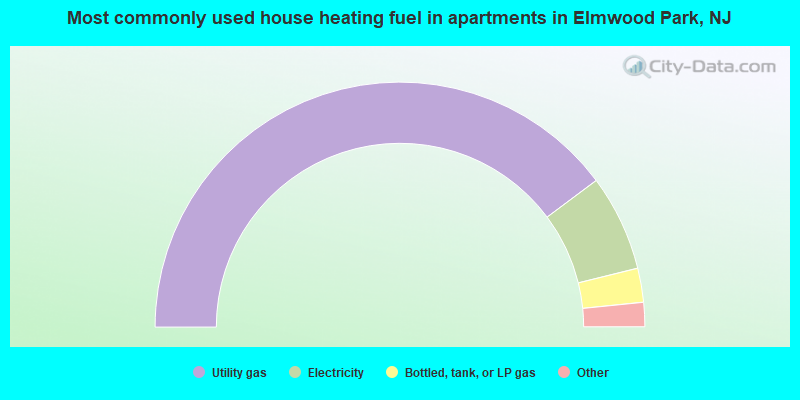
House heating fuel used in apartments - Utility gas (%)
House heating fuel used in apartments - Bottled, tank, or LP gas (%)
House heating fuel used in apartments - Electricity (%)
House heating fuel used in apartments - Fuel oil, kerosene, etc. (%)
House heating fuel used in apartments - Coal or coke (%)
House heating fuel used in apartments - Wood (%)
House heating fuel used in apartments - Solar energy (%)
House heating fuel used in apartments - Other fuel (%)
House heating fuel used in apartments - No fuel used (%)
Median year house/condo built: 1954Median year apartment built: 1964Household type by relationship:
Households: 21,255
Male householders: 3,338 (448 living alone ), Female householders: 3,879 (940 living alone )3,704 spouses (3,670 opposite-sex spouses ), 658 unmarried partners , (579 opposite-sex unmarried partners ), 6,646 children (6,321 natural , 96 adopted , 227 stepchildren ), 359 grandchildren , 563 brothers or sisters , 966 parents , 0 foster children , 641 other relatives , 460 non-relatives In group quarters: 34
Size of family households: 1,780 2-persons , 1,345 3-persons , 1,168 4-persons , 560 5-persons , 446 6-persons , 178 7-or-more-persons .
Size of nonfamily households: 1,436 1-person , 399 2-persons , 18 3-persons , 18 4-persons .
2,575 married couples with children. single-parent households (150 men , 1,292 women ).
42.7% of residents of Elmwood Park speak English at home. of residents speak Spanish at home (64% speak English very well , 20% speak English well , 9% speak English not well , 7% don't speak English at all ).of residents speak other Indo-European language at home (57% speak English very well , 24% speak English well , 15% speak English not well , 4% don't speak English at all ).of residents speak Asian or Pacific Island language at home (50% speak English very well , 31% speak English well , 18% speak English not well , 1% don't speak English at all ).of residents speak other language at home (69% speak English very well , 15% speak English well , 14% speak English not well , 2% don't speak English at all ).
Foreign born population: 7,945 (37.4%)of them are naturalized citizens )
Median number of rooms in houses and condos:
Median number of rooms in apartments
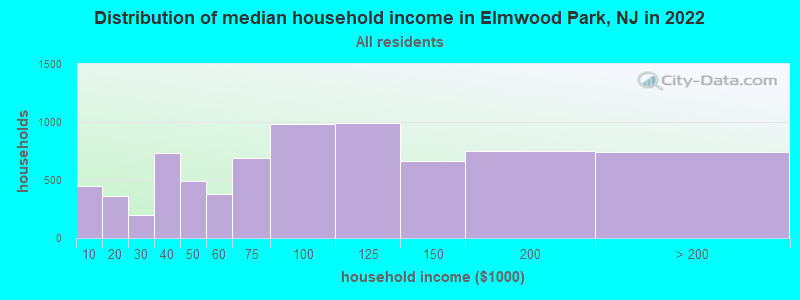
Elmwood Park, NJ household income distribution 447 Less than $10,000363 $10,000 to $19,999199 $20,000 to $29,999736 $30,000 to $39,999494 $40,000 to $49,999376 $50,000 to $59,999686 $60,000 to $74,999982 $75,000 to $99,999988 $100,000 to $124,999663 $125,000 to $149,999749 $150,000 to $199,999738 $200,000 or more
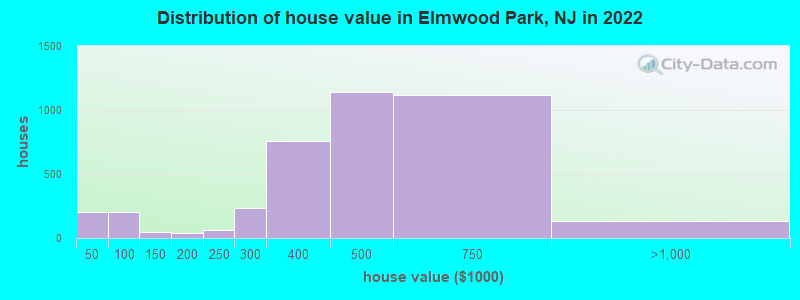
Home value of owner - occupied houses in 2022 in Elmwood Park, NJ 189 Less than $10,00013 $35,000 to $39,999126 $50,000 to $59,99924 $60,000 to $69,99946 $80,000 to $89,9993 $90,000 to $99,99949 $125,000 to $149,99922 $150,000 to $174,99916 $175,000 to $199,99960 $200,000 to $249,999230 $250,000 to $299,999757 $300,000 to $399,9991,143 $400,000 to $499,9991,116 $500,000 to $749,999117 $750,000 to $999,99916 $1,000,000 to $1,499,999Rent paid by renters in 2022 in Elmwood Park, NJ 49 $150 to $19965 $200 to $2499 $300 to $34918 $550 to $5998 $600 to $64923 $750 to $7993 $800 to $89940 $900 to $999134 $1,000 to $1,249568 $1,250 to $1,4991,407 $1,500 to $1,999924 $2,000 to $2,49941 $2,500 to $2,99938 $3,000 to $3,49924 No cash rent
Percentage of workers working in this county: 60.2%Number of people working at home: 872 (8.0% of all workers )
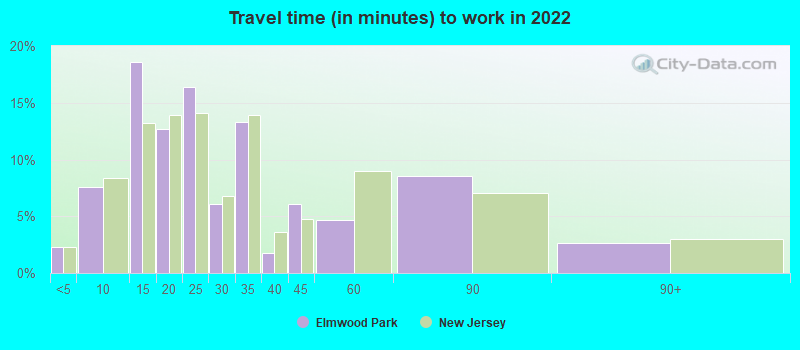
Travel time to work (commute)
Less than 5 minutes: 4665 to 9 minutes: 79710 to 14 minutes: 1,84715 to 19 minutes: 1,17320 to 24 minutes: 1,50725 to 29 minutes: 55730 to 34 minutes: 1,28035 to 39 minutes: 23740 to 44 minutes: 38545 to 59 minutes: 71460 to 89 minutes: 59190 or more minutes: 243
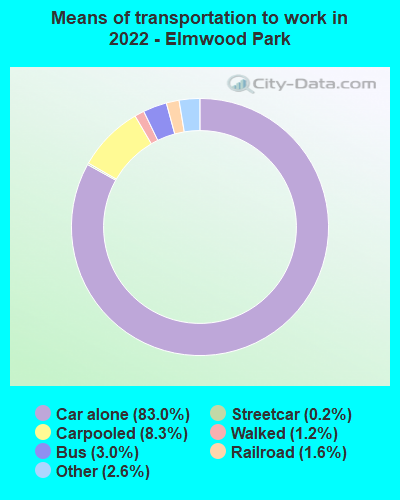
Means of transportation to work:
Drove a car alone: 5,898 (71.0%)Carpooled: 706 (8.5%)Bus : 195 (2.3%)Subway or elevated rail : 14 (0.2%)Light rail, streetcar or trolley : 162 (1.9%)Taxi: 212 (2.6%)Walked: 93 (1.1%)Worked at home: 872 (10.5%)
Unemployment by race in 2022
Unemployment rate for White non-Hispanic residents 2.2% Males3.6% FemalesUnemployment rate for Black residents 54.6% Males28.4% FemalesUnemployment rate for Asian residents 3.3% Males2.9% FemalesUnemployment rate for other race residents 1.6% Males2.4% FemalesUnemployment rate for two or more race residents 21.1% FemalesUnemployment rate for Hispanic or Latino residents 2.8% Males7.3% Females
Year of entry for the foreign-born population in Elmwood Park, New Jersey
2,118 2010 or later 1,826 2000 to 2009 1,802 1990 to 1999 1,530 1980 to 1989 910 1970 to 1979 1,058 Before 1970
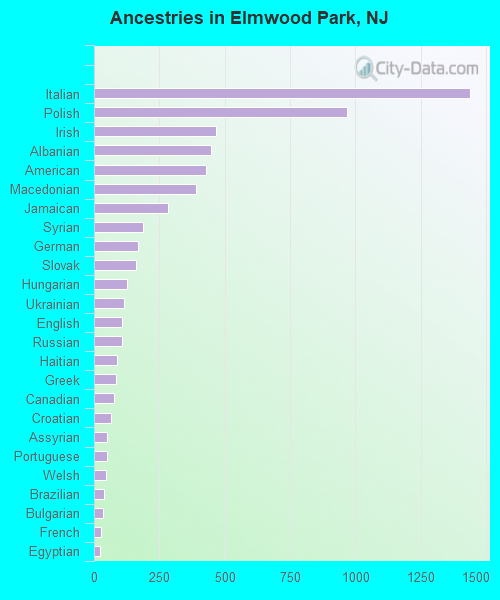
First ancestries reported:
Italian: 1,439 (11.0%)
Polish: 969 (7.4%)
Irish: 467 (3.6%)
Albanian: 448 (3.4%)
American: 430 (3.3%)
Macedonian: 392 (3.0%)
Jamaican: 284 (2.2%)
Syrian: 188 (1.4%)
German: 169 (1.3%)
Slovak: 159 (1.2%)
Hungarian: 125 (1.0%)
Ukrainian: 114 (0.9%)
English: 108 (0.8%)
Russian: 107 (0.8%)
Haitian: 87 (0.7%)
Greek: 84 (0.6%)
Canadian: 78 (0.6%)
Croatian: 64 (0.5%)
Assyrian: 51 (0.4%)
Portuguese: 51 (0.4%)
Welsh: 47 (0.4%)
Brazilian: 39 (0.3%)
Bulgarian: 35 (0.3%)
French: 26 (0.2%)
Egyptian: 22 (0.2%)
Turkish: 21 (0.2%)
British West Indian: 21 (0.2%)
Yugoslavian: 17 (0.1%)
Trinidadian and Tobagonian: 13 (0.10%)
European: 10 (0.08%)
Serbian: 8 (0.06%)
French Canadian: 6 (0.05%)
British: 5 (0.04%)
Norwegian: 3 (0.02%) Most common places of birth for foreign-born residents (%): Dominican Republic Elmwood Park:
12.4% (985)New Jersey:
9.7% (209,055)
Poland Elmwood Park:
9.2% (730)New Jersey:
2.3% (48,811)
India Elmwood Park:
8.8% (698)New Jersey:
12.8% (274,609)
Peru Elmwood Park:
6.3% (504)New Jersey:
2.7% (58,563)
Colombia Elmwood Park:
5.9% (471)New Jersey:
4.2% (90,817)
North Macedonia (Macedonia) Elmwood Park:
4.5% (355)New Jersey:
0.2% (5,094)
Philippines Elmwood Park:
4.2% (335)New Jersey:
4.0% (85,934)
Jamaica Elmwood Park:
3.8% (302)New Jersey:
2.2% (47,365)
Italy Elmwood Park:
3.6% (284)New Jersey:
1.5% (33,198)
Ecuador Elmwood Park:
3.3% (262)New Jersey:
4.4% (95,275)
Ukraine Elmwood Park:
2.7% (215)New Jersey:
1.1% (22,760)
Albania Elmwood Park:
2.6% (204)New Jersey:
0.3% (6,130)
Korea Elmwood Park:
2.2% (178)New Jersey:
3.3% (70,512)
Other Eastern Europe Elmwood Park:
2.1% (164)New Jersey:
0.4% (7,791)
Cuba Elmwood Park:
2.0% (162)New Jersey:
2.1% (45,435)
Syria Elmwood Park:
1.9% (151)New Jersey:
0.3% (5,966)
Pakistan Elmwood Park:
1.5% (123)New Jersey:
1.3% (27,580)
Place of birth for U.S.-born residents:
This state: 9,934Other state: 2,925Northeast: 2,129Midwest: 168South: 340West: 324 93.8% of Elmwood Park residents lived in the same house 1 years ago.
Out of people who lived in different houses, 31.2% lived in this county.
Out of people who lived in different counties, 75.7% lived in New Jersey.
Elmwood Park:
93.8%State average:
90.4%
Education attainment for males 25 years and older:
No schooling: 179Nursery to 4th grade: 435th and 6th grade: 327th and 8th grade: 479th grade: 6310th grade: 1611th grade: 13112th grade, no diploma: 244High school graduate (or equivalency): 2,300Less than 1 year of college: 466Some college more than 1 year, no degree: 630Associate degree: 730Bachelor's degree: 1,346Master's degree: 475Professional school degree: 189Doctorate degree: 105
Education attainment for females 25 years and older:
No schooling: 111Nursery to 4th grade: 405th and 6th grade: 857th and 8th grade: 849th grade: 4910th grade: 5211th grade: 7912th grade, no diploma: 123High school graduate (or equivalency): 2,455Less than 1 year of college: 515Some college more than 1 year, no degree: 661Associate degree: 818Bachelor's degree: 1,810Master's degree: 688Professional school degree: 60Doctorate degree: 114
Housing units in structures:
One, detached: 3,104One, attached: 612Two: 2,2753 or 4: 6965 to 9: 18010 to 19: 12120 to 49: 15550 or more: 364Housing units lacking complete plumbing facilities in 2022: 1.5%Housing units lacking complete kitchen facilities in 2022: 2.3%House/condo owner moved in on average 16 years ago
Renter moved in on average 3 years ago
Private vs. public school enrollment:
Students in private schools in grades 1 to 8 (elementary and middle school): 322 Here:
15.6%New Jersey:
12.3%
Students in private schools in grades 9 to 12 (high school): 69 Here:
5.9%New Jersey:
13.1%
Students in private undergraduate colleges: 268 Here:
26.7%New Jersey:
33.2%