East Riverdale, MD (Maryland) Houses and Residents
| East Riverdale: | $353,040 |
| Maryland: | $398,100 |
Total population: 15,509 (Urban population: 15,379, Rural population: 0)
Houses: 4,845 (4,703 occupied: 2,523 owner occupied, 2,200 renter occupied)
| % of renters here: | 47% |
| State: | 32% |
Housing density: 2,948 houses/condos per square mile
Median price asked for vacant for-sale houses and condos in 2022: $451,119.
Median contract rent in 2022: $1,354 (lower quartile is $1,100, upper quartile is $1,731)
Median rent asked for vacant for-rent units in 2022: $1,881
Median gross rent in East Riverdale, MD in 2022: $1,532
Housing units in East Riverdale with a mortgage: 1,946 (90 second mortgage, 3 home equity loan, 61 both second mortgage and home equity loan)
Houses without a mortgage: 31
Median household income for houses/condos with a mortgage: $95,940
Median household income for apartments without a mortgage: $98,142
Median monthly housing costs: $1,541
Compare current foreclosures near East Riverdale, MD:
| Photo | Address | Area | Beds / Baths | Price | Details |
|---|---|---|---|---|---|

|
#1
17th St NW Apt 504
Washington, DC 20009
|
800 sq. feet
|
1 baths 1 beds |
$395,000
|
show details |

|
#2
Wilson Ln Apt 204
Mc Lean, VA 22102
|
925 sq. feet
|
1 baths 2 beds |
$359,900
|
show details |

|
#3
Sand Cherry Way
Clinton, MD 20735
|
3,328 sq. feet
|
2 baths 5 beds |
$613,600
|
show details |

|
#4
Monroe St NW
Washington, DC 20010
|
- sq. feet
|
2 baths 2 beds |
$665,000
|
show details |

|
#5
Rolling Meadows Rd
Upper Marlboro, MD 20772
|
2,459 sq. feet
|
2 baths 3 beds |
$405,000
|
show details |

|
#6
Heming Ln
Bowie, MD 20716
|
1,800 sq. feet
|
2 baths 3 beds |
$400,000
|
show details |

|
#7
19th St NW
Washington, DC 20036
|
2,515 sq. feet
|
6 baths 8 beds |
$1,574,900
|
show details |

|
#8
Pooks Hill Rd Apt 1612s
Bethesda, MD 20814
|
1,250 sq. feet
|
1 baths 2 beds |
$289,000
|
show details |

|
#9
Cathedral Ave NW Apt 108
Washington, DC 20016
|
765 sq. feet
|
1 baths 1 beds |
$269,900
|
show details |

|
#10
Fitzgibbon Ct
Bowie, MD 20721
|
1,300 sq. feet
|
2 baths 3 beds |
$369,200
|
show details |
| Photo | Address | Area | Beds / Baths | Price | Details |
|---|---|---|---|---|---|

|
#11
Applegarth Pl
Capitol Heights, MD 20743
|
1,200 sq. feet
|
1 baths 3 beds |
$314,900
|
show details |

|
#12
Interlachen Dr Apt 111
Silver Spring, MD 20906
|
965 sq. feet
|
1 baths 2 beds |
$148,000
|
show details |

|
#13
Carousel Ct
Upper Marlboro, MD 20772
|
2,112 sq. feet
|
2 baths 3 beds |
$385,000
|
show details |

|
#14
Crafford Pl
Fort Washington, MD 20744
|
1,890 sq. feet
|
1 baths 3 beds |
$265,900
|
show details |

|
#15
Pickett Dr
Suitland, MD 20746
|
1,296 sq. feet
|
1 baths 2 beds |
$335,000
|
show details |

|
#16
3rd St
Lanham, MD 20706
|
1,104 sq. feet
|
2 baths 3 beds |
$369,200
|
show details |

|
#17
Old Fort Rd
Fort Washington, MD 20744
|
721 sq. feet
|
1 baths 2 beds |
$179,900
|
show details |

|
#18
Hammersmith Cir
Silver Spring, MD 20906
|
1,152 sq. feet
|
1 baths 3 beds |
$328,600
|
show details |

|
#19
Henson Ln
Temple Hills, MD 20748
|
1,566 sq. feet
|
2 baths 3 beds |
$300,000
|
show details |

|
#20
Buchanan St NE
Washington, DC 20017
|
1,240 sq. feet
|
2 baths 3 beds |
$325,000
|
show details |
| Photo | Address | Area | Beds / Baths | Price | Details |
|---|---|---|---|---|---|

|
#21
23rd Pl
Hyattsville, MD 20783
|
1,188 sq. feet
|
2 baths 4 beds |
$379,600
|
show details |

|
#22
Wilson Bridge Dr Unit #6770 A-2
Oxon Hill, MD 20745
|
- sq. feet
|
1 baths 1 beds |
$99,750
|
show details |

|
#23
Brooke Ln
Upper Marlboro, MD 20772
|
- sq. feet
|
5 baths 6 beds |
$949,000
|
show details |

|
#24
Delaware Ave SW Apt N720
Washington, DC 20024
|
- sq. feet
|
1 baths 1 beds |
$139,900
|
show details |

|
#25
T St SE Apt 3
Washington, DC 20020
|
- sq. feet
|
2 baths 4 beds |
$307,500
|
show details |

|
#26
Piano Ln # 99
Silver Spring, MD 20904
|
1,377 sq. feet
|
2 baths 3 beds |
show details | |

|
#27
Yoakum Pkwy Apt 22304
Alexandria, VA 22304
|
1,098 sq. feet
|
2 baths 1 beds |
show details | |

|
#28
Oakwood St SE Apt B5
Washington, DC 20032
|
628 sq. feet
|
1 baths 1 beds |
show details | |

|
#29
E St NW Apt 1022
Washington, DC 20004
|
822 sq. feet
|
1 baths 1 beds |
show details | |

|
#30
8th St NW # 1
Washington, DC 20011
|
871 sq. feet
|
2 baths 2 beds |
show details |
| Photo | Address | Area | Beds / Baths | Price | Details |
|---|---|---|---|---|---|

|
#31
Oakland Mills Rd
Columbia, MD 21046
|
- sq. feet
|
3 baths 4 beds |
show details | |

|
#32
New York Ave NW Apt 202
Washington, DC 20001
|
990 sq. feet
|
1 baths 2 beds |
show details | |

|
#33
Illinois Ave NW
Washington, DC 20011
|
1,856 sq. feet
|
4 baths 3 beds |
show details | |

|
#34
8th St NE
Washington, DC 20002
|
1,444 sq. feet
|
1 baths 3 beds |
show details | |

|
#35
Fort Baker Dr SE
Washington, DC 20020
|
1,303 sq. feet
|
2 baths 3 beds |
show details | |

|
#36
50th St NE
Washington, DC 20019
|
806 sq. feet
|
1 baths 2 beds |
show details | |

|
#37
Nash St NE
Washington, DC 20019
|
896 sq. feet
|
1 baths 2 beds |
show details | |

|
#38
Eastern Ave NE
Washington, DC 20017
|
1,400 sq. feet
|
2 baths 3 beds |
show details | |

|
#39
1st St NW Apt 10
Washington, DC 20001
|
551 sq. feet
|
1 baths 1 beds |
show details | |

|
#40
Farragut St NW
Washington, DC 20011
|
1,504 sq. feet
|
2 baths 3 beds |
show details |
| Photo | Address | Area | Beds / Baths | Price | Details |
|---|---|---|---|---|---|

|
#41
Corcoran St NW # 1
Washington, DC 20009
|
1,771 sq. feet
|
3 baths 2 beds |
show details | |

|
#42
Keefer Pl NW
Washington, DC 20010
|
1,236 sq. feet
|
2 baths 3 beds |
show details | |

|
#43
18th St SE
Washington, DC 20020
|
3,200 sq. feet
|
4 baths 4 beds |
show details | |

|
#44
Austin St SE
Washington, DC 20020
|
1,108 sq. feet
|
1 baths 4 beds |
show details | |

|
#45
Upshur St NE
Washington, DC 20018
|
1,344 sq. feet
|
3 baths 3 beds |
show details | |

|
#46
Otis Pl NW
Washington, DC 20010
|
1,360 sq. feet
|
1 baths 3 beds |
show details | |

|
#47
T Pl SE
Washington, DC 20020
|
900 sq. feet
|
2 baths 2 beds |
show details | |

|
#48
Allison St NE
Washington, DC 20017
|
1,440 sq. feet
|
3 baths 3 beds |
show details | |

|
#49
Georgia Ave NW
Washington, DC 20011
|
1,614 sq. feet
|
2 baths 3 beds |
show details | |

|
Check over 1 million property listings on Foreclosure.com!
|
browse all offers | |||


Median year apartment built: 1964
Household type by relationship:
Households: 17,886- Male householders: 2,704 (416 living alone), Female householders: 1,886 (362 living alone)
1,879 spouses (1,831 opposite-sex spouses), 541 unmarried partners, (541 opposite-sex unmarried partners), 6,901 children (6,635 natural, 55 adopted, 210 stepchildren), 667 grandchildren, 545 brothers or sisters, 410 parents, 0 foster children, 905 other relatives, 1,439 non-relatives
- In group quarters: 4
Size of family households: 924 2-persons, 774 3-persons, 712 4-persons, 434 5-persons, 377 6-persons, 502 7-or-more-persons.
Size of nonfamily households: 766 1-person, 101 2-persons, 97 3-persons, 10 4-persons, 3 5-persons.
2,603 married couples with children.
2,082 single-parent households (1,411 men, 671 women).
31.6% of residents of East Riverdale speak English at home.
62.5% of residents speak Spanish at home (36% speak English very well, 21% speak English well, 29% speak English not well, 13% don't speak English at all).
6.0% of residents speak other Indo-European language at home (24% speak English very well, 21% speak English well, 43% speak English not well, 12% don't speak English at all).
0.7% of residents speak Asian or Pacific Island language at home (43% speak English very well, 37% speak English well, 19% speak English not well).
2.2% of residents speak other language at home (78% speak English very well, 10% speak English well, 12% speak English not well).
Foreign born population: 10,296 (57.6%)
(23.0% of them are naturalized citizens)
| Here: | 6.8 |
| State: | 7.3 |
| Here: | 4.4 |
| State: | 4.2 |

- Bedrooms in owner-occupied houses and condos in East Riverdale, Maryland
- 0no bedroom
- 91 bedroom
- 1642 bedrooms
- 1,2043 bedrooms
- 7244 bedrooms
- 4225+ bedrooms

- Bedrooms in renter-occupied apartments in East Riverdale, Maryland
- 174no bedroom
- 3631 bedroom
- 1,0612 bedrooms
- 2913 bedrooms
- 2214 bedrooms
- 915+ bedrooms

- Cars and other vehicles available in East Riverdale in owner-occupied houses/condos
- 108no vehicle
- 4771 vehicle
- 1,1822 vehicles
- 5323 vehicles
- 1534 vehicles
- 715+ vehicles

- Cars and other vehicles available in East Riverdale in renter-occupied apartments
- 613no vehicle
- 8371 vehicle
- 5642 vehicles
- 1043 vehicles
- 254 vehicles
- 585+ vehicles

- Rooms in owner-occupied houses in East Riverdale, Maryland
- 01 room
- 92 rooms
- 83 rooms
- 414 rooms
- 2875 rooms
- 6056 rooms
- 6747 rooms
- 5048 rooms
- 3969+ rooms

- Rooms in renter-occupied apartments in East Riverdale, Maryland
- 1651 room
- 1252 rooms
- 1723 rooms
- 7154 rooms
- 5075 rooms
- 2076 rooms
- 1647 rooms
- 768 rooms
- 709+ rooms


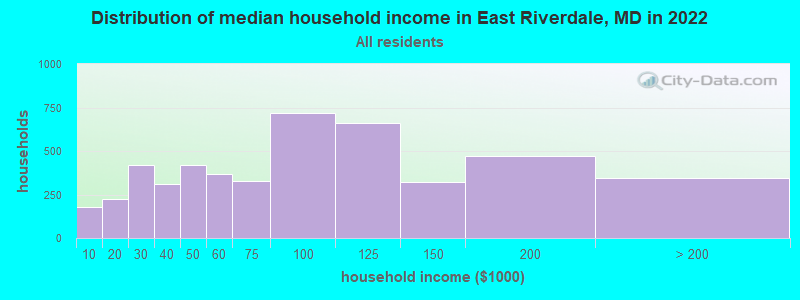
East Riverdale, MD household income distribution

- 181Less than $10,000
- 226$10,000 to $19,999
- 418$20,000 to $29,999
- 311$30,000 to $39,999
- 419$40,000 to $49,999
- 365$50,000 to $59,999
- 326$60,000 to $74,999
- 717$75,000 to $99,999
- 660$100,000 to $124,999
- 321$125,000 to $149,999
- 474$150,000 to $199,999
- 346$200,000 or more
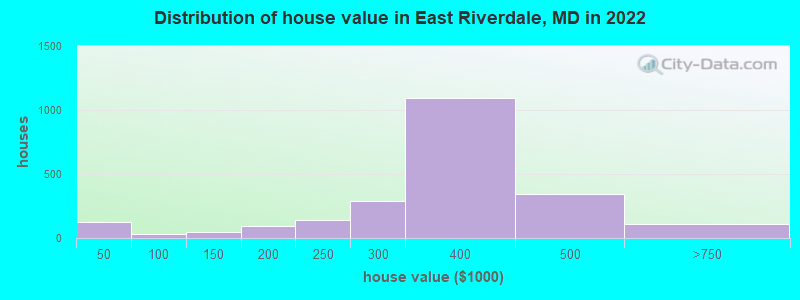
Home value of owner - occupied houses in 2022 in East Riverdale, MD
-
- 54Less than $10,000
- 4$20,000 to $24,999
- 27$30,000 to $34,999
- 16$35,000 to $39,999
- 23$40,000 to $49,999
- 6$60,000 to $69,999
- 24$100,000 to $124,999
- 18$125,000 to $149,999
- 53$150,000 to $174,999
- 40$175,000 to $199,999
- 142$200,000 to $249,999
- 286$250,000 to $299,999
- 1,093$300,000 to $399,999
- 342$400,000 to $499,999
- 106$500,000 to $749,999
Rent paid by renters in 2022 in East Riverdale, MD
-
- 33$300 to $349
- 28$500 to $549
- 58$650 to $699
- 41$800 to $899
- 137$900 to $999
- 588$1,000 to $1,249
- 540$1,250 to $1,499
- 581$1,500 to $1,999
- 206$2,000 to $2,499
- 9$3,000 to $3,499
- 148No cash rent


Percentage of workers working in this county: 57.2%
Number of people working at home: 585 (7.0% of all workers)
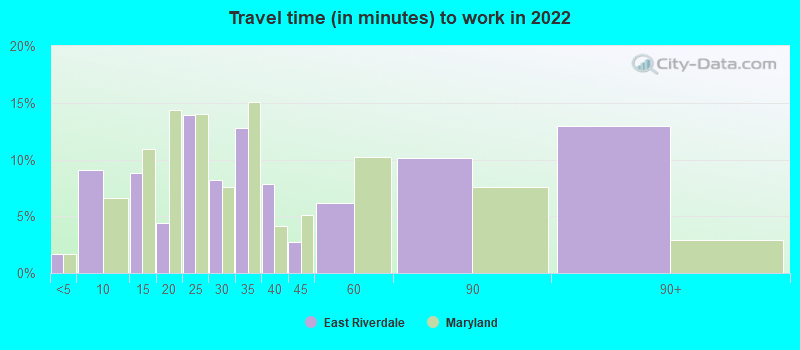
Travel time to work (commute)
- Less than 5 minutes: 74
- 5 to 9 minutes: 130
- 10 to 14 minutes: 610
- 15 to 19 minutes: 808
- 20 to 24 minutes: 1,223
- 25 to 29 minutes: 269
- 30 to 34 minutes: 1,399
- 35 to 39 minutes: 520
- 40 to 44 minutes: 544
- 45 to 59 minutes: 698
- 60 to 89 minutes: 851
- 90 or more minutes: 280
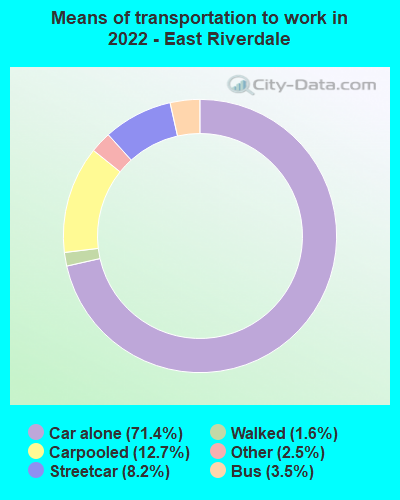
Means of transportation to work:
- Drove a car alone: 680 (46.9%)
- Carpooled: 109 (7.5%)
- Bus: 23 (1.6%)
- Subway or elevated rail: 54 (3.7%)
- Taxi: 30 (2.1%)
- Walked: 15 (1.0%)
- Worked at home: 585 (40.3%)

- Unemployment by race in 2022
- Unemployment rate for White non-Hispanic residents
- 2.3%Males
- Unemployment rate for Black residents
- 5.8%Males
- 5.1%Females
- Unemployment rate for American Indian and Alaska Native residents
- 22.8%Males
- Unemployment rate for Asian residents
- 30.8%Males
- 22.2%Females
- Unemployment rate for other race residents
- 1.9%Males
- 8.8%Females
- Unemployment rate for two or more race residents
- 17.3%Males
- 4.7%Females
- Unemployment rate for Hispanic or Latino residents
- 3.7%Males
- 8.7%Females

- Year of entry for the foreign-born population in East Riverdale, Maryland
- 5,1912010 or later
- 2,6342000 to 2009
- 1,4791990 to 1999
- 1,6211980 to 1989
- 3301970 to 1979
- 222Before 1970

First ancestries reported:
- Afghan: 662 (4.7%)
- Nigerian: 445 (3.2%)
- African: 304 (2.2%)
- Guyanese: 192 (1.4%)
- Jamaican: 140 (1.0%)
- American: 123 (0.9%)
- West Indian: 113 (0.8%)
- English: 78 (0.6%)
- Irish: 61 (0.4%)
- Slavic: 61 (0.4%)
- Australian: 60 (0.4%)
- German: 56 (0.4%)
- Italian: 33 (0.2%)
- Swedish: 28 (0.2%)
- Ethiopian: 16 (0.1%)
- Iraqi: 13 (0.09%)
- Scottish: 13 (0.09%)
- Polish: 12 (0.09%)
- Greek: 11 (0.08%)
- Haitian: 11 (0.08%)
- Norwegian: 7 (0.05%)
- British: 4 (0.03%)
Most common places of birth for foreign-born residents (%):
| East Riverdale: | 37.7% (3,830) |
| Maryland: | 12.0% (115,412) |
| East Riverdale: | 20.5% (2,078) |
| Maryland: | 3.5% (34,065) |
| East Riverdale: | 7.2% (735) |
| Maryland: | 4.4% (42,350) |
| East Riverdale: | 7.1% (716) |
| Maryland: | 0.4% (3,905) |
| East Riverdale: | 5.8% (593) |
| Maryland: | 2.5% (24,026) |
| East Riverdale: | 3.0% (307) |
| Maryland: | 1.4% (13,947) |
| East Riverdale: | 2.5% (255) |
| Maryland: | 0.8% (8,109) |
| East Riverdale: | 2.3% (234) |
| Maryland: | 4.6% (44,825) |
| East Riverdale: | 2.2% (221) |
| Maryland: | 2.5% (23,969) |
| East Riverdale: | 1.7% (171) |
| Maryland: | 0.1% (920) |
Place of birth for U.S.-born residents:
- This state: 4,058
- Other state: 4,015
- Northeast: 355
- Midwest: 175
- South: 3,154
- West: 307
89.5% of East Riverdale residents lived in the same house 1 years ago.
Out of people who lived in different houses, 35.0% lived in this county.
Out of people who lived in different counties, 51.5% lived in Maryland.
| East Riverdale: | 89.5% |
| State average: | 88.5% |
Education attainment for males 25 years and older:
- No schooling: 528
- Nursery to 4th grade: 351
- 5th and 6th grade: 234
- 7th and 8th grade: 223
- 9th grade: 323
- 10th grade: 186
- 11th grade: 41
- 12th grade, no diploma: 293
- High school graduate (or equivalency): 1,535
- Less than 1 year of college: 210
- Some college more than 1 year, no degree: 576
- Associate degree: 277
- Bachelor's degree: 592
- Master's degree: 184
- Professional school degree: 33
- Doctorate degree: 3

Education attainment for females 25 years and older:
- No schooling: 481
- Nursery to 4th grade: 290
- 5th and 6th grade: 278
- 7th and 8th grade: 78
- 9th grade: 108
- 10th grade: 67
- 11th grade: 90
- 12th grade, no diploma: 188
- High school graduate (or equivalency): 1,350
- Less than 1 year of college: 215
- Some college more than 1 year, no degree: 458
- Associate degree: 258
- Bachelor's degree: 521
- Master's degree: 295
- Professional school degree: 32
- Doctorate degree: 0


Housing units in structures:
- One, detached: 2,733
- One, attached: 380
- Two: 53
- 3 or 4: 447
- 5 to 9: 935
- 10 to 19: 138
- 20 to 49: 79
- 50 or more: 16
- Mobile homes: 51
- Boats, RVs, vans, etc.: 9
Housing units lacking complete kitchen facilities in 2022: 0.2%
House/condo owner moved in on average 12 years ago
Renter moved in on average 3 years ago

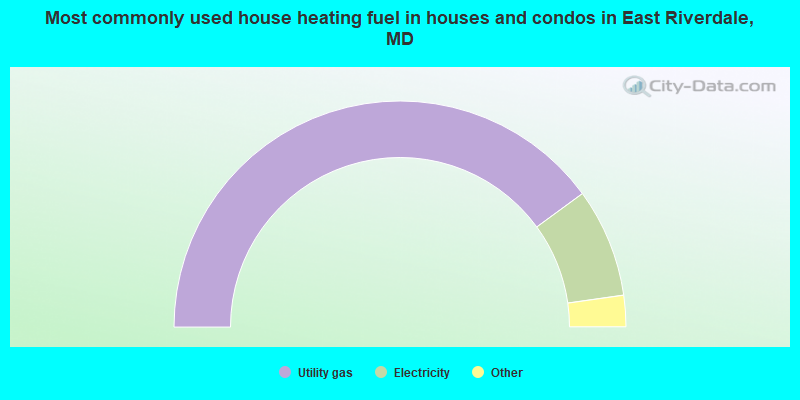
- 79.9%Utility gas
- 15.6%Electricity
- 2.6%Fuel oil, kerosene, etc.
- 1.9%Bottled, tank, or LP gas
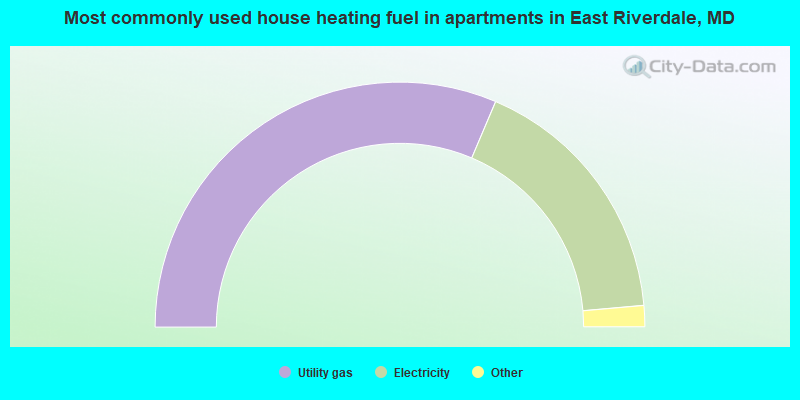
- 62.8%Utility gas
- 34.4%Electricity
- 1.1%Other fuel
- 0.8%Fuel oil, kerosene, etc.
- 0.6%Bottled, tank, or LP gas
- 0.2%No fuel used
Private vs. public school enrollment:
| Here: | 3.1% |
| Maryland: | 15.2% |
| Here: | 4.4% |
| Maryland: | 14.4% |
| Here: | 16.8% |
| Maryland: | 20.2% |


