East Islip, NY (New York) Houses and Residents
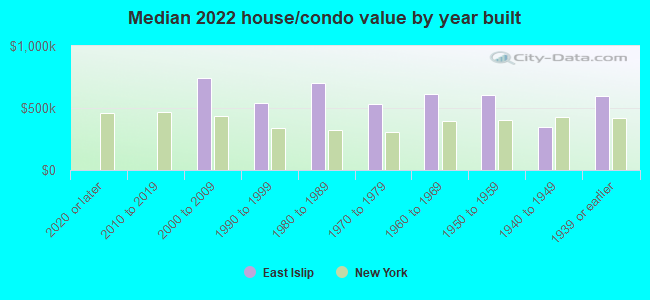
Estimated median house or condo value in 2022: $600,848 (it was $189,200 in 2000 )
East Islip:
$600,848New York:
$400,400
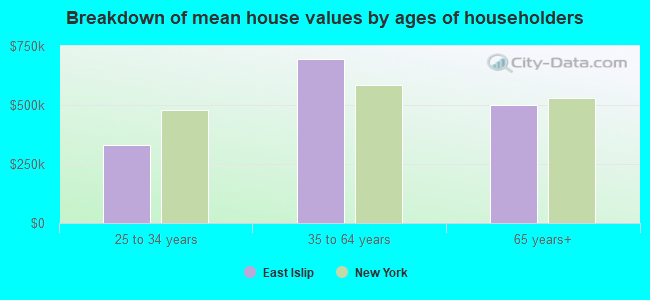
Lower value quartile - upper value quartile: $471,227 - $693,167Mean price in 2022: Detached houses: $664,698 Here:
$664,698State:
$476,719
Townhouses or other attached units: $530,924 Here:
$530,924State:
$699,270
In 2-unit structures: $327,891 Here:
$327,891State:
$713,077
In 5-or-more-unit structures: $310,040 Here:
$310,040State:
$912,009
Total population: 14,475 (Urban population: 14,084, Rural population: 0)
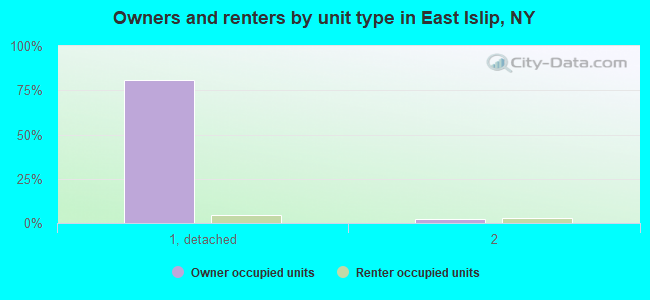
Houses: 4,896 (4,776 occupied: 4,190 owner occupied, 584 renter occupied )
% of renters here:
12%State:
46%
Housing density: 1,192 houses/condos per square mile
Median price asked for vacant for-sale houses and condos in 2022 in this county: $940,353.
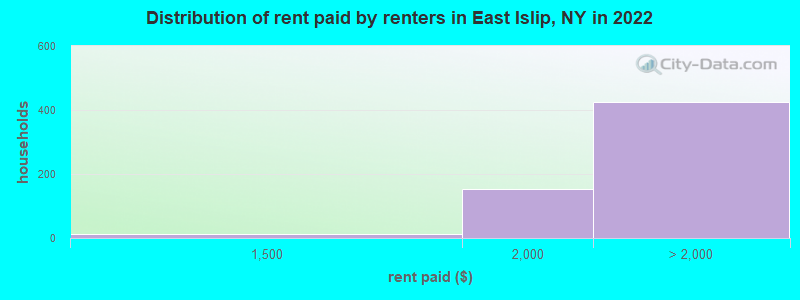
Median contract rent in 2022: over $2,000 (lower quartile is $1,724, upper quartile is over $2,000)
Median rent asked for vacant for-rent units in 2022: $2,227
Median gross rent in East Islip, NY in 2022: over $2,000
Housing units in East Islip with a mortgage: 2,863 (315 second mortgage, 0 home equity loan, 300 both second mortgage and home equity loan )Houses without a mortgage: 72
Median household income for houses/condos with a mortgage: $159,223
Median household income for apartments without a mortgage: $78,457
Median monthly housing costs: $2,671
Data:
Median house or condo value ($)
Median house or condo value ($ change since 2000)
Median house or condo value ($) - White
Median house or condo value ($) - Black or African American
Median house or condo value ($) - Asian
Median house or condo value ($) - Hispanic or Latino
Median house or condo value ($) - American Indian and Alaska Native
Median house or condo value ($) - Multirace
Median house or condo value ($) - Other Race
Median price asked for mobile homes ($)
Household density (households per square mile)
Mean house or condo value by units in structure - 1, detached ($)
Mean house or condo value by units in structure - 1, attached ($)
Mean house or condo value by units in structure - 2 ($)
Mean house or condo value by units in structure by units in structure - 3 or 4 ($)
Mean house or condo value by units in structure - 5 or more ($)
Mean house or condo value by units in structure - Boat, RV, van, etc. ($)
Mean house or condo value by units in structure - Mobile home ($)
Median contract rent ($)
Median contract rent - Lower quartile ($)
Median contract rent - Upper quartile ($)
Median gross rent ($)
Urban houses (%)
Rural houses (%)
Houses occupied (%)
Houses occupied (% change since 2000)
Houses owner occupied (%)
Houses owner occupied (% change since 2000)
Houses renter occupied (%)
Houses renter occupied (% change since 2000)
Vacant housing units - For rent (%)
Vacant housing units - For rent (% change since 2000)
Vacant housing units - For sale only (%)
Vacant housing units - For sale only (% change since 2000)
Vacant housing units - Rented or sold, not occupied (%)
Vacant housing units - Rented or sold, not occupied (% change since 2000)
Vacant housing units - For seasonal, recreational, or occasional use (%)
Vacant housing units - For seasonal, recreational, or occasional use (% change since 2000)
Vacant housing units - For migrant workers (%)
Vacant housing units - For migrant workers (% change since 2000)
Vacant housing units - Other vacant (%)
Vacant housing units - Other vacant (% change since 2000)
Median monthly housing costs ($)
Median household income for houses/condos with a mortgage ($)
Median household income for houses/condos without a mortgage ($)
Median household income ($)
Median household income ($) - White
Median household income ($) - Black or African American
Median household income ($) - Asian
Median household income ($) - Hispanic or Latino
Median household income ($) - American Indian and Alaska Native
Median household income ($) - Multirace
Median household income ($) - Other Race
Mortgage status - with mortgage (%)
Mortgage status - with second mortgage (%)
Mortgage status - with home equity loan (%)
Mortgage status - with both second mortgage and home equity loan (%)
Mortgage status - without a mortgage (%)
Median year house/condo built
Median year apartment built
Household type by relationship - Male householder living alone (%)
Household type by relationship - Male householder not living alone (%)
Household type by relationship - Female householder living alone (%)
Household type by relationship - Female householder not living alone (%)
Household type by relationship - Opposite-Sex spouse (%)
Household type by relationship - Same-Sex spouse (%)
Household type by relationship - Opposite-Sex unmarried partner (%)
Household type by relationship - Same-Sex unmarried partner (%)
Household type by relationship - In group quarters (%)
Size of family households - 2-person household (%)
Size of family households - 3-person household (%)
Size of family households - 4-person household (%)
Size of family households - 5-person household (%)
Size of family households - 6-person household (%)
Size of family households - 7-or-more-person household (%)
Size of nonfamily households - 1-person household (%)
Size of nonfamily households - 2-person household (%)
Size of nonfamily households - 3-person household (%)
Size of nonfamily households - 4-person household (%)
Size of nonfamily households - 5-person household (%)
Size of nonfamily households - 6-person household (%)
Size of nonfamily households - 7-or-moreperson household (%)
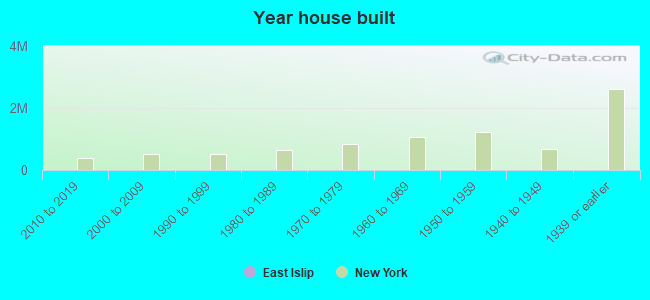
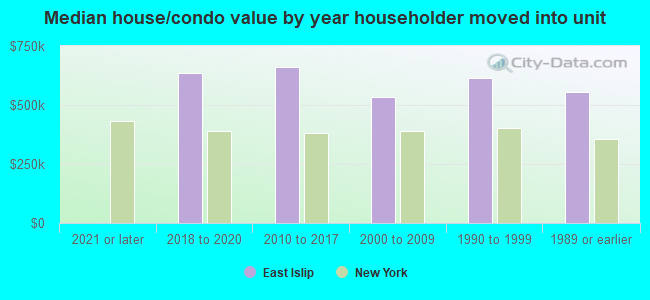
Year house built - Built 2010 or later (%)
Year house built - Built 2000 to 2009 (%)
Year house built - Built 1990 to 1999 (%)
Year house built - Built 1980 to 1989 (%)
Year house built - Built 1970 to 1979 (%)
Year house built - Built 1960 to 1969 (%)
Year house built - Built 1950 to 1959 (%)
Year house built - Built 1940 to 1949 (%)
Year house built - Built 1939 or earlier (%)
Median number of rooms in houses and condos
Median number of rooms in apartments
Median number of bedrooms in owner occupied houses
Mean number of bedrooms in owner occupied houses
Median number of bedrooms in renter occupied houses
Mean number of bedrooms in renter occupied houses
Median number of vehichles in owner occupied houses
Mean number of vehichles in owner occupied houses
Median number of vehichles in renter occupied houses
Mean number of vehichles in renter occupied houses
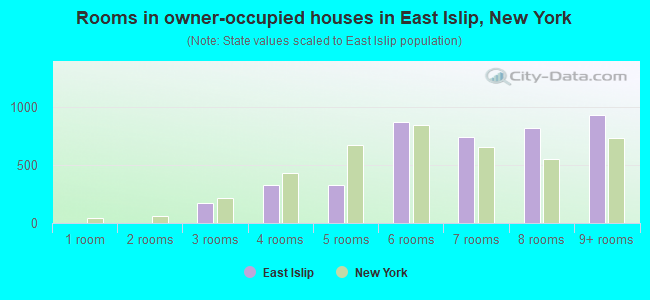
Rooms in owner-occupied houses - 1 room (%)
Rooms in owner-occupied houses - 2 rooms (%)
Rooms in owner-occupied houses - 3 rooms (%)
Rooms in owner-occupied houses - 4 rooms (%)
Rooms in owner-occupied houses - 5 rooms (%)
Rooms in owner-occupied houses - 6 rooms (%)
Rooms in owner-occupied houses - 7 rooms (%)
Rooms in owner-occupied houses - 8 rooms (%)
Rooms in owner-occupied houses - 9+ rooms (%)
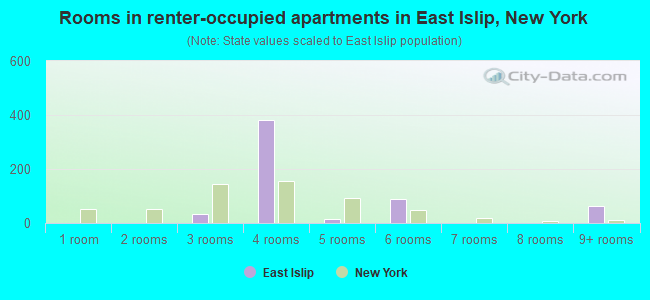
Rooms in renter-occupied houses - 1 room (%)
Rooms in renter-occupied houses - 2 rooms (%)
Rooms in renter-occupied houses - 3 rooms (%)
Rooms in renter-occupied houses - 4 rooms (%)
Rooms in renter-occupied houses - 5 rooms (%)
Rooms in renter-occupied houses - 6 rooms (%)
Rooms in renter-occupied houses - 7 rooms (%)
Rooms in renter-occupied houses - 8 rooms (%)
Rooms in renter-occupied houses - 9+ rooms (%)
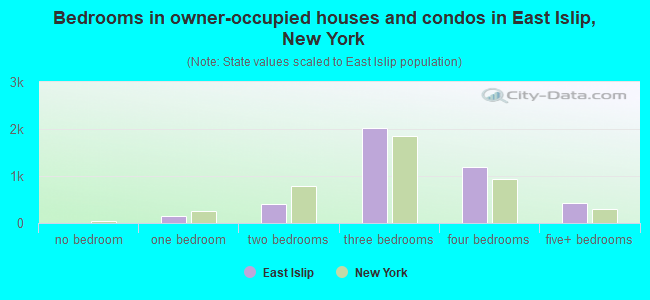
Bedrooms in owner-occupied houses - no bedrooms (%)
Bedrooms in owner-occupied houses - 1 bedroom (%)
Bedrooms in owner-occupied houses - 2 bedrooms (%)
Bedrooms in owner-occupied houses - 3 bedrooms (%)
Bedrooms in owner-occupied houses - 4 bedrooms (%)
Bedrooms in owner-occupied houses - 5+ bedrooms (%)
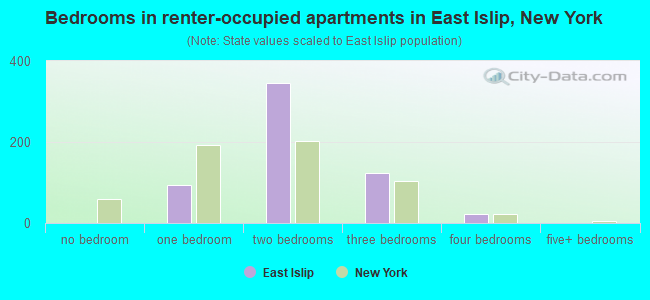
Bedrooms in renter-occupied houses - no bedrooms (%)
Bedrooms in renter-occupied houses - 1 bedroom (%)
Bedrooms in renter-occupied houses - 2 bedrooms (%)
Bedrooms in renter-occupied houses - 3 bedrooms (%)
Bedrooms in renter-occupied houses - 4 bedrooms (%)
Bedrooms in renter-occupied houses - 5+ bedrooms (%)
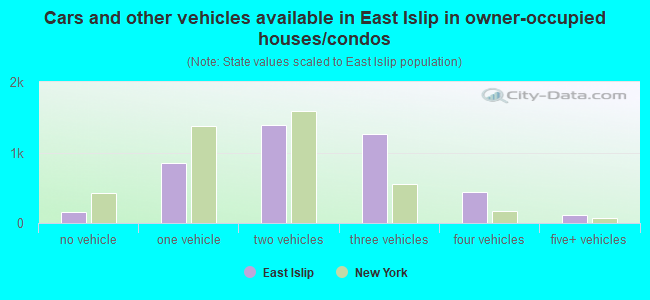
Vehicles available in owner-occupied houses - no vehicle available (%)
Vehicles available in owner-occupied houses - 1 vehicle available(%)
Vehicles available in owner-occupied houses - 2 Vehicles available (%)
Vehicles available in owner-occupied houses - 3 Vehicles available (%)
Vehicles available in owner-occupied houses - 4 Vehicles available (%)
Vehicles available in owner-occupied houses - 5+ Vehicles available (%)
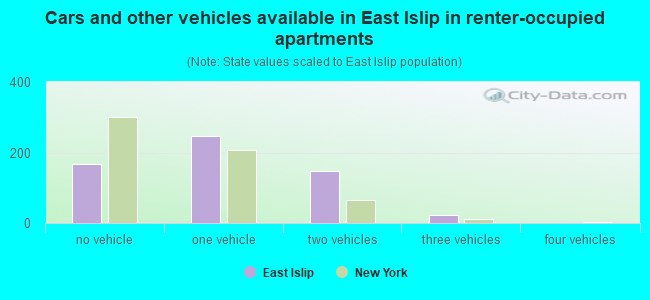
Vehicles available in renter-occupied houses - no vehicle available (%)
Vehicles available in renter-occupied houses - 1 vehicle available (%)
Vehicles available in renter-occupied houses - 2 Vehicles available (%)
Vehicles available in renter-occupied houses - 3 Vehicles available (%)
Vehicles available in renter-occupied houses - 4 Vehicles available (%)
Vehicles available in renter-occupied houses - 5+ Vehicles available (%)
Housing units in structures - 1, detached (%)
Housing units in structures - 1, attached (%)
Housing units in structures - 2 (%)
Housing units in structures - 3 or 4 (%)
Housing units in structures - 5 to 9 (%)
Housing units in structures - 10 to 19 (%)
Housing units in structures - 20 to 49 (%)
Housing units in structures - 50 or more (%)
Housing units in structures - Mobile home (%)
Housing units in structures - Boat, RV, van, etc. (%)
Housing units in structures - Owners - 1, detached (%)
Housing units in structures - Owners - 1, attached (%)
Housing units in structures - Owners - 2 (%)
Housing units in structures - Owners - 3 or 4 (%)
Housing units in structures - Owners - 5 to 9 (%)
Housing units in structures - Owners - 10 to 19 (%)
Housing units in structures - Owners - 20 to 49 (%)
Housing units in structures - Owners - 50 or more (%)
Housing units in structures - Owners - Mobile home (%)
Housing units in structures - Owners - Boat, RV, van, etc. (%)
Housing units in structures - Renters - 1, detached (%)
Housing units in structures - Renters - 1, attached (%)
Housing units in structures - Renters - 2 (%)
Housing units in structures - Renters - 3 or 4 (%)
Housing units in structures - Renters - 5 to 9 (%)
Housing units in structures - Renters - 10 to 19 (%)
Housing units in structures - Renters - 20 to 49 (%)
Housing units in structures - Renters - 50 or more (%)
Housing units in structures - Renters - Mobile home (%)
Housing units in structures - Renters - Boat, RV, van, etc. (%)
House/condo owner moved in on average (years ago)
Renter moved in on average (years ago)
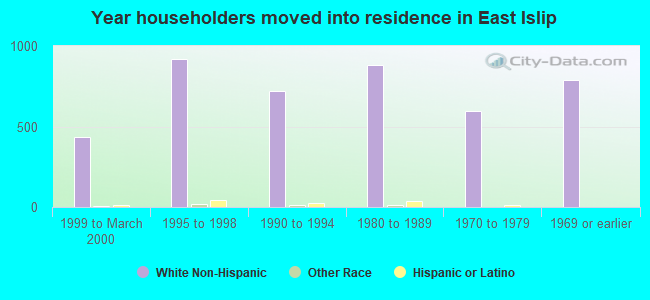
Year householder moved into unit - Moved in 1999 to March 2000 (%)
Year householder moved into unit - Moved in 1999 to March 2000 (%) - White
Year householder moved into unit - Moved in 1999 to March 2000 (%) - Black or African American
Year householder moved into unit - Moved in 1999 to March 2000 (%) - Asian
Year householder moved into unit - Moved in 1999 to March 2000 (%) - Hispanic or Latino
Year householder moved into unit - Moved in 1999 to March 2000 (%) - American Indian and Alaska Native
Year householder moved into unit - Moved in 1999 to March 2000 (%) - Multirace
Year householder moved into unit - Moved in 1999 to March 2000 (%) - Other Race
Year householder moved into unit - Moved in 1995 to 1998 (%)
Year householder moved into unit - Moved in 1995 to 1998 (%) - White
Year householder moved into unit - Moved in 1995 to 1998 (%) - Black or African American
Year householder moved into unit - Moved in 1995 to 1998 (%) - Asian
Year householder moved into unit - Moved in 1995 to 1998 (%) - Hispanic or Latino
Year householder moved into unit - Moved in 1995 to 1998 (%) - American Indian and Alaska Native
Year householder moved into unit - Moved in 1995 to 1998 (%) - Multirace
Year householder moved into unit - Moved in 1995 to 1998 (%) - Other Race
Year householder moved into unit - Moved in 1990 to 1994 (%)
Year householder moved into unit - Moved in 1990 to 1994 (%) - White
Year householder moved into unit - Moved in 1990 to 1994 (%) - Black or African American
Year householder moved into unit - Moved in 1990 to 1994 (%) - Asian
Year householder moved into unit - Moved in 1990 to 1994 (%) - Hispanic or Latino
Year householder moved into unit - Moved in 1990 to 1994 (%) - American Indian and Alaska Native
Year householder moved into unit - Moved in 1990 to 1994 (%) - Multirace
Year householder moved into unit - Moved in 1990 to 1994 (%) - Other Race
Year householder moved into unit - Moved in 1980 to 1989 (%)
Year householder moved into unit - Moved in 1980 to 1989 (%) - White
Year householder moved into unit - Moved in 1980 to 1989 (%) - Black or African American
Year householder moved into unit - Moved in 1980 to 1989 (%) - Asian
Year householder moved into unit - Moved in 1980 to 1989 (%) - Hispanic or Latino
Year householder moved into unit - Moved in 1980 to 1989 (%) - American Indian and Alaska Native
Year householder moved into unit - Moved in 1980 to 1989 (%) - Multirace
Year householder moved into unit - Moved in 1980 to 1989 (%) - Other Race
Year householder moved into unit - Moved in 1970 to 1979 (%)
Year householder moved into unit - Moved in 1970 to 1979 (%) - White
Year householder moved into unit - Moved in 1970 to 1979 (%) - Black or African American
Year householder moved into unit - Moved in 1970 to 1979 (%) - Asian
Year householder moved into unit - Moved in 1970 to 1979 (%) - Hispanic or Latino
Year householder moved into unit - Moved in 1970 to 1979 (%) - American Indian and Alaska Native
Year householder moved into unit - Moved in 1970 to 1979 (%) - Multirace
Year householder moved into unit - Moved in 1970 to 1979 (%) - Other Race
Year householder moved into unit - Moved in 1969 or earlier (%)
Year householder moved into unit - Moved in 1969 or earlier (%) - White
Year householder moved into unit - Moved in 1969 or earlier (%) - Black or African American
Year householder moved into unit - Moved in 1969 or earlier (%) - Asian
Year householder moved into unit - Moved in 1969 or earlier (%) - Hispanic or Latino
Year householder moved into unit - Moved in 1969 or earlier (%) - American Indian and Alaska Native
Year householder moved into unit - Moved in 1969 or earlier (%) - Multirace
Year householder moved into unit - Moved in 1969 or earlier (%) - Other Race
Housing units lacking complete plumbing facilities (%)
Housing units lacking complete kitchen facilities (%)
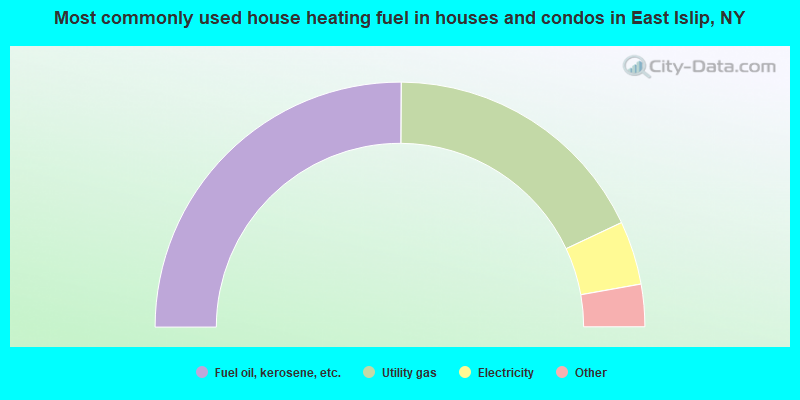
House heating fuel used in houses and condos - Utility gas (%)
House heating fuel used in houses and condos - Bottled, tank, or LP gas (%)
House heating fuel used in houses and condos - Electricity (%)
House heating fuel used in houses and condos - Fuel oil, kerosene, etc. (%)
House heating fuel used in houses and condos - Coal or coke (%)
House heating fuel used in houses and condos - Wood (%)
House heating fuel used in houses and condos - Solar energy (%)
House heating fuel used in houses and condos - Other fuel (%)
House heating fuel used in houses and condos - No fuel used (%)
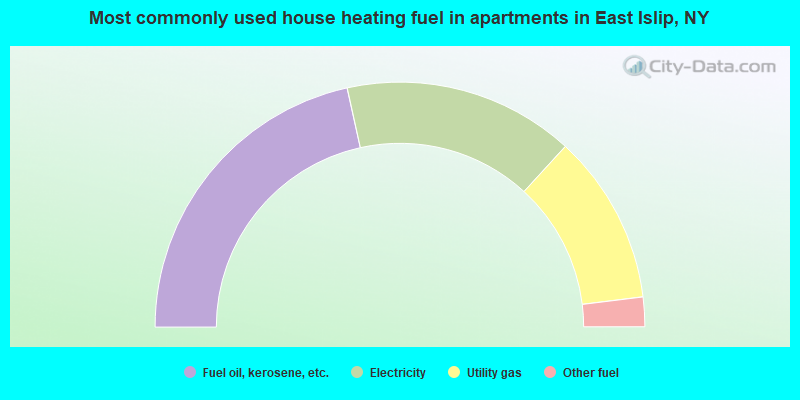
House heating fuel used in apartments - Utility gas (%)
House heating fuel used in apartments - Bottled, tank, or LP gas (%)
House heating fuel used in apartments - Electricity (%)
House heating fuel used in apartments - Fuel oil, kerosene, etc. (%)
House heating fuel used in apartments - Coal or coke (%)
House heating fuel used in apartments - Wood (%)
House heating fuel used in apartments - Solar energy (%)
House heating fuel used in apartments - Other fuel (%)
House heating fuel used in apartments - No fuel used (%)
Carjacking 11/17/22 at Starbucks in East Islip (20 replies)$100k salary in Farmingdale + nearby housing options (145 replies)Wyandanch Rising: Fancy New Apartments (84 replies)Searching for homes in LI (51 replies)Long Islanders who hate biden (261 replies)Homes in Bohemia, Oakdale, Sayville, Bayport, Islip, Bay Shore, Patchogue, Bellport, Medford, Mastic, Ridge, Kings Park (12 replies)
Median year house/condo built: 1958Median year apartment built: 1966Household type by relationship:
Households: 13,584
Male householders: 2,397 (491 living alone ), Female householders: 2,368 (720 living alone )2,620 spouses (2,606 opposite-sex spouses ), 307 unmarried partners , (307 opposite-sex unmarried partners ), 4,585 children (4,516 natural , 26 adopted , 43 stepchildren ), 186 grandchildren , 163 brothers or sisters , 287 parents , 0 foster children , 166 other relatives , 369 non-relatives In group quarters: 133
Size of family households: 1,144 2-persons , 724 3-persons , 902 4-persons , 393 5-persons , 77 6-persons , 33 7-or-more-persons .
Size of nonfamily households: 1,221 1-person , 257 2-persons , 6 3-persons .
2,052 married couples with children. single-parent households (207 men , 245 women ).
82.5% of residents of East Islip speak English at home. of residents speak Spanish at home (82% speak English very well , 15% speak English well , 3% speak English not well ).of residents speak other Indo-European language at home (56% speak English very well , 44% speak English well ).of residents speak Asian or Pacific Island language at home (89% speak English very well , 11% speak English well ).of residents speak other language at home (76% speak English very well , 16% speak English well , 7% speak English not well ).
Foreign born population: 1,182 (8.7%)of them are naturalized citizens )
Median number of rooms in houses and condos:
Median number of rooms in apartments
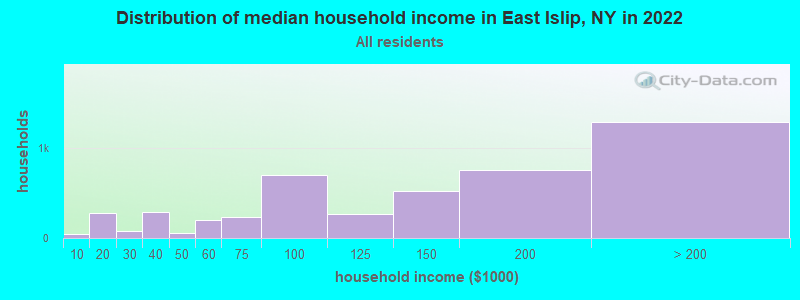
East Islip, NY household income distribution 50 Less than $10,000282 $10,000 to $19,99980 $20,000 to $29,999291 $30,000 to $39,99953 $40,000 to $49,999201 $50,000 to $59,999234 $60,000 to $74,999705 $75,000 to $99,999267 $100,000 to $124,999528 $125,000 to $149,999760 $150,000 to $199,9991,295 $200,000 or more
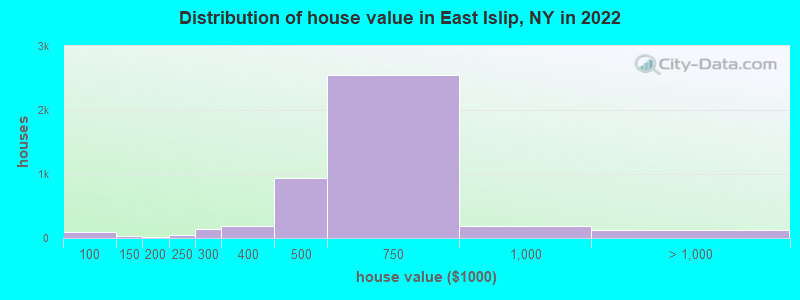
Home value of owner - occupied houses in 2022 in East Islip, NY 10 $40,000 to $49,99937 $50,000 to $59,99949 $60,000 to $69,99929 $125,000 to $149,99915 $175,000 to $199,99947 $200,000 to $249,999133 $250,000 to $299,999182 $300,000 to $399,999945 $400,000 to $499,9992,552 $500,000 to $749,999193 $750,000 to $999,99979 $1,000,000 to $1,499,99942 $1,500,000 to $1,999,9998 $2,000,000 or moreRent paid by renters in 2022 in East Islip, NY 11 $1,250 to $1,499154 $1,500 to $1,999181 $2,000 to $2,499202 $2,500 to $2,99917 $3,000 to $3,49921 No cash rent
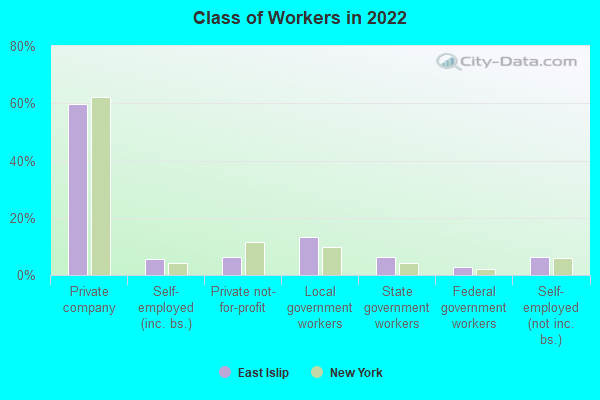
Percentage of workers working in this county: 79.1%Number of people working at home: 771 (11.3% of all workers )
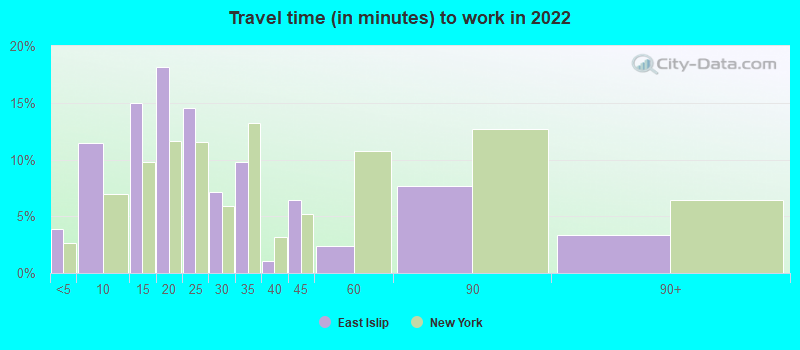
Travel time to work (commute)
Less than 5 minutes: 2245 to 9 minutes: 43810 to 14 minutes: 77615 to 19 minutes: 1,12520 to 24 minutes: 76225 to 29 minutes: 30430 to 34 minutes: 65435 to 39 minutes: 10640 to 44 minutes: 29945 to 59 minutes: 60160 to 89 minutes: 36590 or more minutes: 358
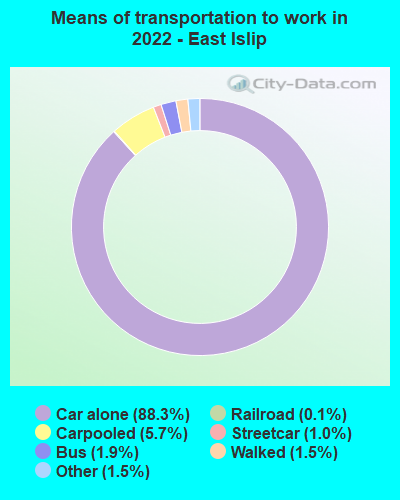
Means of transportation to work:
Drove a car alone: 2,875 (71.4%)Carpooled: 211 (5.2%)Bus : 57 (1.4%)Subway or elevated rail : 33 (0.8%)Light rail, streetcar or trolley : 5 (0.1%)Taxi: 60 (1.5%)Walked: 51 (1.3%)Worked at home: 771 (19.1%)
Unemployment by race in 2022
Unemployment rate for White non-Hispanic residents 2.3% Males0.2% FemalesUnemployment rate for Black residents 15.3% MalesUnemployment rate for two or more race residents 43.1% FemalesUnemployment rate for Hispanic or Latino residents 5.4% Males8.9% Females
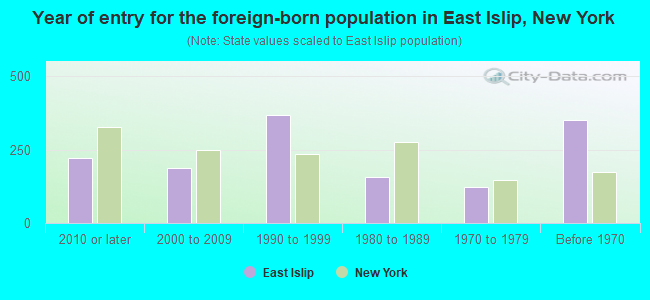
Year of entry for the foreign-born population in East Islip, New York
221 2010 or later 189 2000 to 2009 369 1990 to 1999 157 1980 to 1989 123 1970 to 1979 352 Before 1970
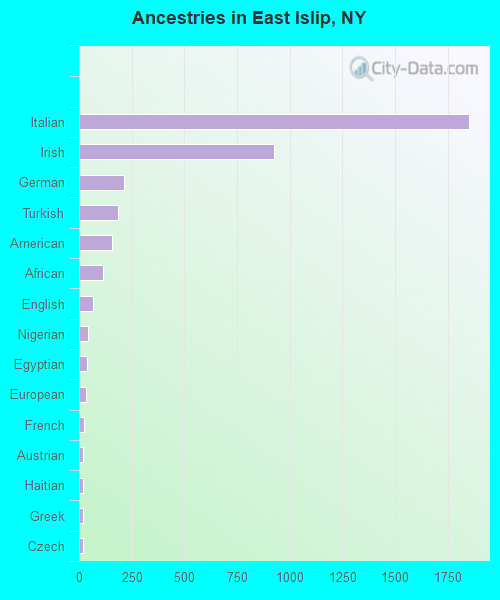
First ancestries reported:
Italian: 1,854 (35.7%)
Irish: 924 (17.8%)
German: 216 (4.2%)
Turkish: 185 (3.6%)
American: 159 (3.1%)
African: 113 (2.2%)
English: 66 (1.3%)
Nigerian: 42 (0.8%)
Egyptian: 40 (0.8%)
European: 33 (0.6%)
French: 22 (0.4%)
Austrian: 19 (0.4%)
Haitian: 19 (0.4%)
Greek: 18 (0.3%)
Czech: 17 (0.3%)
Russian: 14 (0.3%)
Hungarian: 13 (0.3%)
Polish: 13 (0.3%)
French Canadian: 11 (0.2%)
Ukrainian: 9 (0.2%)
Scandinavian: 8 (0.2%)
Croatian: 2 (0.04%)
Slovak: 1 (0.02%) Most common places of birth for foreign-born residents (%): Ecuador East Islip:
23.4% (255)New York:
3.9% (177,448)
Turkey East Islip:
15.9% (173)New York:
0.5% (21,009)
Colombia East Islip:
14.7% (160)New York:
2.5% (111,920)
China, excluding Hong Kong and Taiwan East Islip:
7.2% (78)New York:
9.1% (410,910)
Egypt East Islip:
6.6% (72)New York:
0.6% (27,385)
Nigeria East Islip:
6.2% (68)New York:
0.7% (33,746)
Peru East Islip:
4.7% (51)New York:
1.2% (54,759)
Cuba East Islip:
3.9% (42)New York:
0.5% (23,242)
Argentina East Islip:
3.8% (41)New York:
0.5% (21,928)
Italy East Islip:
2.8% (30)New York:
1.8% (81,374)
Mexico East Islip:
2.4% (26)New York:
4.8% (214,559)
Germany East Islip:
2.1% (23)New York:
0.9% (38,713)
Honduras East Islip:
2.1% (23)New York:
1.2% (55,571)
Place of birth for U.S.-born residents:
This state: 11,684Other state: 453Northeast: 145Midwest: 107South: 139West: 64 92.4% of East Islip residents lived in the same house 1 years ago.
Out of people who lived in different houses, 36.4% lived in this county.
Out of people who lived in different counties, 100.0% lived in New York.
East Islip:
92.4%State average:
89.6%
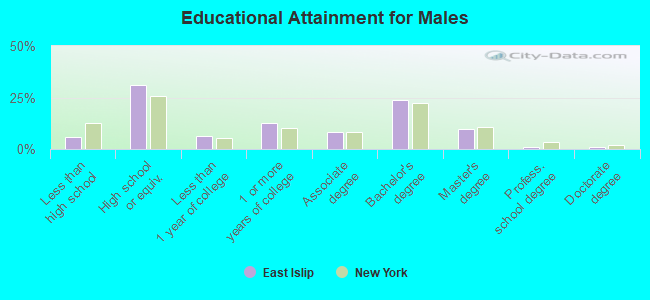
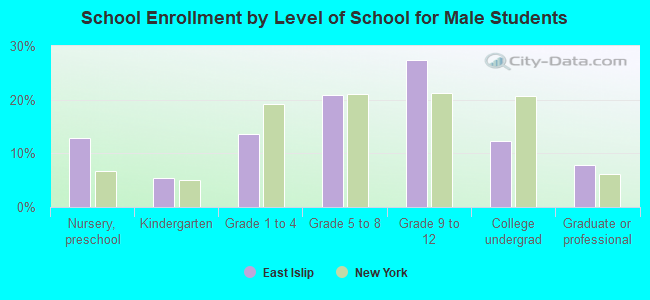
Education attainment for males 25 years and older:
No schooling: 143Nursery to 4th grade: 05th and 6th grade: 07th and 8th grade: 69th grade: 010th grade: 411th grade: 012th grade, no diploma: 143High school graduate (or equivalency): 1,523Less than 1 year of college: 301Some college more than 1 year, no degree: 624Associate degree: 411Bachelor's degree: 1,167Master's degree: 481Professional school degree: 39Doctorate degree: 41
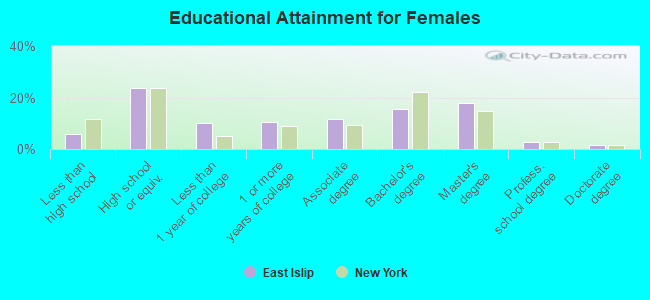
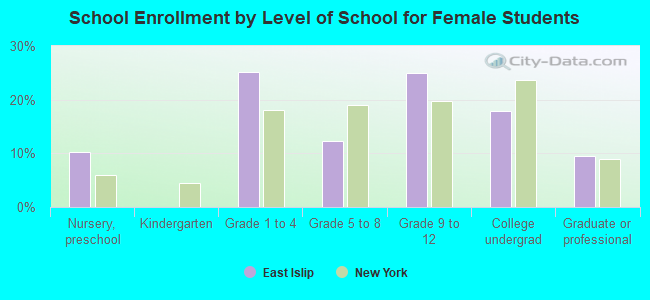
Education attainment for females 25 years and older:
No schooling: 4Nursery to 4th grade: 05th and 6th grade: 67th and 8th grade: 1149th grade: 1410th grade: 4811th grade: 7312th grade, no diploma: 36High school graduate (or equivalency): 1,173Less than 1 year of college: 503Some college more than 1 year, no degree: 516Associate degree: 577Bachelor's degree: 774Master's degree: 874Professional school degree: 133Doctorate degree: 81
Housing units in structures:
One, detached: 4,129One, attached: 32Two: 2003 or 4: 135 to 9: 10510 to 19: 7520 to 49: 2050 or more: 319Housing units lacking complete plumbing facilities in 2022: 1.6%Housing units lacking complete kitchen facilities in 2022: 1.6%House/condo owner moved in on average 19 years ago
Renter moved in on average 6 years ago
Private vs. public school enrollment:
Students in private schools in grades 1 to 8 (elementary and middle school): 140 Students in private schools in grades 9 to 12 (high school): 52 Students in private undergraduate colleges: 179