Median price asked for vacant for-sale houses and condos in 2022 in this county: $431,754.
Median contract rent in 2022: $1,217 (lower quartile is $1,039, upper quartile is $1,542)
Median gross rent in East Haddam, CT in 2022: $1,352
Housing units in East Haddam with a mortgage: 1,781 (205 second mortgage, 290 home equity loan, 16 both second mortgage and home equity loan) Houses without a mortgage: 547
Compare current foreclosures near East Haddam, CT:
In family households: 131,621 (30,370 male householders, 13,373 female householders)
34,891 spouses, 44,052 children (41,443 natural, 1,059 adopted, 1,550 stepchildren), 1,876 grandchildren, 1,018 brothers or sisters, 1,359 parents, foster children, 1,032 other relatives, 2,795 non-relatives
In nonfamily households: 28,970 (10,508 male householders (8,006 living alone)), 12,951 female householders (10,912 living alone)), 5,511 nonrelatives
In group quarters: 5,085 (1,881 institutionalized population)
26,910 married couples with children.
6,210 single-parent households (1,312 men, 4,898 women).
94.2% of residents of East Haddam speak English at home.
0.8% of residents speak Spanish at home (100% speak English very well).
5.0% of residents speak other Indo-European language at home (70% speak English very well, 28% speak English well, 3% speak English not well).
Foreign born population: 359 (3.6%)
(88.3% of them are naturalized citizens)
Year of entry for the foreign-born population in East Haddam, Connecticut
01995 to March 2000
141990 to 1994
01985 to 1989
301980 to 1984
91975 to 1979
181970 to 1974
141965 to 1969
133Before 1965
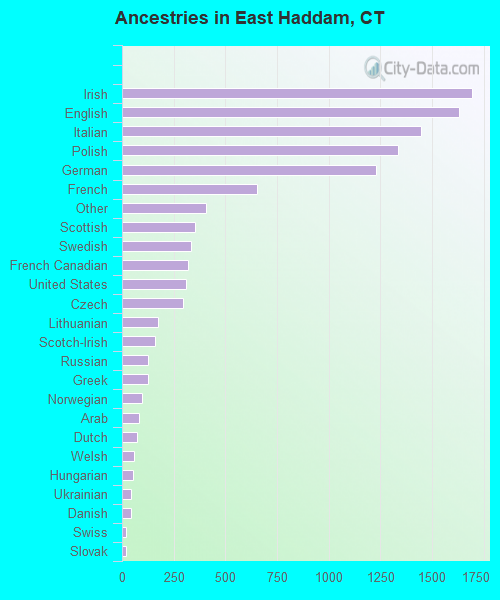
First ancestries reported:
Irish: 1,692 (15.2%)
English: 1,632 (14.7%)
Italian: 1,446 (13.0%)
Polish: 1,336 (12.0%)
German: 1,232 (11.1%)
French: 655 (5.9%)
Other: 407 (3.7%)
Scottish: 353 (3.2%)
Swedish: 334 (3.0%)
French Canadian: 320 (2.9%)
United States: 309 (2.8%)
Czech: 293 (2.6%)
Lithuanian: 172 (1.5%)
Scotch-Irish: 162 (1.5%)
Russian: 127 (1.1%)
Greek: 126 (1.1%)
Norwegian: 97 (0.9%)
Arab: 84 (0.8%)
Dutch: 73 (0.7%)
Welsh: 57 (0.5%)
Hungarian: 52 (0.5%)
Ukrainian: 45 (0.4%)
Danish: 43 (0.4%)
Swiss: 21 (0.2%)
Slovak: 19 (0.2%)
Portuguese: 9 (0.08%)
West Indian: 8 (0.07%)
Most common places of birth for foreign-born residents (%):
United Kingdom
East Haddam:
23.9% (52)
Connecticut:
4.4% (16,395)
Canada
East Haddam:
15.6% (34)
Connecticut:
5.2% (19,083)
Italy
East Haddam:
14.2% (31)
Connecticut:
7.0% (26,023)
Poland
East Haddam:
10.6% (23)
Connecticut:
6.9% (25,507)
Netherlands
East Haddam:
8.3% (18)
Connecticut:
0.4% (1,303)
Other Northern America
East Haddam:
6.4% (14)
Connecticut:
0.0% (178)
Sweden
East Haddam:
5.0% (11)
Connecticut:
0.4% (1,374)
Germany
East Haddam:
4.6% (10)
Connecticut:
3.1% (11,432)
Czechoslovakia (includes Czech Republic and Slovakia)
East Haddam:
4.1% (9)
Connecticut:
0.5% (1,693)
Russia
East Haddam:
4.1% (9)
Connecticut:
1.4% (5,021)
Greece
East Haddam:
3.2% (7)
Connecticut:
1.2% (4,622)
Place of birth for U.S.-born residents:
This state: 5,468
Other state: 2,554
Northeast: 1,665
Midwest: 322
South: 448
West: 119
60% of East Haddam residents lived in the same house 5 years ago. Out of people who lived in different houses, 46% lived in this county. Out of people who lived in different counties, 63% lived in Connecticut.
Education attainment for males 25 years and older:
No schooling: 21
Nursery to 4th grade: 0
5th and 6th grade: 8
7th and 8th grade: 58
9th grade: 42
10th grade: 61
11th grade: 78
12th grade, no diploma: 51
High school graduate (or equivalency): 839
Less than 1 year of college: 191
Some college more than 1 year, no degree: 335
Associate degree: 249
Bachelor's degree: 544
Master's degree: 236
Professional school degree: 61
Doctorate degree: 24
Education attainment for females 25 years and older:
No schooling: 38
Nursery to 4th grade: 0
5th and 6th grade: 35
7th and 8th grade: 34
9th grade: 0
10th grade: 52
11th grade: 29
12th grade, no diploma: 44
High school graduate (or equivalency): 936
Less than 1 year of college: 261
Some college more than 1 year, no degree: 370
Associate degree: 298
Bachelor's degree: 539
Master's degree: 273
Professional school degree: 60
Doctorate degree: 21
Housing units in structures:
One, detached: 3,570
One, attached: 49
Two: 124
3 or 4: 98
5 to 9: 94
10 to 19: 55
50 or more: 9
Mobile homes: 16
Housing units lacking complete plumbing facilities: 2.1%
Housing units lacking complete kitchen facilities: 4.7%