East Cleveland, OH (Ohio) Houses and Residents
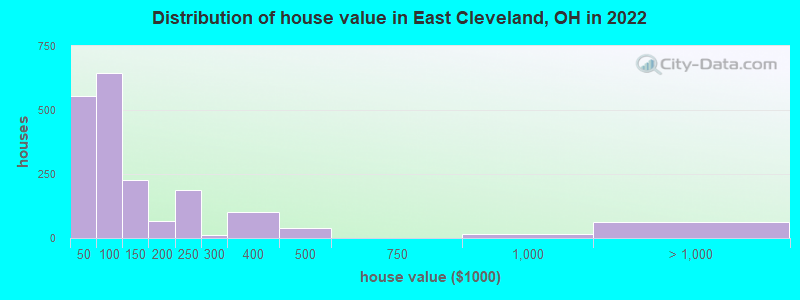
Estimated median house or condo value in 2022: $79,333 (it was $67,200 in 2000 )
East Cleveland:
$79,333Ohio:
$204,100
Lower value quartile - upper value quartile: $44,094 - $150,547Total population: 17,432 (All urban)
Houses: 9,554 (6,567 occupied: 2,040 owner occupied, 4,566 renter occupied )
% of renters here:
69%State:
33%
Housing density: 3,076 houses/condos per square mile
Median price asked for vacant for-sale houses and condos in 2022: $84,298.
Median contract rent in 2022: $595 (lower quartile is $428, upper quartile is $761)
Median rent asked for vacant for-rent units in 2022: $631
Median gross rent in East Cleveland, OH in 2022: $739
Housing units in East Cleveland with a mortgage: 839 (97 second mortgage, 0 home equity loan, 47 both second mortgage and home equity loan )Houses without a mortgage: 63
Median household income for houses/condos with a mortgage: $49,969
Median household income for apartments without a mortgage: $39,812
Median monthly housing costs: $730
Data:
Median house or condo value ($)
Median house or condo value ($ change since 2000)
Median house or condo value ($) - White
Median house or condo value ($) - Black or African American
Median house or condo value ($) - Asian
Median house or condo value ($) - Hispanic or Latino
Median house or condo value ($) - American Indian and Alaska Native
Median house or condo value ($) - Multirace
Median house or condo value ($) - Other Race
Median price asked for mobile homes ($)
Household density (households per square mile)
Mean house or condo value by units in structure - 1, detached ($)
Mean house or condo value by units in structure - 1, attached ($)
Mean house or condo value by units in structure - 2 ($)
Mean house or condo value by units in structure by units in structure - 3 or 4 ($)
Mean house or condo value by units in structure - 5 or more ($)
Mean house or condo value by units in structure - Boat, RV, van, etc. ($)
Mean house or condo value by units in structure - Mobile home ($)
Median contract rent ($)
Median contract rent - Lower quartile ($)
Median contract rent - Upper quartile ($)
Median gross rent ($)
Urban houses (%)
Rural houses (%)
Houses occupied (%)
Houses occupied (% change since 2000)
Houses owner occupied (%)
Houses owner occupied (% change since 2000)
Houses renter occupied (%)
Houses renter occupied (% change since 2000)
Vacant housing units - For rent (%)
Vacant housing units - For rent (% change since 2000)
Vacant housing units - For sale only (%)
Vacant housing units - For sale only (% change since 2000)
Vacant housing units - Rented or sold, not occupied (%)
Vacant housing units - Rented or sold, not occupied (% change since 2000)
Vacant housing units - For seasonal, recreational, or occasional use (%)
Vacant housing units - For seasonal, recreational, or occasional use (% change since 2000)
Vacant housing units - For migrant workers (%)
Vacant housing units - For migrant workers (% change since 2000)
Vacant housing units - Other vacant (%)
Vacant housing units - Other vacant (% change since 2000)
Median monthly housing costs ($)
Median household income for houses/condos with a mortgage ($)
Median household income for houses/condos without a mortgage ($)
Median household income ($)
Median household income ($) - White
Median household income ($) - Black or African American
Median household income ($) - Asian
Median household income ($) - Hispanic or Latino
Median household income ($) - American Indian and Alaska Native
Median household income ($) - Multirace
Median household income ($) - Other Race
Mortgage status - with mortgage (%)
Mortgage status - with second mortgage (%)
Mortgage status - with home equity loan (%)
Mortgage status - with both second mortgage and home equity loan (%)
Mortgage status - without a mortgage (%)
Median year house/condo built
Median year apartment built
Household type by relationship - Male householder living alone (%)
Household type by relationship - Male householder not living alone (%)
Household type by relationship - Female householder living alone (%)
Household type by relationship - Female householder not living alone (%)
Household type by relationship - Opposite-Sex spouse (%)
Household type by relationship - Same-Sex spouse (%)
Household type by relationship - Opposite-Sex unmarried partner (%)
Household type by relationship - Same-Sex unmarried partner (%)
Household type by relationship - In group quarters (%)
Size of family households - 2-person household (%)
Size of family households - 3-person household (%)
Size of family households - 4-person household (%)
Size of family households - 5-person household (%)
Size of family households - 6-person household (%)
Size of family households - 7-or-more-person household (%)
Size of nonfamily households - 1-person household (%)
Size of nonfamily households - 2-person household (%)
Size of nonfamily households - 3-person household (%)
Size of nonfamily households - 4-person household (%)
Size of nonfamily households - 5-person household (%)
Size of nonfamily households - 6-person household (%)
Size of nonfamily households - 7-or-moreperson household (%)
Year house built - Built 2010 or later (%)
Year house built - Built 2000 to 2009 (%)
Year house built - Built 1990 to 1999 (%)
Year house built - Built 1980 to 1989 (%)
Year house built - Built 1970 to 1979 (%)
Year house built - Built 1960 to 1969 (%)
Year house built - Built 1950 to 1959 (%)
Year house built - Built 1940 to 1949 (%)
Year house built - Built 1939 or earlier (%)
Median number of rooms in houses and condos
Median number of rooms in apartments
Median number of bedrooms in owner occupied houses
Mean number of bedrooms in owner occupied houses
Median number of bedrooms in renter occupied houses
Mean number of bedrooms in renter occupied houses
Median number of vehichles in owner occupied houses
Mean number of vehichles in owner occupied houses
Median number of vehichles in renter occupied houses
Mean number of vehichles in renter occupied houses
Rooms in owner-occupied houses - 1 room (%)
Rooms in owner-occupied houses - 2 rooms (%)
Rooms in owner-occupied houses - 3 rooms (%)
Rooms in owner-occupied houses - 4 rooms (%)
Rooms in owner-occupied houses - 5 rooms (%)
Rooms in owner-occupied houses - 6 rooms (%)
Rooms in owner-occupied houses - 7 rooms (%)
Rooms in owner-occupied houses - 8 rooms (%)
Rooms in owner-occupied houses - 9+ rooms (%)
Rooms in renter-occupied houses - 1 room (%)
Rooms in renter-occupied houses - 2 rooms (%)
Rooms in renter-occupied houses - 3 rooms (%)
Rooms in renter-occupied houses - 4 rooms (%)
Rooms in renter-occupied houses - 5 rooms (%)
Rooms in renter-occupied houses - 6 rooms (%)
Rooms in renter-occupied houses - 7 rooms (%)
Rooms in renter-occupied houses - 8 rooms (%)
Rooms in renter-occupied houses - 9+ rooms (%)
Bedrooms in owner-occupied houses - no bedrooms (%)
Bedrooms in owner-occupied houses - 1 bedroom (%)
Bedrooms in owner-occupied houses - 2 bedrooms (%)
Bedrooms in owner-occupied houses - 3 bedrooms (%)
Bedrooms in owner-occupied houses - 4 bedrooms (%)
Bedrooms in owner-occupied houses - 5+ bedrooms (%)
Bedrooms in renter-occupied houses - no bedrooms (%)
Bedrooms in renter-occupied houses - 1 bedroom (%)
Bedrooms in renter-occupied houses - 2 bedrooms (%)
Bedrooms in renter-occupied houses - 3 bedrooms (%)
Bedrooms in renter-occupied houses - 4 bedrooms (%)
Bedrooms in renter-occupied houses - 5+ bedrooms (%)
Vehicles available in owner-occupied houses - no vehicle available (%)
Vehicles available in owner-occupied houses - 1 vehicle available(%)
Vehicles available in owner-occupied houses - 2 Vehicles available (%)
Vehicles available in owner-occupied houses - 3 Vehicles available (%)
Vehicles available in owner-occupied houses - 4 Vehicles available (%)
Vehicles available in owner-occupied houses - 5+ Vehicles available (%)
Vehicles available in renter-occupied houses - no vehicle available (%)
Vehicles available in renter-occupied houses - 1 vehicle available (%)
Vehicles available in renter-occupied houses - 2 Vehicles available (%)
Vehicles available in renter-occupied houses - 3 Vehicles available (%)
Vehicles available in renter-occupied houses - 4 Vehicles available (%)
Vehicles available in renter-occupied houses - 5+ Vehicles available (%)
Housing units in structures - 1, detached (%)
Housing units in structures - 1, attached (%)
Housing units in structures - 2 (%)
Housing units in structures - 3 or 4 (%)
Housing units in structures - 5 to 9 (%)
Housing units in structures - 10 to 19 (%)
Housing units in structures - 20 to 49 (%)
Housing units in structures - 50 or more (%)
Housing units in structures - Mobile home (%)
Housing units in structures - Boat, RV, van, etc. (%)
Housing units in structures - Owners - 1, detached (%)
Housing units in structures - Owners - 1, attached (%)
Housing units in structures - Owners - 2 (%)
Housing units in structures - Owners - 3 or 4 (%)
Housing units in structures - Owners - 5 to 9 (%)
Housing units in structures - Owners - 10 to 19 (%)
Housing units in structures - Owners - 20 to 49 (%)
Housing units in structures - Owners - 50 or more (%)
Housing units in structures - Owners - Mobile home (%)
Housing units in structures - Owners - Boat, RV, van, etc. (%)
Housing units in structures - Renters - 1, detached (%)
Housing units in structures - Renters - 1, attached (%)
Housing units in structures - Renters - 2 (%)
Housing units in structures - Renters - 3 or 4 (%)
Housing units in structures - Renters - 5 to 9 (%)
Housing units in structures - Renters - 10 to 19 (%)
Housing units in structures - Renters - 20 to 49 (%)
Housing units in structures - Renters - 50 or more (%)
Housing units in structures - Renters - Mobile home (%)
Housing units in structures - Renters - Boat, RV, van, etc. (%)
House/condo owner moved in on average (years ago)
Renter moved in on average (years ago)
Year householder moved into unit - Moved in 1999 to March 2000 (%)
Year householder moved into unit - Moved in 1999 to March 2000 (%) - White
Year householder moved into unit - Moved in 1999 to March 2000 (%) - Black or African American
Year householder moved into unit - Moved in 1999 to March 2000 (%) - Asian
Year householder moved into unit - Moved in 1999 to March 2000 (%) - Hispanic or Latino
Year householder moved into unit - Moved in 1999 to March 2000 (%) - American Indian and Alaska Native
Year householder moved into unit - Moved in 1999 to March 2000 (%) - Multirace
Year householder moved into unit - Moved in 1999 to March 2000 (%) - Other Race
Year householder moved into unit - Moved in 1995 to 1998 (%)
Year householder moved into unit - Moved in 1995 to 1998 (%) - White
Year householder moved into unit - Moved in 1995 to 1998 (%) - Black or African American
Year householder moved into unit - Moved in 1995 to 1998 (%) - Asian
Year householder moved into unit - Moved in 1995 to 1998 (%) - Hispanic or Latino
Year householder moved into unit - Moved in 1995 to 1998 (%) - American Indian and Alaska Native
Year householder moved into unit - Moved in 1995 to 1998 (%) - Multirace
Year householder moved into unit - Moved in 1995 to 1998 (%) - Other Race
Year householder moved into unit - Moved in 1990 to 1994 (%)
Year householder moved into unit - Moved in 1990 to 1994 (%) - White
Year householder moved into unit - Moved in 1990 to 1994 (%) - Black or African American
Year householder moved into unit - Moved in 1990 to 1994 (%) - Asian
Year householder moved into unit - Moved in 1990 to 1994 (%) - Hispanic or Latino
Year householder moved into unit - Moved in 1990 to 1994 (%) - American Indian and Alaska Native
Year householder moved into unit - Moved in 1990 to 1994 (%) - Multirace
Year householder moved into unit - Moved in 1990 to 1994 (%) - Other Race
Year householder moved into unit - Moved in 1980 to 1989 (%)
Year householder moved into unit - Moved in 1980 to 1989 (%) - White
Year householder moved into unit - Moved in 1980 to 1989 (%) - Black or African American
Year householder moved into unit - Moved in 1980 to 1989 (%) - Asian
Year householder moved into unit - Moved in 1980 to 1989 (%) - Hispanic or Latino
Year householder moved into unit - Moved in 1980 to 1989 (%) - American Indian and Alaska Native
Year householder moved into unit - Moved in 1980 to 1989 (%) - Multirace
Year householder moved into unit - Moved in 1980 to 1989 (%) - Other Race
Year householder moved into unit - Moved in 1970 to 1979 (%)
Year householder moved into unit - Moved in 1970 to 1979 (%) - White
Year householder moved into unit - Moved in 1970 to 1979 (%) - Black or African American
Year householder moved into unit - Moved in 1970 to 1979 (%) - Asian
Year householder moved into unit - Moved in 1970 to 1979 (%) - Hispanic or Latino
Year householder moved into unit - Moved in 1970 to 1979 (%) - American Indian and Alaska Native
Year householder moved into unit - Moved in 1970 to 1979 (%) - Multirace
Year householder moved into unit - Moved in 1970 to 1979 (%) - Other Race
Year householder moved into unit - Moved in 1969 or earlier (%)
Year householder moved into unit - Moved in 1969 or earlier (%) - White
Year householder moved into unit - Moved in 1969 or earlier (%) - Black or African American
Year householder moved into unit - Moved in 1969 or earlier (%) - Asian
Year householder moved into unit - Moved in 1969 or earlier (%) - Hispanic or Latino
Year householder moved into unit - Moved in 1969 or earlier (%) - American Indian and Alaska Native
Year householder moved into unit - Moved in 1969 or earlier (%) - Multirace
Year householder moved into unit - Moved in 1969 or earlier (%) - Other Race
Housing units lacking complete plumbing facilities (%)
Housing units lacking complete kitchen facilities (%)
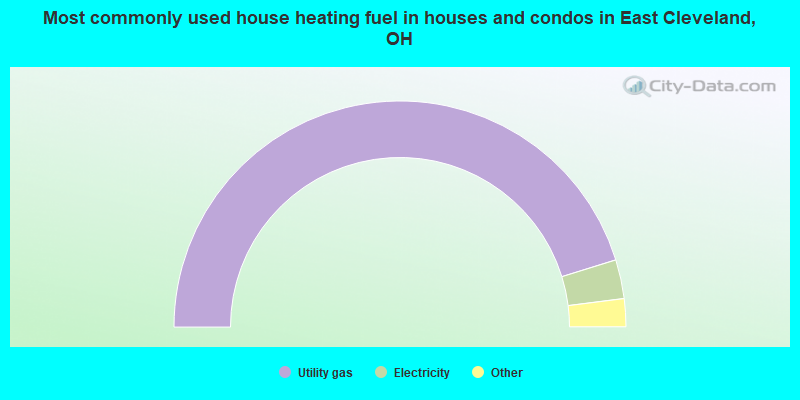
House heating fuel used in houses and condos - Utility gas (%)
House heating fuel used in houses and condos - Bottled, tank, or LP gas (%)
House heating fuel used in houses and condos - Electricity (%)
House heating fuel used in houses and condos - Fuel oil, kerosene, etc. (%)
House heating fuel used in houses and condos - Coal or coke (%)
House heating fuel used in houses and condos - Wood (%)
House heating fuel used in houses and condos - Solar energy (%)
House heating fuel used in houses and condos - Other fuel (%)
House heating fuel used in houses and condos - No fuel used (%)
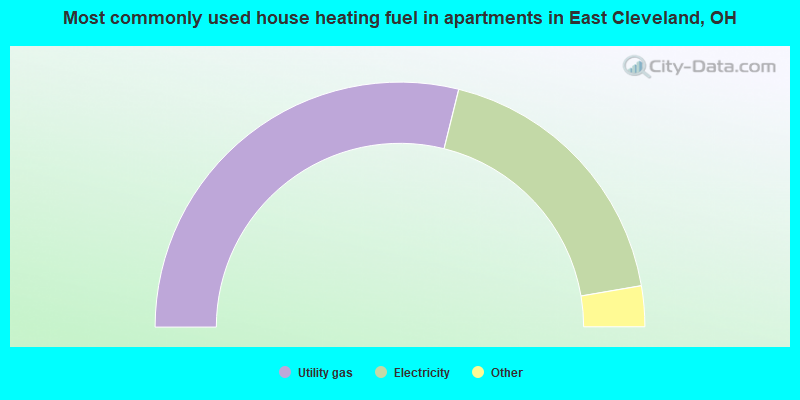
House heating fuel used in apartments - Utility gas (%)
House heating fuel used in apartments - Bottled, tank, or LP gas (%)
House heating fuel used in apartments - Electricity (%)
House heating fuel used in apartments - Fuel oil, kerosene, etc. (%)
House heating fuel used in apartments - Coal or coke (%)
House heating fuel used in apartments - Wood (%)
House heating fuel used in apartments - Solar energy (%)
House heating fuel used in apartments - Other fuel (%)
House heating fuel used in apartments - No fuel used (%)
Median year house/condo built: 1938Median year apartment built: 1953Household type by relationship:
Households: 13,697
Male householders: 2,336 (1,271 living alone ), Female householders: 4,132 (2,187 living alone )643 spouses (624 opposite-sex spouses ), 501 unmarried partners , (483 opposite-sex unmarried partners ), 4,020 children (3,753 natural , 89 adopted , 177 stepchildren ), 657 grandchildren , 256 brothers or sisters , 281 parents , 22 foster children , 133 other relatives , 317 non-relatives In group quarters: 395
Size of family households: 1,219 2-persons , 722 3-persons , 558 4-persons , 196 5-persons , 120 6-persons , 57 7-or-more-persons .
Size of nonfamily households: 3,484 1-person , 193 2-persons , 12 5-persons .
214 married couples with children. single-parent households (542 men , 1,878 women ).
90.7% of residents of East Cleveland speak English at home. of residents speak Spanish at home (63% speak English very well , 37% speak English well ).of residents speak other Indo-European language at home (36% speak English very well , 45% speak English well , 2% speak English not well , 16% don't speak English at all ).of residents speak Asian or Pacific Island language at home (35% speak English very well , 65% speak English not well ).of residents speak other language at home (77% speak English very well , 17% speak English well , 6% speak English not well ).
Foreign born population: 661 (4.8%)of them are naturalized citizens )
Median number of rooms in houses and condos:
Median number of rooms in apartments
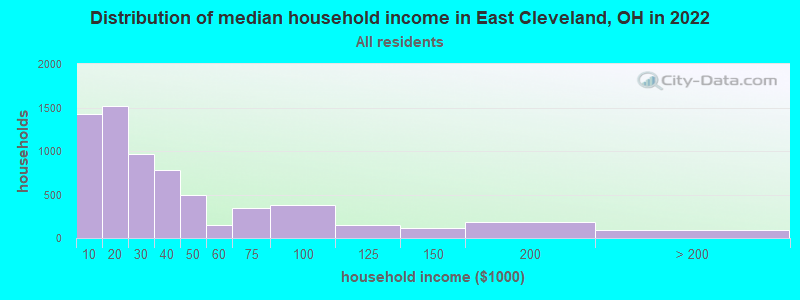
East Cleveland, OH household income distribution 1,425 Less than $10,0001,515 $10,000 to $19,999965 $20,000 to $29,999786 $30,000 to $39,999490 $40,000 to $49,999155 $50,000 to $59,999349 $60,000 to $74,999381 $75,000 to $99,999151 $100,000 to $124,999118 $125,000 to $149,999187 $150,000 to $199,99995 $200,000 or more
Home value of owner - occupied houses in 2022 in East Cleveland, OH 28 Less than $10,00074 $10,000 to $14,99926 $15,000 to $19,99961 $20,000 to $24,99979 $25,000 to $29,99966 $30,000 to $34,99969 $35,000 to $39,999147 $40,000 to $49,999129 $50,000 to $59,99959 $60,000 to $69,999130 $70,000 to $79,999135 $80,000 to $89,99941 $90,000 to $99,99998 $100,000 to $124,999127 $125,000 to $149,99942 $150,000 to $174,99924 $175,000 to $199,999186 $200,000 to $249,99912 $250,000 to $299,999103 $300,000 to $399,99940 $400,000 to $499,99915 $750,000 to $999,99964 $1,000,000 to $1,499,999Rent paid by renters in 2022 in East Cleveland, OH 119 Less than $10083 $150 to $199372 $200 to $249146 $250 to $29981 $300 to $34990 $350 to $399246 $400 to $449167 $450 to $499398 $500 to $549308 $550 to $599390 $600 to $649359 $650 to $699521 $700 to $749282 $750 to $799216 $800 to $899107 $900 to $999136 $1,000 to $1,24911 $1,250 to $1,49911 $1,500 to $1,99918 $3,500 or more242 No cash rent
Percentage of workers working in this county: 92.8%Number of people working at home: 329 (7.3% of all workers )
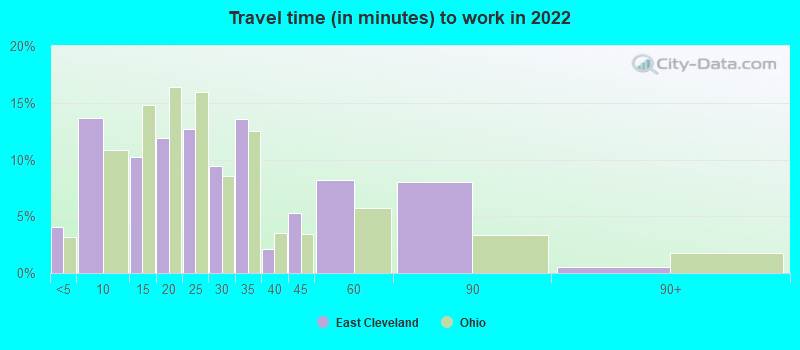
Travel time to work (commute)
Less than 5 minutes: 1565 to 9 minutes: 43610 to 14 minutes: 46415 to 19 minutes: 48620 to 24 minutes: 98125 to 29 minutes: 15730 to 34 minutes: 59135 to 39 minutes: 2340 to 44 minutes: 27045 to 59 minutes: 25160 to 89 minutes: 17390 or more minutes: 42
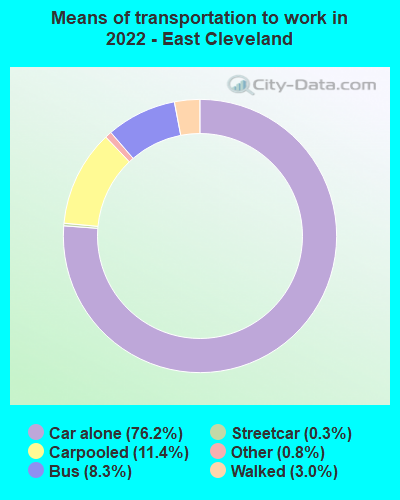
Means of transportation to work:
Drove a car alone: 1,959 (66.7%)Carpooled: 296 (10.1%)Bus : 185 (6.3%)Subway or elevated rail : 8 (0.3%)Taxi: 21 (0.7%)Walked: 91 (3.1%)Worked at home: 329 (11.2%)
Unemployment by race in 2022
Unemployment rate for White non-Hispanic residents 1.2% MalesUnemployment rate for Black residents 19.0% Males17.9% FemalesUnemployment rate for Asian residents 23.7% FemalesUnemployment rate for other race residents 100.0% Females
Year of entry for the foreign-born population in East Cleveland, Ohio
365 2010 or later 132 2000 to 2009 80 1990 to 1999 30 1980 to 1989 122 1970 to 1979 71 Before 1970
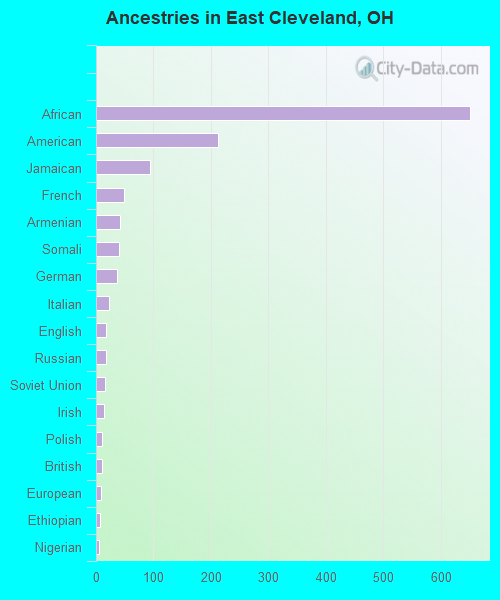
First ancestries reported:
African: 651 (6.3%)
American: 212 (2.1%)
Jamaican: 94 (0.9%)
French: 48 (0.5%)
Armenian: 41 (0.4%)
Somali: 40 (0.4%)
German: 36 (0.3%)
Italian: 22 (0.2%)
English: 17 (0.2%)
Russian: 17 (0.2%)
Soviet Union: 16 (0.2%)
Irish: 14 (0.1%)
Polish: 11 (0.1%)
British: 10 (0.10%)
European: 9 (0.09%)
Ethiopian: 7 (0.07%)
Nigerian: 6 (0.06%)
Scotch-Irish: 4 (0.04%)
Arab: 3 (0.03%)
Dutch: 3 (0.03%) Most common places of birth for foreign-born residents (%): Ivory Coast East Cleveland:
62.6% (429)Ohio:
0.3% (1,682)
Jamaica East Cleveland:
14.7% (101)Ohio:
0.7% (4,187)
Other Eastern Europe East Cleveland:
8.2% (56)Ohio:
0.7% (4,155)
Vietnam East Cleveland:
6.3% (43)Ohio:
1.9% (10,960)
Africa, n.e.c. East Cleveland:
5.8% (40)Ohio:
1.1% (6,096)
China, excluding Hong Kong and Taiwan East Cleveland:
5.7% (39)Ohio:
6.2% (35,703)
Somalia East Cleveland:
5.0% (34)Ohio:
2.2% (12,861)
Democratic Republic of Congo (Zaire) East Cleveland:
4.4% (30)Ohio:
0.4% (2,154)
Saudi Arabia East Cleveland:
2.9% (20)Ohio:
0.6% (3,669)
Germany East Cleveland:
2.0% (14)Ohio:
2.2% (12,846)
Afghanistan East Cleveland:
1.9% (13)Ohio:
0.2% (1,151)
Liberia East Cleveland:
1.9% (13)Ohio:
0.5% (2,621)
Russia East Cleveland:
1.8% (12)Ohio:
1.5% (8,452)
Nigeria East Cleveland:
1.8% (12)Ohio:
1.2% (7,029)
Place of birth for U.S.-born residents:
This state: 10,457Other state: 2,531Northeast: 273Midwest: 706South: 1,511West: 21 81.4% of East Cleveland residents lived in the same house 1 years ago.
Out of people who lived in different houses, 43.7% lived in this county.
Out of people who lived in different counties, 35.3% lived in Ohio.
East Cleveland:
81.4%State average:
87.8%
Education attainment for males 25 years and older:
No schooling: 21Nursery to 4th grade: 05th and 6th grade: 07th and 8th grade: 329th grade: 11910th grade: 8211th grade: 12912th grade, no diploma: 208High school graduate (or equivalency): 1,423Less than 1 year of college: 166Some college more than 1 year, no degree: 489Associate degree: 287Bachelor's degree: 456Master's degree: 236Professional school degree: 0Doctorate degree: 23
Education attainment for females 25 years and older:
No schooling: 122Nursery to 4th grade: 55th and 6th grade: 377th and 8th grade: 659th grade: 6410th grade: 12911th grade: 23012th grade, no diploma: 187High school graduate (or equivalency): 1,750Less than 1 year of college: 703Some college more than 1 year, no degree: 828Associate degree: 537Bachelor's degree: 445Master's degree: 270Professional school degree: 21Doctorate degree: 40
Housing units in structures:
One, detached: 2,919One, attached: 654Two: 1,4793 or 4: 5485 to 9: 62110 to 19: 34320 to 49: 92950 or more: 2,048Mobile homes: 9Housing units lacking complete plumbing facilities in 2022: 21.0%Housing units lacking complete kitchen facilities in 2022: 24.3%House/condo owner moved in on average 26 years ago
Renter moved in on average 5 years ago
Private vs. public school enrollment:
Students in private schools in grades 1 to 8 (elementary and middle school): 272 Students in private schools in grades 9 to 12 (high school): 80 Students in private undergraduate colleges: 212