Housing density: 758 houses/condos per square mile
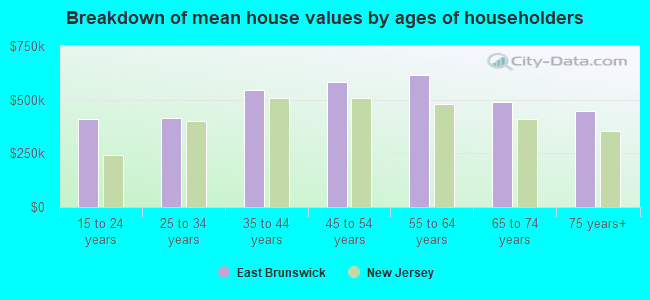
Median price asked for vacant for-sale houses and condos in 2022 in this county: $458,901.
Median contract rent in 2022: $1,635 (lower quartile is $1,322, upper quartile is over $2,000)
Median rent asked for vacant for-rent units in 2022: $1,796
Median gross rent in East Brunswick, NJ in 2022: $1,732
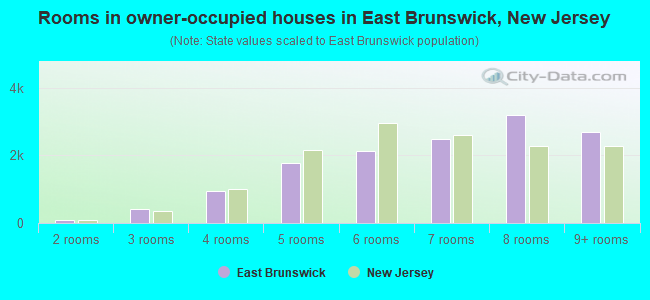
Housing units in East Brunswick with a mortgage: 9,297 (868 second mortgage, 1,452 home equity loan, 72 both second mortgage and home equity loan) Houses without a mortgage: 3,015
Compare current foreclosures in East Brunswick, NJ:
In family households: 685,318 (144,417 male householders, 58,537 female householders)
157,214 spouses, 245,764 children (235,122 natural, 3,912 adopted, 6,730 stepchildren), 12,325 grandchildren, 10,608 brothers or sisters, 14,972 parents, foster children, 15,190 other relatives, 17,701 non-relatives
In nonfamily households: 100,705 (34,701 male householders (26,114 living alone)), 43,531 female householders (37,036 living alone)), 22,473 nonrelatives
In group quarters: 23,835 (8,024 institutionalized population)
132,678 married couples with children.
28,844 single-parent households (6,357 men, 22,487 women).
70.3% of residents of East Brunswick speak English at home.
3.6% of residents speak Spanish at home (73% speak English very well, 16% speak English well, 8% speak English not well, 3% don't speak English at all).
11.4% of residents speak other Indo-European language at home (68% speak English very well, 22% speak English well, 7% speak English not well, 3% don't speak English at all).
10.6% of residents speak Asian or Pacific Island language at home (58% speak English very well, 26% speak English well, 14% speak English not well, 2% don't speak English at all).
4.1% of residents speak other language at home (70% speak English very well, 21% speak English well, 9% speak English not well).
Foreign born population: 18,517 (34.5%)
(84.1% of them are naturalized citizens)
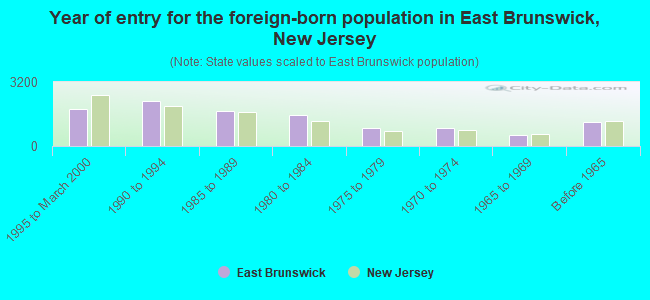
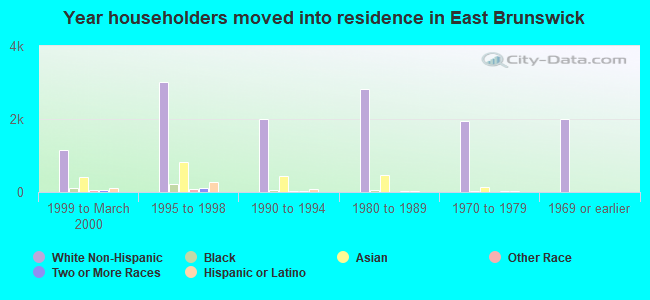
Year of entry for the foreign-born population in East Brunswick, New Jersey
1,8371995 to March 2000
2,2621990 to 1994
1,7461985 to 1989
1,5511980 to 1984
8901975 to 1979
9201970 to 1974
5651965 to 1969
1,211Before 1965
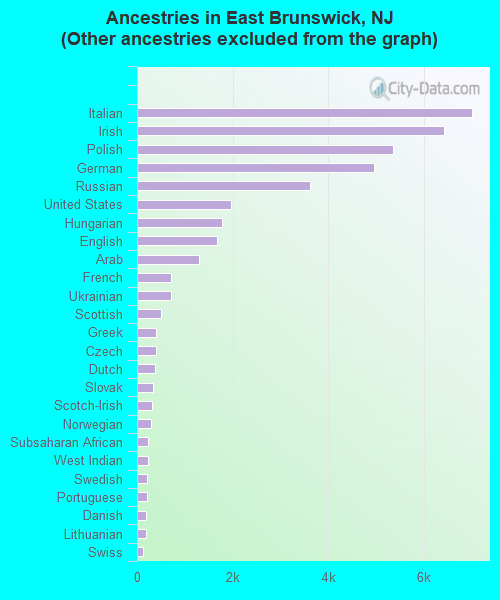
First ancestries reported:
Other: 15,507 (28.0%)
Italian: 7,020 (12.7%)
Irish: 6,434 (11.6%)
Polish: 5,369 (9.7%)
German: 4,973 (9.0%)
Russian: 3,627 (6.6%)
United States: 1,960 (3.5%)
Hungarian: 1,779 (3.2%)
English: 1,676 (3.0%)
Arab: 1,307 (2.4%)
French: 713 (1.3%)
Ukrainian: 706 (1.3%)
Scottish: 512 (0.9%)
Greek: 407 (0.7%)
Czech: 401 (0.7%)
Dutch: 380 (0.7%)
Slovak: 333 (0.6%)
Scotch-Irish: 311 (0.6%)
Norwegian: 286 (0.5%)
Subsaharan African: 220 (0.4%)
West Indian: 220 (0.4%)
Swedish: 219 (0.4%)
Portuguese: 212 (0.4%)
Danish: 197 (0.4%)
Lithuanian: 194 (0.4%)
Swiss: 128 (0.2%)
French Canadian: 122 (0.2%)
Welsh: 83 (0.2%)
Most common places of birth for foreign-born residents (%):
India
East Brunswick:
18.6% (2,042)
New Jersey:
8.1% (119,497)
China, excluding Hong Kong and Taiwan
East Brunswick:
10.1% (1,105)
New Jersey:
2.7% (40,092)
Egypt
East Brunswick:
7.2% (788)
New Jersey:
1.4% (20,079)
Taiwan
East Brunswick:
6.9% (758)
New Jersey:
1.2% (18,066)
Russia
East Brunswick:
5.5% (606)
New Jersey:
1.4% (20,243)
Philippines
East Brunswick:
3.7% (405)
New Jersey:
4.7% (69,773)
Ukraine
East Brunswick:
3.2% (346)
New Jersey:
1.0% (14,768)
Korea
East Brunswick:
2.9% (322)
New Jersey:
3.5% (51,970)
Other Eastern Europe
East Brunswick:
2.6% (288)
New Jersey:
1.2% (17,647)
Hong Kong
East Brunswick:
2.5% (271)
New Jersey:
0.6% (8,266)
Italy
East Brunswick:
2.2% (239)
New Jersey:
4.0% (58,395)
Poland
East Brunswick:
2.0% (225)
New Jersey:
3.8% (55,466)
Hungary
East Brunswick:
2.0% (224)
New Jersey:
0.5% (7,426)
Pakistan
East Brunswick:
1.9% (212)
New Jersey:
1.1% (16,052)
Peru
East Brunswick:
1.8% (203)
New Jersey:
3.1% (45,151)
Germany
East Brunswick:
1.5% (169)
New Jersey:
2.3% (33,531)
Place of birth for U.S.-born residents:
This state: 20,700
Other state: 14,710
Northeast: 12,676
Midwest: 725
South: 797
West: 512
66% of East Brunswick residents lived in the same house 5 years ago. Out of people who lived in different houses, 58% lived in this county. Out of people who lived in different counties, 45% lived in New Jersey.
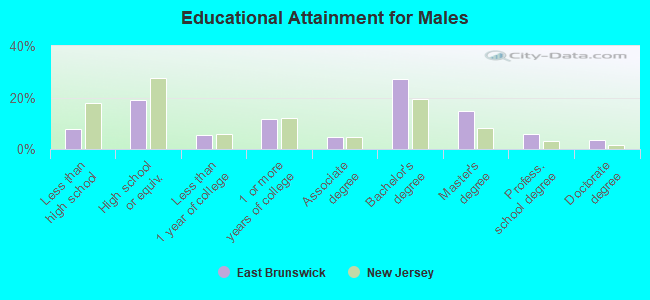
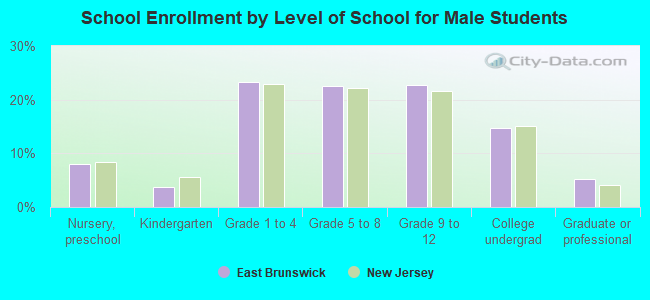
Education attainment for males 25 years and older:
No schooling: 29
Nursery to 4th grade: 27
5th and 6th grade: 77
7th and 8th grade: 285
9th grade: 94
10th grade: 165
11th grade: 106
12th grade, no diploma: 377
High school graduate (or equivalency): 2,790
Less than 1 year of college: 819
Some college more than 1 year, no degree: 1,728
Associate degree: 682
Bachelor's degree: 4,022
Master's degree: 2,209
Professional school degree: 834
Doctorate degree: 539
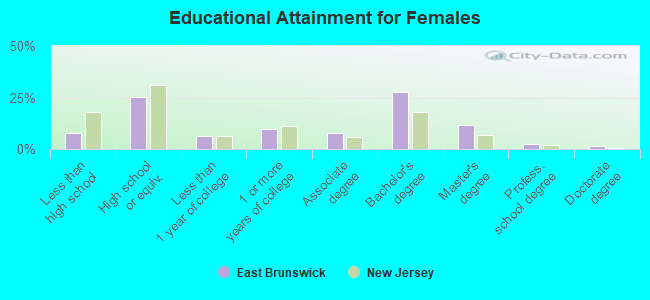
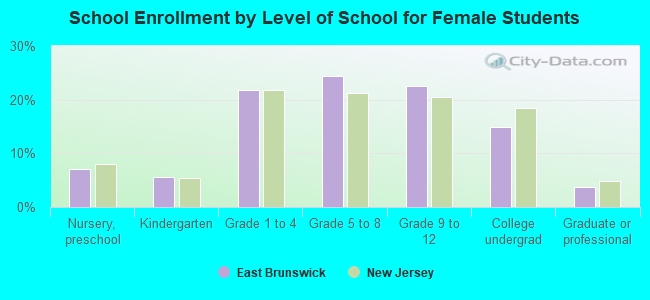
Education attainment for females 25 years and older:
No schooling: 93
Nursery to 4th grade: 59
5th and 6th grade: 129
7th and 8th grade: 305
9th grade: 101
10th grade: 166
11th grade: 103
12th grade, no diploma: 372
High school graduate (or equivalency): 4,260
Less than 1 year of college: 1,054
Some college more than 1 year, no degree: 1,618
Associate degree: 1,303
Bachelor's degree: 4,707
Master's degree: 1,956
Professional school degree: 421
Doctorate degree: 222
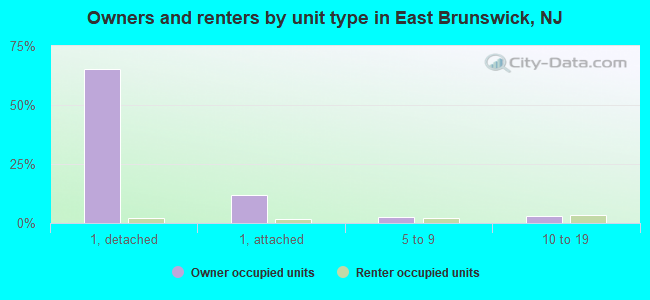
Housing units in structures:
One, detached: 11,133
One, attached: 2,203
Two: 228
3 or 4: 371
5 to 9: 810
10 to 19: 1,076
20 to 49: 342
50 or more: 433
Mobile homes: 44
Median worth of mobile homes: $24,554
Housing units lacking complete plumbing facilities: 0.2%
Housing units lacking complete kitchen facilities: 0.1%