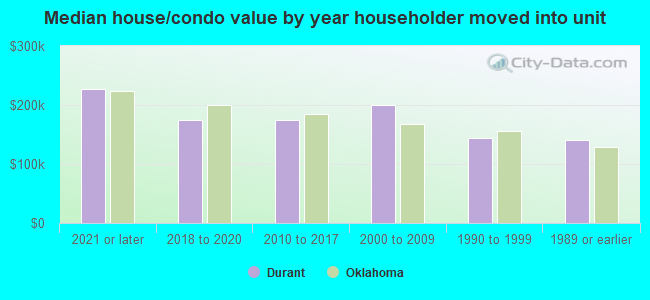
Durant, OK (Oklahoma) Houses and Residents
| Durant: | $176,971 |
| Oklahoma: | $191,700 |
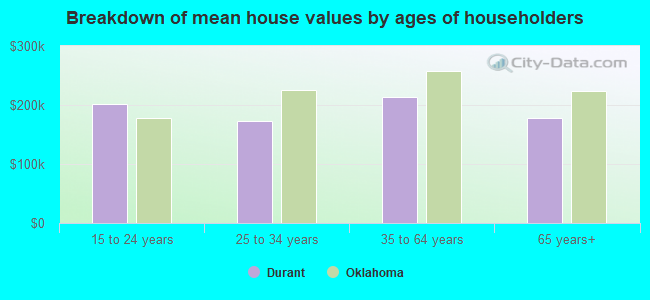
Mean price in 2022:
Detached houses: $266,792
Here: $266,792 State: $255,409 Townhouses or other attached units: $224,194
Here: $224,194 State: $206,466 Mobile homes: $86,152
Here: $86,152 State: $110,804
Total population: 17,041 (Urban population: 12,698 (all inside urban clusters), Rural population: 857 (7 farm, 850 nonfarm))
Houses: 8,183 (7,420 occupied: 3,465 owner occupied, 4,093 renter occupied)
| % of renters here: | 54% |
| State: | 35% |
Housing density: 430 houses/condos per square mile
Median price asked for vacant for-sale houses and condos in 2022: $67,651.
Median contract rent in 2022: $714 (lower quartile is $543, upper quartile is $891)
Median rent asked for vacant for-rent units in 2022: $877
Median gross rent in Durant, OK in 2022: $879
Housing units in Durant with a mortgage: 1,726 (80 second mortgage, 12 home equity loan, 12 both second mortgage and home equity loan)
Houses without a mortgage: 49
Median household income for houses/condos with a mortgage: $84,487
Median household income for apartments without a mortgage: $43,803
Median monthly housing costs: $852
Compare current foreclosures near Durant, OK:
| Photo | Address | Area | Beds / Baths | Price | Details |
|---|---|---|---|---|---|

|
#1
W Alabama St
Durant, OK 74701
|
- sq. feet
|
2 baths 2 beds |
show details | |

|
#2
Oak St
Durant, OK 74701
|
1,502 sq. feet
|
1 baths 3 beds |
show details | |

|
#3
Jerry St
Durant, OK 74701
|
1,746 sq. feet
|
2 baths 3 beds |
show details | |

|
#4
Osprey
Durant, OK 74701
|
1,564 sq. feet
|
2 baths 3 beds |
show details | |

|
#5
S 8th Ave
Durant, OK 74701
|
1,070 sq. feet
|
1 baths 3 beds |
show details | |

|
#6
Lakeshore Dr
Durant, OK 74701
|
- sq. feet
|
- baths - beds |
show details | |

|
#7
Hickory Dr
Durant, OK 74701
|
- sq. feet
|
- baths - beds |
show details | |

|
#8
Dakota St
Durant, OK 74701
|
- sq. feet
|
- baths - beds |
show details | |

|
#9
Mustang Dr
Durant, OK 74701
|
- sq. feet
|
- baths - beds |
show details | |

|
#10
W Highway 70
Durant, OK 74701
|
- sq. feet
|
- baths - beds |
show details |
| Photo | Address | Area | Beds / Baths | Price | Details |
|---|---|---|---|---|---|

|
#11
Watch Hill Dr
Durant, OK 74701
|
- sq. feet
|
- baths - beds |
show details | |

|
#12
State Road 70 E
Durant, OK 74701
|
- sq. feet
|
- baths - beds |
show details | |

|
#13
Barn Owl Dr
Durant, OK 74701
|
- sq. feet
|
- baths - beds |
show details | |

|
#14
Bunker Dr
Durant, OK 74701
|
- sq. feet
|
- baths - beds |
show details | |

|
#15
W Arkansas St
Durant, OK 74701
|
- sq. feet
|
- baths - beds |
show details | |

|
#16
4th Ave
Cartwright, OK 74731
|
- sq. feet
|
- baths - beds |
$25,000
|
show details |

|
#17
N Brackett St
Bokchito, OK 74726
|
893 sq. feet
|
1 baths 2 beds |
show details | |

|
#18
Kirsey Rd
Calera, OK 74730
|
1,782 sq. feet
|
2 baths 3 beds |
show details | |

|
#19
Posey Ln
Calera, OK 74730
|
1,512 sq. feet
|
2 baths 4 beds |
show details | |

|
#20
Stanton St
Calera, OK 74730
|
- sq. feet
|
- baths - beds |
show details |
| Photo | Address | Area | Beds / Baths | Price | Details |
|---|---|---|---|---|---|

|
#21
Southern Trace Dr
Calera, OK 74730
|
- sq. feet
|
- baths - beds |
show details | |

|
#22
S 4th St
Calera, OK 74730
|
- sq. feet
|
- baths - beds |
show details | |

|
#23
Kings Rd
Mead, OK 73449
|
- sq. feet
|
- baths - beds |
show details | |

|
#24
Wolf Trl
Calera, OK 74730
|
- sq. feet
|
- baths - beds |
show details | |

|
#25
8th St
Colbert, OK 74733
|
- sq. feet
|
- baths - beds |
show details | |

|
#26
Cumberland Vine Rd
Madill, OK 73446
|
- sq. feet
|
- baths - beds |
show details | |

|
#27
Almost Home
Calera, OK 74730
|
- sq. feet
|
- baths - beds |
show details | |

|
#28
Pacific Blvd
Pottsboro, TX 75076
|
- sq. feet
|
- baths - beds |
show details | |

|
#29
Quail Dr
Mead, OK 73449
|
- sq. feet
|
- baths - beds |
show details | |

|
Check over 1 million property listings on Foreclosure.com!
|
browse all offers | |||

Latest news about housing in Durant, OK collected exclusively by city-data.com from local newspapers, TV, and radio stations

 | Is OK a family friendly state? (40 replies) |
| Oklahoma Weather Thread (860 replies) |
| Durant business investments (8 replies) |
| Lodging in Durant, Oklahoma (4 replies) |
| SE Oklahoma compared to East Tennessee (41 replies) |
| Sold house in Dallas, now looking for one in Durant or Ardmore, OK. PPL FROM THOSE TOWNS PLZ REPLY! (12 replies) |

Median year apartment built: 1987
Household type by relationship:
Households: 18,991- Male householders: 3,546 (1,090 living alone), Female householders: 3,860 (1,385 living alone)
2,811 spouses (2,771 opposite-sex spouses), 776 unmarried partners, (762 opposite-sex unmarried partners), 4,851 children (4,386 natural, 145 adopted, 318 stepchildren), 544 grandchildren, 248 brothers or sisters, 219 parents, 30 foster children, 282 other relatives, 940 non-relatives
- In group quarters: 879
Size of family households: 1,998 2-persons, 834 3-persons, 868 4-persons, 593 5-persons, 101 6-persons, 41 7-or-more-persons.
Size of nonfamily households: 2,504 1-person, 451 2-persons, 88 3-persons, 37 4-persons, 22 5-persons.
2,237 married couples with children.
1,390 single-parent households (457 men, 933 women).
92.7% of residents of Durant speak English at home.
5.4% of residents speak Spanish at home (63% speak English very well, 14% speak English well, 15% speak English not well, 8% don't speak English at all).
0.4% of residents speak other Indo-European language at home (51% speak English very well, 40% speak English well, 10% speak English not well).
0.5% of residents speak Asian or Pacific Island language at home (84% speak English very well, 13% speak English well, 3% speak English not well).
0.8% of residents speak other language at home (87% speak English very well, 13% speak English well).
Foreign born population: 718 (3.8%)
(26.7% of them are naturalized citizens)
| Here: | 6.4 |
| State: | 6.1 |
| Here: | 4.3 |
| State: | 4.5 |
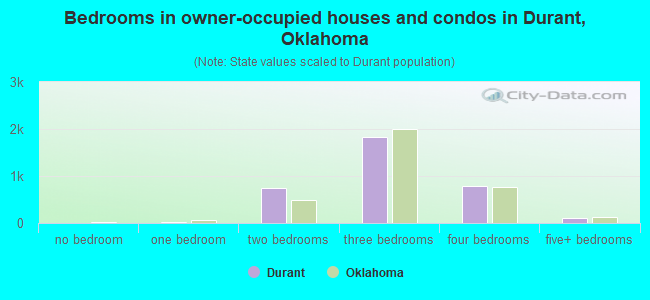
- Bedrooms in owner-occupied houses and condos in Durant, Oklahoma
- 6no bedroom
- 191 bedroom
- 7352 bedrooms
- 1,8213 bedrooms
- 7804 bedrooms
- 1045+ bedrooms
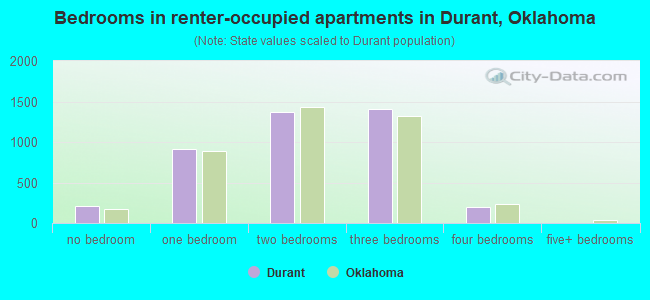
- Bedrooms in renter-occupied apartments in Durant, Oklahoma
- 204no bedroom
- 9121 bedroom
- 1,3652 bedrooms
- 1,4123 bedrooms
- 1964 bedrooms
- 45+ bedrooms
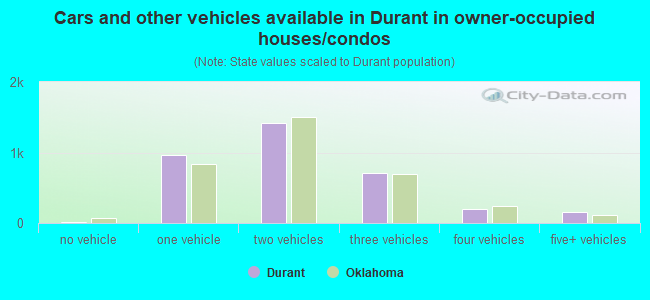
- Cars and other vehicles available in Durant in owner-occupied houses/condos
- 19no vehicle
- 9671 vehicle
- 1,4152 vehicles
- 7063 vehicles
- 2024 vehicles
- 1565+ vehicles
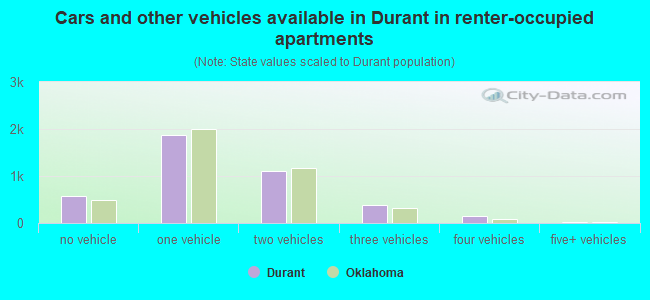
- Cars and other vehicles available in Durant in renter-occupied apartments
- 569no vehicle
- 1,8681 vehicle
- 1,1162 vehicles
- 3823 vehicles
- 1474 vehicles
- 115+ vehicles
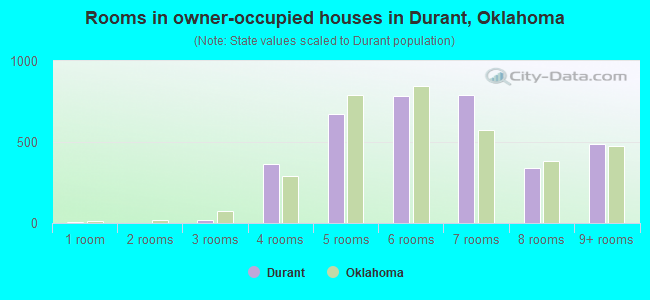
- Rooms in owner-occupied houses in Durant, Oklahoma
- 61 room
- 02 rooms
- 173 rooms
- 3674 rooms
- 6755 rooms
- 7856 rooms
- 7917 rooms
- 3408 rooms
- 4859+ rooms
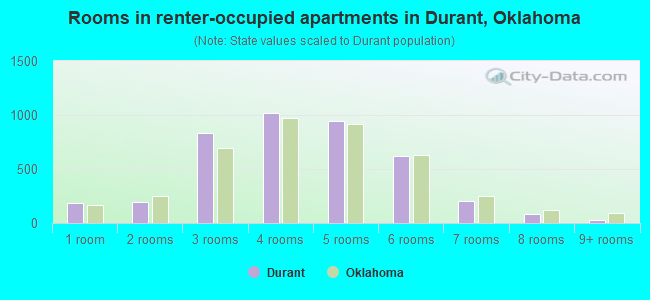
- Rooms in renter-occupied apartments in Durant, Oklahoma
- 1811 room
- 1942 rooms
- 8323 rooms
- 1,0164 rooms
- 9435 rooms
- 6206 rooms
- 2027 rooms
- 818 rooms
- 259+ rooms
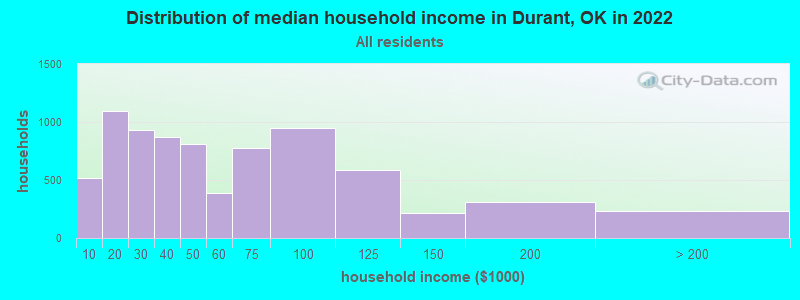
Durant, OK household income distribution

- 515Less than $10,000
- 1,091$10,000 to $19,999
- 931$20,000 to $29,999
- 874$30,000 to $39,999
- 810$40,000 to $49,999
- 391$50,000 to $59,999
- 775$60,000 to $74,999
- 952$75,000 to $99,999
- 590$100,000 to $124,999
- 218$125,000 to $149,999
- 310$150,000 to $199,999
- 234$200,000 or more
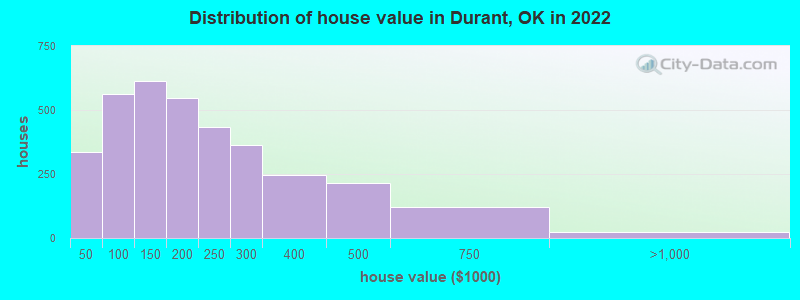
Home value of owner - occupied houses in 2022 in Durant, OK
-
- 87Less than $10,000
- 50$10,000 to $14,999
- 23$15,000 to $19,999
- 6$20,000 to $24,999
- 62$25,000 to $29,999
- 16$30,000 to $34,999
- 18$35,000 to $39,999
- 72$40,000 to $49,999
- 81$50,000 to $59,999
- 114$60,000 to $69,999
- 126$70,000 to $79,999
- 106$80,000 to $89,999
- 60$90,000 to $99,999
- 394$100,000 to $124,999
- 218$125,000 to $149,999
- 287$150,000 to $174,999
- 258$175,000 to $199,999
- 434$200,000 to $249,999
- 362$250,000 to $299,999
- 248$300,000 to $399,999
- 212$400,000 to $499,999
- 120$500,000 to $749,999
- 17$750,000 to $999,999
- 4$1,000,000 to $1,499,999
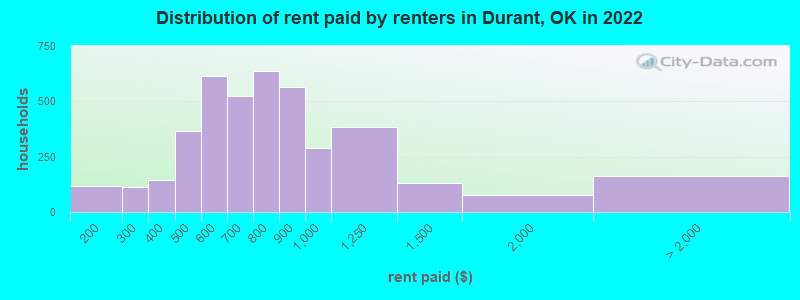
Rent paid by renters in 2022 in Durant, OK
-
- 1Less than $100
- 30$100 to $149
- 86$150 to $199
- 73$200 to $249
- 40$250 to $299
- 54$300 to $349
- 89$350 to $399
- 214$400 to $449
- 150$450 to $499
- 306$500 to $549
- 306$550 to $599
- 190$600 to $649
- 334$650 to $699
- 359$700 to $749
- 279$750 to $799
- 563$800 to $899
- 289$900 to $999
- 386$1,000 to $1,249
- 129$1,250 to $1,499
- 74$1,500 to $1,999
- 4$2,500 to $2,999
- 158No cash rent
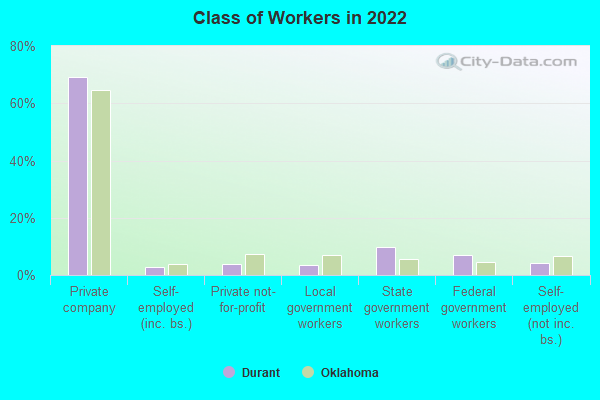
Percentage of workers working in this county: 86.2%
Number of people working at home: 406 (4.7% of all workers)
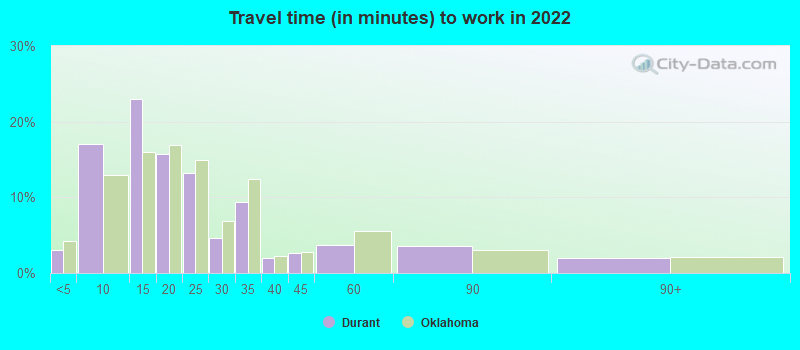
Travel time to work (commute)
- Less than 5 minutes: 411
- 5 to 9 minutes: 2,146
- 10 to 14 minutes: 2,401
- 15 to 19 minutes: 996
- 20 to 24 minutes: 744
- 25 to 29 minutes: 178
- 30 to 34 minutes: 591
- 35 to 39 minutes: 36
- 40 to 44 minutes: 146
- 45 to 59 minutes: 127
- 60 to 89 minutes: 203
- 90 or more minutes: 88
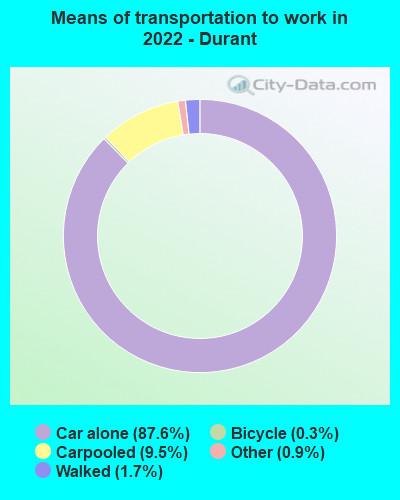
Means of transportation to work:
- Drove a car alone: 12,878 (83.8%)
- Carpooled: 1,431 (9.3%)
- Taxi: 121 (0.8%)
- Bicycle: 45 (0.3%)
- Walked: 251 (1.6%)
- Worked at home: 406 (2.6%)
- Unemployment by race in 2022
- Unemployment rate for White non-Hispanic residents
- 2.7%Males
- 3.8%Females
- Unemployment rate for Black residents
- 9.3%Males
- 5.7%Females
- Unemployment rate for American Indian and Alaska Native residents
- 8.9%Males
- 15.9%Females
- Unemployment rate for other race residents
- 6.9%Males
- 9.5%Females
- Unemployment rate for two or more race residents
- 4.0%Females
- Unemployment rate for Hispanic or Latino residents
- 5.1%Males
- 5.7%Females
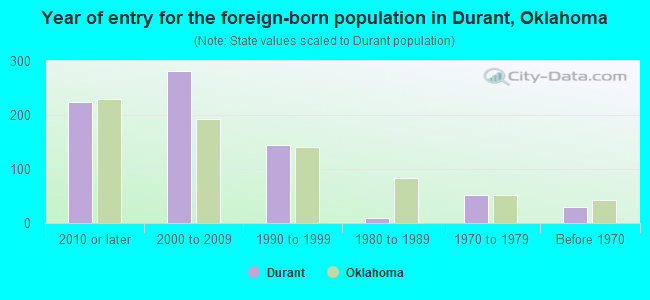
- Year of entry for the foreign-born population in Durant, Oklahoma
- 2242010 or later
- 2812000 to 2009
- 1451990 to 1999
- 91980 to 1989
- 511970 to 1979
- 30Before 1970
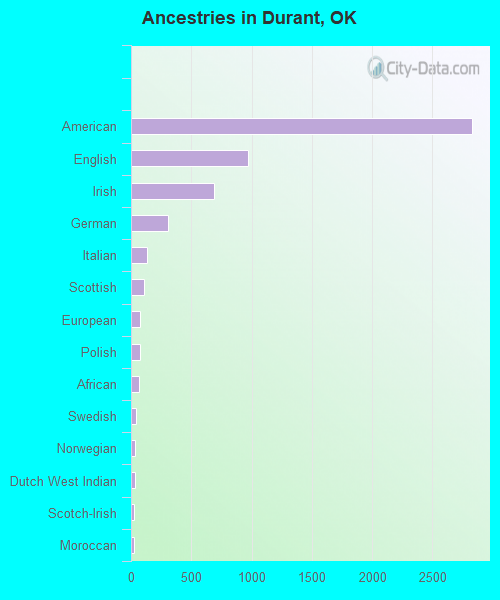
First ancestries reported:
- American: 2,828 (24.6%)
- English: 969 (8.4%)
- Irish: 687 (6.0%)
- German: 304 (2.6%)
- Italian: 132 (1.1%)
- Scottish: 110 (1.0%)
- European: 78 (0.7%)
- Polish: 74 (0.6%)
- African: 69 (0.6%)
- Swedish: 43 (0.4%)
- Norwegian: 34 (0.3%)
- Dutch West Indian: 31 (0.3%)
- Scotch-Irish: 29 (0.3%)
- Moroccan: 26 (0.2%)
- South African: 20 (0.2%)
- Dutch: 15 (0.1%)
- Australian: 13 (0.1%)
- Scandinavian: 11 (0.10%)
- French: 10 (0.09%)
- Finnish: 8 (0.07%)
- Northern European: 8 (0.07%)
- Russian: 6 (0.05%)
- Welsh: 6 (0.05%)
Most common places of birth for foreign-born residents (%):
| Durant: | 68.4% (491) |
| Oklahoma: | 42.4% (103,425) |
| Durant: | 5.3% (38) |
| Oklahoma: | 3.2% (7,698) |
| Durant: | 5.2% (37) |
| Oklahoma: | 0.5% (1,321) |
| Durant: | 4.2% (30) |
| Oklahoma: | 1.6% (3,824) |
| Durant: | 2.2% (16) |
| Oklahoma: | 5.6% (13,699) |
| Durant: | 2.2% (16) |
| Oklahoma: | 0.2% (599) |
| Durant: | 2.1% (15) |
| Oklahoma: | 0.3% (765) |
| Durant: | 1.8% (13) |
| Oklahoma: | 2.3% (5,671) |
| Durant: | 1.7% (12) |
| Oklahoma: | 2.3% (5,498) |
Place of birth for U.S.-born residents:
- This state: 8,994
- Other state: 9,253
- Northeast: 308
- Midwest: 965
- South: 6,125
- West: 1,824
79.4% of Durant residents lived in the same house 1 years ago.
Out of people who lived in different houses, 32.9% lived in this county.
Out of people who lived in different counties, 42.4% lived in Oklahoma.
| Durant: | 79.4% |
| State average: | 85.5% |
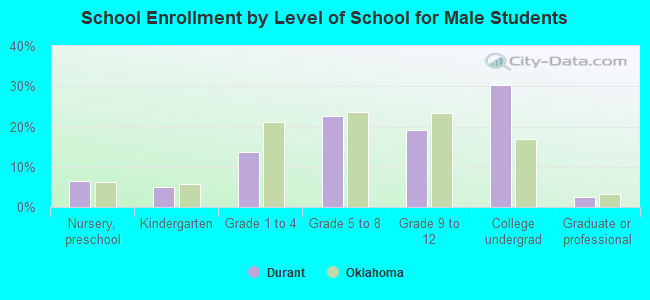
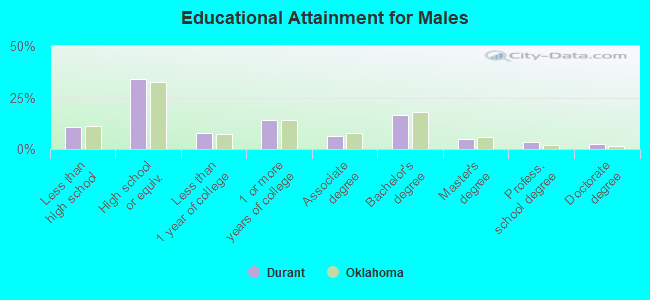
Education attainment for males 25 years and older:
- No schooling: 54
- Nursery to 4th grade: 2
- 5th and 6th grade: 76
- 7th and 8th grade: 82
- 9th grade: 103
- 10th grade: 77
- 11th grade: 161
- 12th grade, no diploma: 56
- High school graduate (or equivalency): 1,931
- Less than 1 year of college: 431
- Some college more than 1 year, no degree: 804
- Associate degree: 356
- Bachelor's degree: 931
- Master's degree: 284
- Professional school degree: 190
- Doctorate degree: 145
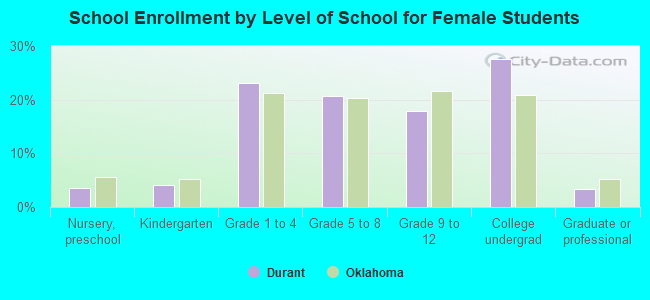
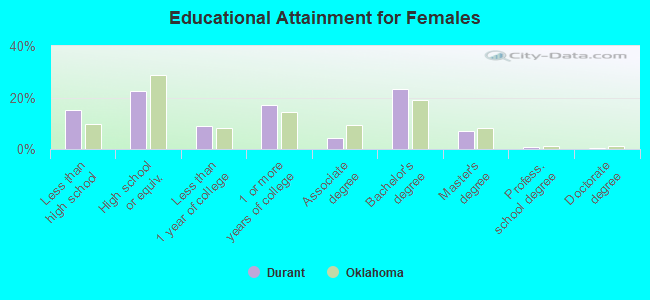
Education attainment for females 25 years and older:
- No schooling: 127
- Nursery to 4th grade: 29
- 5th and 6th grade: 48
- 7th and 8th grade: 77
- 9th grade: 165
- 10th grade: 230
- 11th grade: 205
- 12th grade, no diploma: 89
- High school graduate (or equivalency): 1,449
- Less than 1 year of college: 571
- Some college more than 1 year, no degree: 1,096
- Associate degree: 285
- Bachelor's degree: 1,502
- Master's degree: 451
- Professional school degree: 46
- Doctorate degree: 26


Housing units in structures:
- One, detached: 5,566
- One, attached: 140
- Two: 412
- 3 or 4: 325
- 5 to 9: 781
- 10 to 19: 455
- 20 to 49: 169
- 50 or more: 90
- Mobile homes: 241
Median worth of mobile homes: $20,830
Housing units lacking complete kitchen facilities in 2022: 3.8%
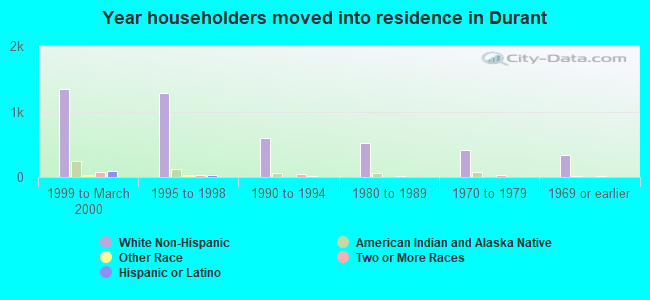
House/condo owner moved in on average 9 years ago
Renter moved in on average 1 years ago
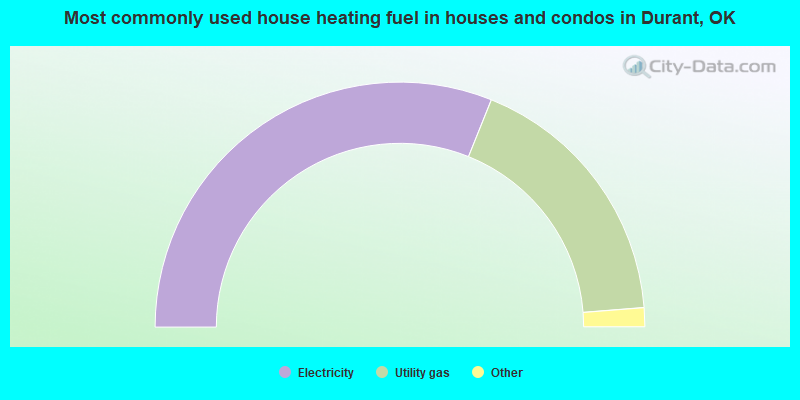
- 62.2%Electricity
- 35.3%Utility gas
- 2.1%Bottled, tank, or LP gas
- 0.2%Wood
- 0.2%No fuel used
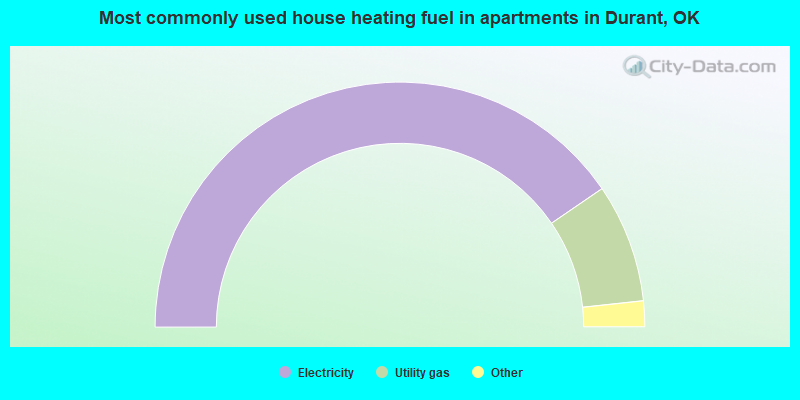
- 80.9%Electricity
- 15.7%Utility gas
- 1.7%Bottled, tank, or LP gas
- 1.5%No fuel used
- 0.2%Wood
Private vs. public school enrollment:
| Here: | 3.8% |
| Oklahoma: | 11.7% |
| Here: | 1.0% |
| Oklahoma: | 11.7% |
| Here: | 9.7% |
| Oklahoma: | 19.3% |