Drexel Heights, AZ (Arizona) Houses and Residents
| Drexel Heights: | $245,696 |
| Arizona: | $402,800 |
Mean price in 2022:
Detached houses: $257,742
Here: $257,742 State: $521,408 Townhouses or other attached units: $225,644
Here: $225,644 State: $387,465 Mobile homes: $144,091
Here: $144,091 State: $141,516 Occupied boats, RVs, vans, etc.: $15,789
Here: $15,789 State: $60,504
Total population: 27,749 (Urban population: 22,917, Rural population: 774 (all nonfarm))
Houses: 10,753 (9,974 occupied: 7,903 owner occupied, 2,202 renter occupied)
| % of renters here: | 22% |
| State: | 33% |
Housing density: 547 houses/condos per square mile
Median price asked for vacant for-sale houses and condos in 2022 in this county: $287,979.
Median contract rent in 2022: $978 (lower quartile is $658, upper quartile is $1,137)
Median rent asked for vacant for-rent units in 2022: $555
Median gross rent in Drexel Heights, AZ in 2022: $1,272
Housing units in Drexel Heights with a mortgage: 4,950 (182 second mortgage, 30 home equity loan, 105 both second mortgage and home equity loan)
Houses without a mortgage: 68
Median household income for houses/condos with a mortgage: $84,203
Median household income for apartments without a mortgage: $66,666
Median monthly housing costs: $1,095
Compare current foreclosures near Drexel Heights, AZ:
| Photo | Address | Area | Beds / Baths | Price | Details |
|---|---|---|---|---|---|

|
#1
E Blacklidge Dr Apt 721
Tucson, AZ 85719
|
389 sq. feet
|
1 baths 1 beds |
show details | |

|
#2
N Lyra Ln
Tucson, AZ 85742
|
1,513 sq. feet
|
3 baths 3 beds |
show details | |

|
#3
E Helen St
Tucson, AZ 85715
|
1,450 sq. feet
|
2 baths 4 beds |
show details | |

|
#4
N Fairview Ave
Tucson, AZ 85705
|
1,792 sq. feet
|
2 baths 4 beds |
show details | |

|
#5
N Camino Esplanade
Tucson, AZ 85750
|
1,975 sq. feet
|
2 baths 3 beds |
show details | |

|
#6
S San Rafael Dr
Tucson, AZ 85713
|
1,471 sq. feet
|
2 baths 4 beds |
show details | |

|
#7
S Avenida Santa Carolina
Tucson, AZ 85756
|
2,071 sq. feet
|
3 baths 4 beds |
show details | |

|
#8
N Sabino Creek Pl
Tucson, AZ 85750
|
2,569 sq. feet
|
3 baths 4 beds |
show details | |

|
#9
N Iroquois Ave
Tucson, AZ 85705
|
1,252 sq. feet
|
2 baths 4 beds |
show details | |

|
#10
E Lurlene Dr
Tucson, AZ 85730
|
2,293 sq. feet
|
2 baths 4 beds |
show details |
| Photo | Address | Area | Beds / Baths | Price | Details |
|---|---|---|---|---|---|

|
#11
W Eagle Heart Ct
Tucson, AZ 85757
|
3,443 sq. feet
|
4 baths 5 beds |
show details | |

|
#12
W Old Pecos Pl
Tucson, AZ 85743
|
1,749 sq. feet
|
2 baths 3 beds |
show details | |

|
#13
E Paseo Juan Tabo
Tucson, AZ 85747
|
1,408 sq. feet
|
2 baths 3 beds |
show details | |

|
#14
S Valley Stream Dr
Tucson, AZ 85757
|
1,750 sq. feet
|
2 baths 3 beds |
show details | |

|
#15
W Santa Rosa St
Tucson, AZ 85706
|
1,891 sq. feet
|
2 baths 4 beds |
show details | |

|
#16
W Camino Capria
Sahuarita, AZ 85629
|
- sq. feet
|
2 baths 3 beds |
show details | |

|
#17
W 34th St
Tucson, AZ 85713
|
1,469 sq. feet
|
2 baths 3 beds |
show details | |

|
#18
E Eastview Dr
Tucson, AZ 85710
|
1,972 sq. feet
|
2 baths 3 beds |
show details | |

|
#19
N Suwannee Dr
Tucson, AZ 85741
|
1,350 sq. feet
|
2 baths 3 beds |
show details | |

|
#20
W Avecenna St
Tucson, AZ 85757
|
1,538 sq. feet
|
2 baths 4 beds |
show details |
| Photo | Address | Area | Beds / Baths | Price | Details |
|---|---|---|---|---|---|

|
#21
S Birch Ave
Tucson, AZ 85730
|
1,313 sq. feet
|
2 baths 3 beds |
show details | |

|
#22
S Via Gualda
Sahuarita, AZ 85629
|
1,800 sq. feet
|
2 baths 4 beds |
show details | |

|
#23
W Calle Sancho Panza
Tucson, AZ 85757
|
2,094 sq. feet
|
2 baths 4 beds |
show details | |

|
#24
W King Rd
Tucson, AZ 85705
|
1,060 sq. feet
|
2 baths 3 beds |
show details | |

|
#25
W Foothills Blue Ln
Tucson, AZ 85741
|
1,954 sq. feet
|
2 baths 3 beds |
show details | |

|
#26
E Golf Links Rd
Tucson, AZ 85730
|
1,370 sq. feet
|
2 baths 3 beds |
show details | |

|
#27
S Downing Ave
Tucson, AZ 85756
|
1,428 sq. feet
|
2 baths 3 beds |
show details | |

|
#28
W High Ridge Dr
Tucson, AZ 85736
|
1,248 sq. feet
|
3 baths 2 beds |
show details | |

|
#29
N Warner Ter
Tucson, AZ 85705
|
1,369 sq. feet
|
3 baths 3 beds |
show details | |

|
#30
S Hunnic Dr
Tucson, AZ 85747
|
1,417 sq. feet
|
2 baths 3 beds |
show details |
| Photo | Address | Area | Beds / Baths | Price | Details |
|---|---|---|---|---|---|

|
#31
N Frannea Dr
Tucson, AZ 85712
|
1,894 sq. feet
|
2 baths 3 beds |
show details | |

|
#32
E Andrew St
Tucson, AZ 85711
|
920 sq. feet
|
1 baths 3 beds |
show details | |

|
#33
E Calle Orion
Tucson, AZ 85710
|
1,654 sq. feet
|
2 baths 3 beds |
show details | |

|
#34
S Missiondale Rd
Tucson, AZ 85756
|
1,169 sq. feet
|
2 baths 3 beds |
show details | |

|
#35
W Calle Marojo
Sahuarita, AZ 85629
|
2,575 sq. feet
|
2 baths 4 beds |
show details | |

|
#36
E Paseo Luisa
Tucson, AZ 85711
|
1,624 sq. feet
|
2 baths 3 beds |
show details | |

|
#37
W Calle Barranca Seca
Green Valley, AZ 85614
|
1,529 sq. feet
|
3 baths 4 beds |
show details | |

|
#38
W Matilda Dr
Tucson, AZ 85742
|
985 sq. feet
|
2 baths 2 beds |
show details | |

|
#39
S Redwater Dr
Tucson, AZ 85757
|
1,873 sq. feet
|
3 baths 4 beds |
show details | |

|
#40
S Camino Chepa
Sahuarita, AZ 85629
|
- sq. feet
|
3 baths 5 beds |
show details |
| Photo | Address | Area | Beds / Baths | Price | Details |
|---|---|---|---|---|---|

|
#41
S Black Moon Dr
Tucson, AZ 85730
|
1,140 sq. feet
|
2 baths 3 beds |
show details | |

|
#42
S Placita Del Barquero
Tucson, AZ 85747
|
1,956 sq. feet
|
2 baths 4 beds |
show details | |

|
#43
W Santa Luisa St
Tucson, AZ 85706
|
1,305 sq. feet
|
2 baths 3 beds |
show details | |

|
#44
W Lightstar Cir
Tucson, AZ 85756
|
1,456 sq. feet
|
2 baths 3 beds |
show details | |

|
#45
E Lee St
Tucson, AZ 85712
|
1,019 sq. feet
|
1 baths 3 beds |
show details | |

|
#46
S Liberty Ave
Tucson, AZ 85706
|
1,083 sq. feet
|
2 baths 3 beds |
show details | |

|
#47
S Desert Promenade Rd
Tucson, AZ 85735
|
1,873 sq. feet
|
2 baths 4 beds |
show details | |

|
#48
W District St
Tucson, AZ 85714
|
1,782 sq. feet
|
2 baths 4 beds |
show details | |

|
#49
S Wheaton Dr
Tucson, AZ 85747
|
1,921 sq. feet
|
2 baths 3 beds |
show details | |

|
Check over 1 million property listings on Foreclosure.com!
|
browse all offers | |||


 | Tucson and Rio Rico (24 replies) |
| Tell me about the area southwest of Tucson (2 replies) |
| Drexel Heights (5 replies) |
| Relocation advice for early 30's professional (8 replies) |
| Looking to relocate back to Tucson (15 replies) |
| Overview of neighborhoods in Tucson / surrounding area? (1 reply) |

Median year apartment built: 1987
Household type by relationship:
Households: 30,695- Male householders: 4,788 (943 living alone), Female householders: 5,150 (838 living alone)
4,879 spouses (4,867 opposite-sex spouses), 1,097 unmarried partners, (1,093 opposite-sex unmarried partners), 10,780 children (10,046 natural, 294 adopted, 440 stepchildren), 1,264 grandchildren, 337 brothers or sisters, 677 parents, 50 foster children, 545 other relatives, 970 non-relatives
- In group quarters: 151
Size of family households: 2,440 2-persons, 1,518 3-persons, 1,711 4-persons, 1,349 5-persons, 389 6-persons, 149 7-or-more-persons.
Size of nonfamily households: 1,881 1-person, 390 2-persons, 12 3-persons, 42 4-persons, 21 6-persons.
3,319 married couples with children.
2,739 single-parent households (789 men, 1,950 women).
45.7% of residents of Drexel Heights speak English at home.
52.4% of residents speak Spanish at home (81% speak English very well, 11% speak English well, 6% speak English not well, 2% don't speak English at all).
0.2% of residents speak other Indo-European language at home (89% speak English very well, 11% speak English not well).
0.3% of residents speak Asian or Pacific Island language at home (77% speak English very well, 5% speak English well, 19% speak English not well).
0.3% of residents speak other language at home (84% speak English very well, 16% speak English well).
Foreign born population: 4,821 (15.7%)
(64.4% of them are naturalized citizens)
| Here: | 6.0 |
| State: | 6.0 |
| Here: | 5.2 |
| State: | 4.1 |

- Bedrooms in owner-occupied houses and condos in Drexel Heights, Arizona
- 21no bedroom
- 1051 bedroom
- 1,2392 bedrooms
- 4,0553 bedrooms
- 2,1384 bedrooms
- 3465+ bedrooms

- Bedrooms in renter-occupied apartments in Drexel Heights, Arizona
- 21no bedroom
- 2361 bedroom
- 3292 bedrooms
- 1,0013 bedrooms
- 6164 bedrooms
- 05+ bedrooms

- Cars and other vehicles available in Drexel Heights in owner-occupied houses/condos
- 230no vehicle
- 1,6311 vehicle
- 2,6992 vehicles
- 1,8993 vehicles
- 7914 vehicles
- 6535+ vehicles

- Cars and other vehicles available in Drexel Heights in renter-occupied apartments
- 45no vehicle
- 7761 vehicle
- 8912 vehicles
- 3083 vehicles
- 1544 vehicles
- 285+ vehicles

- Rooms in owner-occupied houses in Drexel Heights, Arizona
- 211 room
- 352 rooms
- 2783 rooms
- 6464 rooms
- 1,8565 rooms
- 2,1706 rooms
- 1,4677 rooms
- 6128 rooms
- 8209+ rooms

- Rooms in renter-occupied apartments in Drexel Heights, Arizona
- 211 room
- 512 rooms
- 1783 rooms
- 3974 rooms
- 6975 rooms
- 4936 rooms
- 2867 rooms
- 278 rooms
- 539+ rooms


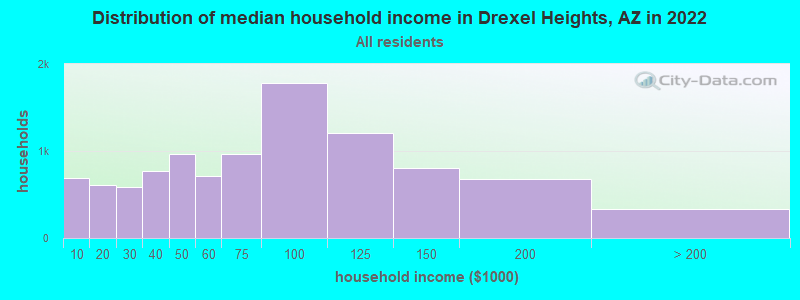
Drexel Heights, AZ household income distribution

- 695Less than $10,000
- 606$10,000 to $19,999
- 586$20,000 to $29,999
- 773$30,000 to $39,999
- 971$40,000 to $49,999
- 707$50,000 to $59,999
- 968$60,000 to $74,999
- 1,782$75,000 to $99,999
- 1,206$100,000 to $124,999
- 803$125,000 to $149,999
- 678$150,000 to $199,999
- 338$200,000 or more
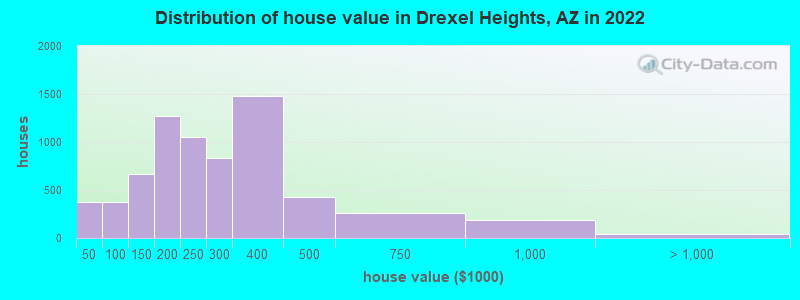
Home value of owner - occupied houses in 2022 in Drexel Heights, AZ
-
- 186Less than $10,000
- 25$10,000 to $14,999
- 25$15,000 to $19,999
- 10$20,000 to $24,999
- 47$25,000 to $29,999
- 54$30,000 to $34,999
- 30$40,000 to $49,999
- 83$50,000 to $59,999
- 86$60,000 to $69,999
- 56$70,000 to $79,999
- 43$80,000 to $89,999
- 72$90,000 to $99,999
- 389$100,000 to $124,999
- 272$125,000 to $149,999
- 656$150,000 to $174,999
- 608$175,000 to $199,999
- 1,053$200,000 to $249,999
- 835$250,000 to $299,999
- 1,478$300,000 to $399,999
- 430$400,000 to $499,999
- 261$500,000 to $749,999
- 186$750,000 to $999,999
- 14$1,000,000 to $1,499,999
- 28$2,000,000 or more
Rent paid by renters in 2022 in Drexel Heights, AZ
-
- 50$200 to $249
- 27$350 to $399
- 50$400 to $449
- 106$450 to $499
- 16$500 to $549
- 112$550 to $599
- 81$600 to $649
- 15$700 to $749
- 127$750 to $799
- 248$800 to $899
- 430$900 to $999
- 271$1,000 to $1,249
- 235$1,250 to $1,499
- 50$1,500 to $1,999
- 176No cash rent


Percentage of workers working in this county: 97.8%
Number of people working at home: 1,563 (11.2% of all workers)
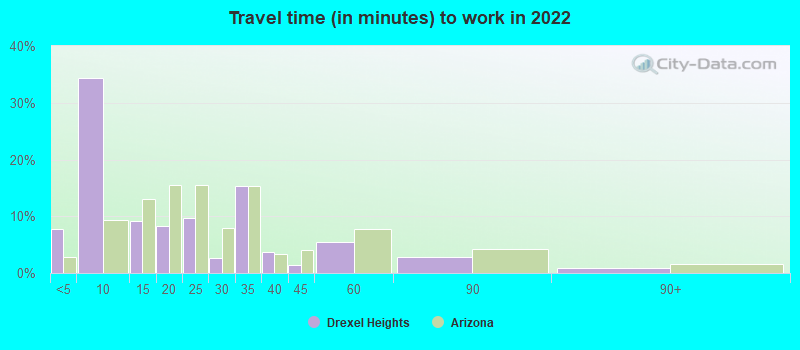
Travel time to work (commute)
- Less than 5 minutes: 224
- 5 to 9 minutes: 917
- 10 to 14 minutes: 837
- 15 to 19 minutes: 1,742
- 20 to 24 minutes: 2,206
- 25 to 29 minutes: 826
- 30 to 34 minutes: 2,805
- 35 to 39 minutes: 369
- 40 to 44 minutes: 565
- 45 to 59 minutes: 1,176
- 60 to 89 minutes: 333
- 90 or more minutes: 268
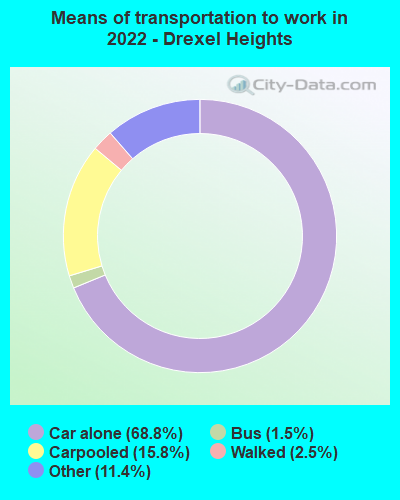
Means of transportation to work:
- Drove a car alone: 1,251 (39.6%)
- Carpooled: 298 (9.4%)
- Bus: 19 (0.6%)
- Taxi: 175 (5.5%)
- Walked: 55 (1.7%)
- Worked at home: 1,563 (49.5%)

- Unemployment by race in 2022
- Unemployment rate for White non-Hispanic residents
- 2.8%Males
- 2.5%Females
- Unemployment rate for Black residents
- 14.7%Males
- Unemployment rate for American Indian and Alaska Native residents
- 11.5%Females
- Unemployment rate for Asian residents
- 26.4%Females
- Unemployment rate for other race residents
- 5.1%Males
- 3.0%Females
- Unemployment rate for two or more race residents
- 7.5%Males
- Unemployment rate for Hispanic or Latino residents
- 5.2%Males
- 1.5%Females

- Year of entry for the foreign-born population in Drexel Heights, Arizona
- 5882010 or later
- 9642000 to 2009
- 8161990 to 1999
- 8601980 to 1989
- 6301970 to 1979
- 768Before 1970
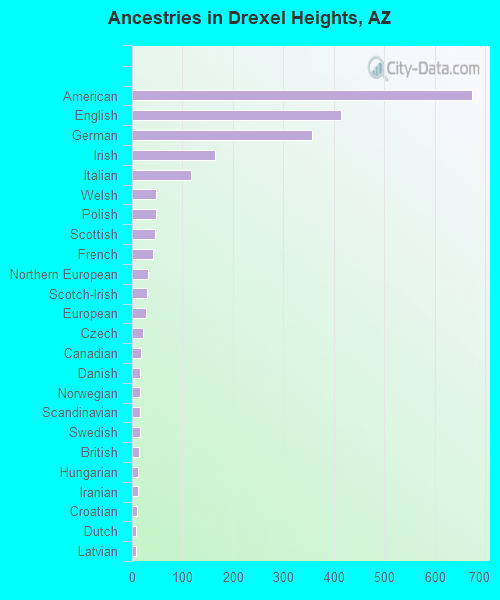
First ancestries reported:
- American: 674 (3.2%)
- English: 414 (1.9%)
- German: 357 (1.7%)
- Irish: 164 (0.8%)
- Italian: 116 (0.5%)
- Welsh: 48 (0.2%)
- Polish: 47 (0.2%)
- Scottish: 45 (0.2%)
- French: 42 (0.2%)
- Northern European: 32 (0.2%)
- Scotch-Irish: 29 (0.1%)
- European: 27 (0.1%)
- Czech: 21 (0.10%)
- Canadian: 18 (0.08%)
- Danish: 16 (0.08%)
- Norwegian: 15 (0.07%)
- Scandinavian: 15 (0.07%)
- Swedish: 15 (0.07%)
- British: 13 (0.06%)
- Hungarian: 12 (0.06%)
- Iranian: 11 (0.05%)
- Croatian: 9 (0.04%)
- Dutch: 8 (0.04%)
- Latvian: 8 (0.04%)
- Greek: 4 (0.02%)
- Yugoslavian: 4 (0.02%)
- French Canadian: 3 (0.01%)
- British West Indian: 2 (0.01%)
Most common places of birth for foreign-born residents (%):
| Drexel Heights: | 88.9% (4,494) |
| Arizona: | 53.4% (500,086) |
| Drexel Heights: | 2.6% (129) |
| Arizona: | 0.4% (3,511) |
Place of birth for U.S.-born residents:
- This state: 19,789
- Other state: 5,767
- Northeast: 702
- Midwest: 1,418
- South: 1,039
- West: 2,638
92.6% of Drexel Heights residents lived in the same house 1 years ago.
Out of people who lived in different houses, 41.7% lived in this county.
Out of people who lived in different counties, 27.6% lived in Arizona.
| Drexel Heights: | 92.6% |
| State average: | 86.0% |
Education attainment for males 25 years and older:
- No schooling: 146
- Nursery to 4th grade: 52
- 5th and 6th grade: 102
- 7th and 8th grade: 112
- 9th grade: 118
- 10th grade: 250
- 11th grade: 345
- 12th grade, no diploma: 317
- High school graduate (or equivalency): 3,046
- Less than 1 year of college: 995
- Some college more than 1 year, no degree: 1,567
- Associate degree: 1,077
- Bachelor's degree: 1,085
- Master's degree: 394
- Professional school degree: 13
- Doctorate degree: 71

Education attainment for females 25 years and older:
- No schooling: 152
- Nursery to 4th grade: 80
- 5th and 6th grade: 241
- 7th and 8th grade: 164
- 9th grade: 114
- 10th grade: 89
- 11th grade: 193
- 12th grade, no diploma: 459
- High school graduate (or equivalency): 2,602
- Less than 1 year of college: 764
- Some college more than 1 year, no degree: 1,977
- Associate degree: 942
- Bachelor's degree: 1,036
- Master's degree: 430
- Professional school degree: 70
- Doctorate degree: 46


Housing units in structures:
- One, detached: 7,673
- One, attached: 151
- Two: 30
- 3 or 4: 30
- 10 to 19: 78
- 50 or more: 103
- Mobile homes: 2,629
- Boats, RVs, vans, etc.: 56
Median worth of mobile homes: $132,574
Housing units lacking complete kitchen facilities in 2022: 2.1%
House/condo owner moved in on average 14 years ago
Renter moved in on average 4 years ago

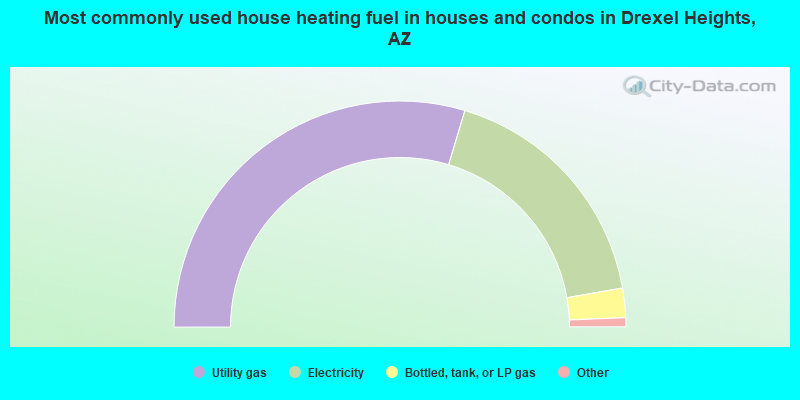
- 59.3%Utility gas
- 35.2%Electricity
- 4.2%Bottled, tank, or LP gas
- 0.7%Solar energy
- 0.3%No fuel used
- 0.2%Wood
- 0.1%Other fuel
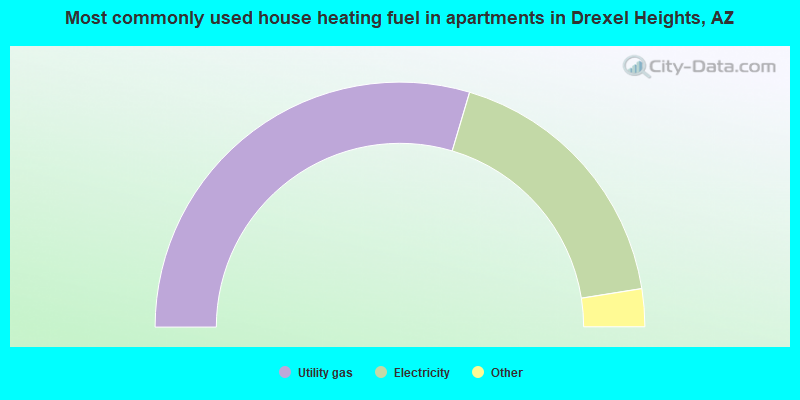
- 59.2%Utility gas
- 35.8%Electricity
- 2.9%Bottled, tank, or LP gas
- 1.1%Wood
- 1.1%No fuel used
Private vs. public school enrollment:
| Here: | 4.2% |
| Arizona: | 10.4% |
| Here: | 19.5% |
| Arizona: | 8.8% |
| Here: | 13.4% |
| Arizona: | 13.1% |


