Crestwood Village, NJ (New Jersey) Houses and Residents
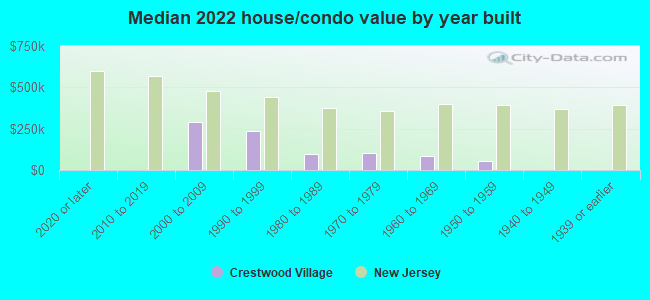
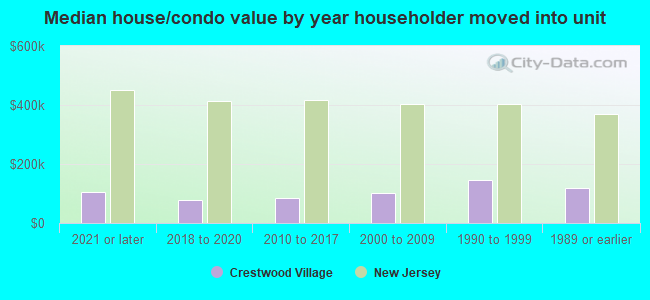
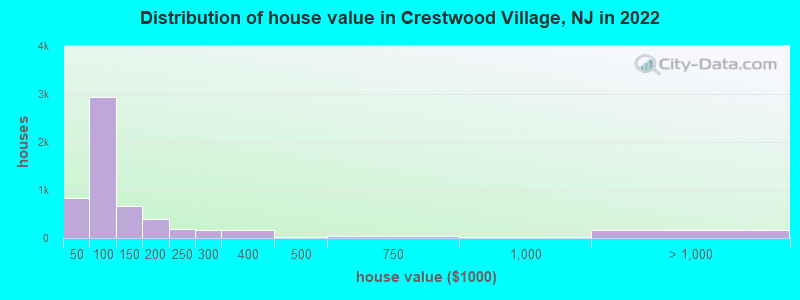
Estimated median house or condo value in 2022: $94,657 (it was $47,200 in 2000 )
Crestwood Village:
$94,657New Jersey:
$428,900
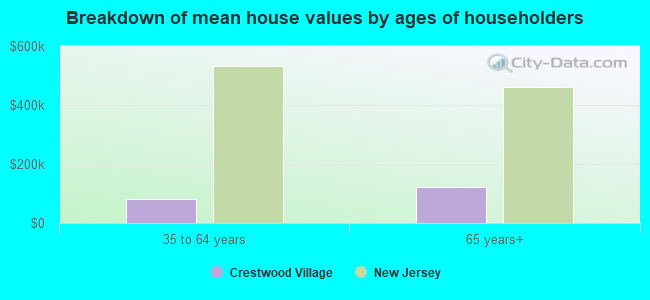
Lower value quartile - upper value quartile: $64,048 - $178,467Mean price in 2022: Detached houses: $234,642 Here:
$234,642State:
$537,591
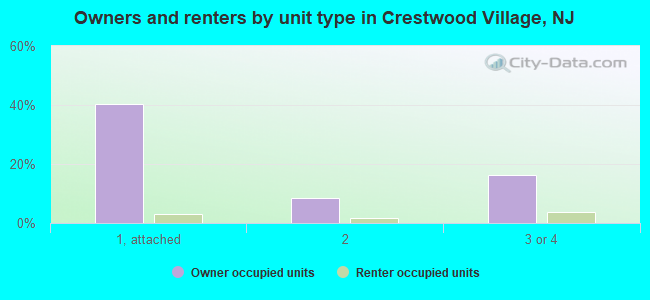
Townhouses or other attached units: $109,499 Here:
$109,499State:
$381,113
In 2-unit structures: $135,794 Here:
$135,794State:
$444,476
In 3-to-4-unit structures: $119,080 Here:
$119,080State:
$457,463
In 5-or-more-unit structures: $133,295 Here:
$133,295State:
$368,745
Total population: 7,907 (All urban)
Houses: 7,021 (6,014 occupied: 5,340 owner occupied, 701 renter occupied )
% of renters here:
12%State:
35%
Housing density: 1,598 houses/condos per square mile
Median price asked for vacant for-sale houses and condos in 2022: $280,801.
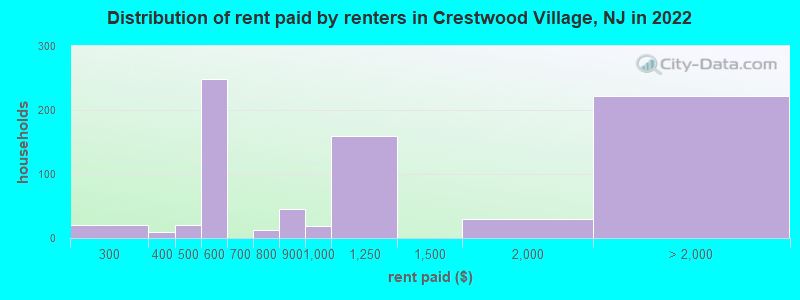
Median contract rent in 2022: $995
Median rent asked for vacant for-rent units in 2022: $337
Median gross rent in Crestwood Village, NJ in 2022: $1,128
Housing units in Crestwood Village with a mortgage: 865 (54 second mortgage, 10 home equity loan, 32 both second mortgage and home equity loan )Houses without a mortgage: 135
Median household income for houses/condos with a mortgage: $54,662
Median household income for apartments without a mortgage: $34,028
Median monthly housing costs: $517
Data:
Median house or condo value ($)
Median house or condo value ($ change since 2000)
Median house or condo value ($) - White
Median house or condo value ($) - Black or African American
Median house or condo value ($) - Asian
Median house or condo value ($) - Hispanic or Latino
Median house or condo value ($) - American Indian and Alaska Native
Median house or condo value ($) - Multirace
Median house or condo value ($) - Other Race
Median price asked for mobile homes ($)
Household density (households per square mile)
Mean house or condo value by units in structure - 1, detached ($)
Mean house or condo value by units in structure - 1, attached ($)
Mean house or condo value by units in structure - 2 ($)
Mean house or condo value by units in structure by units in structure - 3 or 4 ($)
Mean house or condo value by units in structure - 5 or more ($)
Mean house or condo value by units in structure - Boat, RV, van, etc. ($)
Mean house or condo value by units in structure - Mobile home ($)
Median contract rent ($)
Median contract rent - Lower quartile ($)
Median contract rent - Upper quartile ($)
Median gross rent ($)
Urban houses (%)
Rural houses (%)
Houses occupied (%)
Houses occupied (% change since 2000)
Houses owner occupied (%)
Houses owner occupied (% change since 2000)
Houses renter occupied (%)
Houses renter occupied (% change since 2000)
Vacant housing units - For rent (%)
Vacant housing units - For rent (% change since 2000)
Vacant housing units - For sale only (%)
Vacant housing units - For sale only (% change since 2000)
Vacant housing units - Rented or sold, not occupied (%)
Vacant housing units - Rented or sold, not occupied (% change since 2000)
Vacant housing units - For seasonal, recreational, or occasional use (%)
Vacant housing units - For seasonal, recreational, or occasional use (% change since 2000)
Vacant housing units - For migrant workers (%)
Vacant housing units - For migrant workers (% change since 2000)
Vacant housing units - Other vacant (%)
Vacant housing units - Other vacant (% change since 2000)
Median monthly housing costs ($)
Median household income for houses/condos with a mortgage ($)
Median household income for houses/condos without a mortgage ($)
Median household income ($)
Median household income ($) - White
Median household income ($) - Black or African American
Median household income ($) - Asian
Median household income ($) - Hispanic or Latino
Median household income ($) - American Indian and Alaska Native
Median household income ($) - Multirace
Median household income ($) - Other Race
Mortgage status - with mortgage (%)
Mortgage status - with second mortgage (%)
Mortgage status - with home equity loan (%)
Mortgage status - with both second mortgage and home equity loan (%)
Mortgage status - without a mortgage (%)
Median year house/condo built
Median year apartment built
Household type by relationship - Male householder living alone (%)
Household type by relationship - Male householder not living alone (%)
Household type by relationship - Female householder living alone (%)
Household type by relationship - Female householder not living alone (%)
Household type by relationship - Opposite-Sex spouse (%)
Household type by relationship - Same-Sex spouse (%)
Household type by relationship - Opposite-Sex unmarried partner (%)
Household type by relationship - Same-Sex unmarried partner (%)
Household type by relationship - In group quarters (%)
Size of family households - 2-person household (%)
Size of family households - 3-person household (%)
Size of family households - 4-person household (%)
Size of family households - 5-person household (%)
Size of family households - 6-person household (%)
Size of family households - 7-or-more-person household (%)
Size of nonfamily households - 1-person household (%)
Size of nonfamily households - 2-person household (%)
Size of nonfamily households - 3-person household (%)
Size of nonfamily households - 4-person household (%)
Size of nonfamily households - 5-person household (%)
Size of nonfamily households - 6-person household (%)
Size of nonfamily households - 7-or-moreperson household (%)
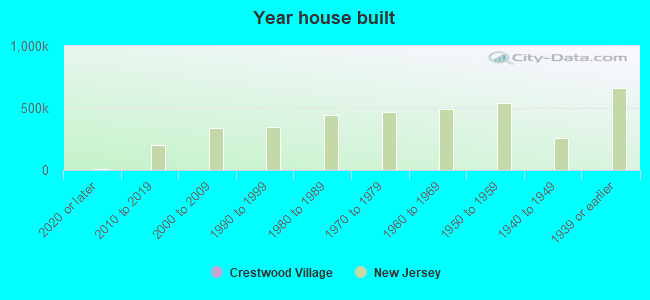
Year house built - Built 2010 or later (%)
Year house built - Built 2000 to 2009 (%)
Year house built - Built 1990 to 1999 (%)
Year house built - Built 1980 to 1989 (%)
Year house built - Built 1970 to 1979 (%)
Year house built - Built 1960 to 1969 (%)
Year house built - Built 1950 to 1959 (%)
Year house built - Built 1940 to 1949 (%)
Year house built - Built 1939 or earlier (%)
Median number of rooms in houses and condos
Median number of rooms in apartments
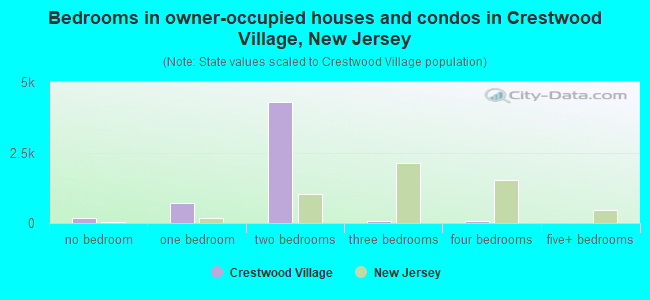
Median number of bedrooms in owner occupied houses
Mean number of bedrooms in owner occupied houses
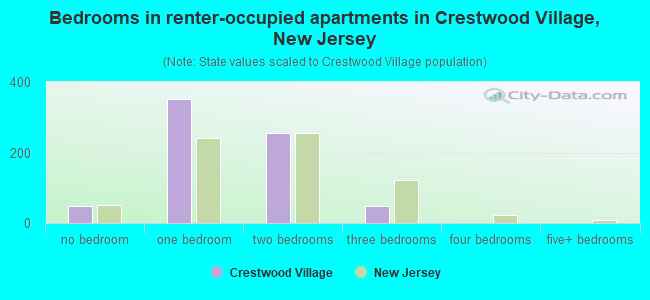
Median number of bedrooms in renter occupied houses
Mean number of bedrooms in renter occupied houses
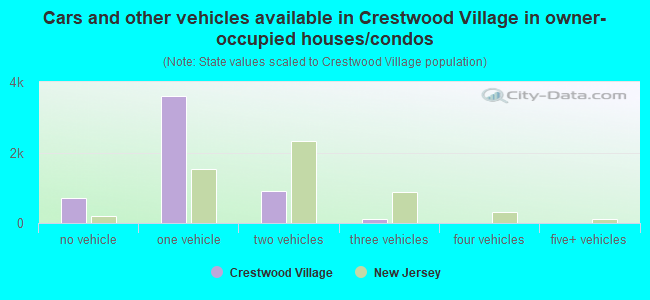
Median number of vehichles in owner occupied houses
Mean number of vehichles in owner occupied houses
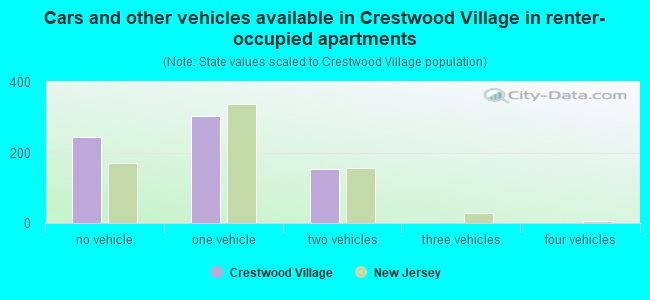
Median number of vehichles in renter occupied houses
Mean number of vehichles in renter occupied houses
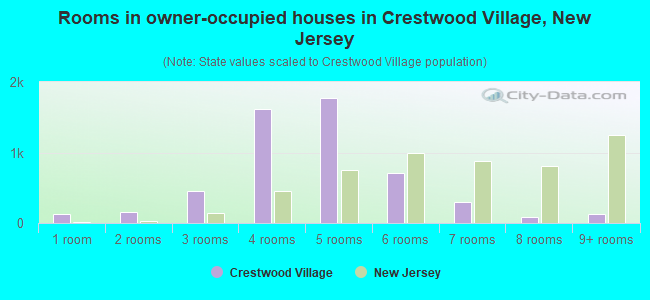
Rooms in owner-occupied houses - 1 room (%)
Rooms in owner-occupied houses - 2 rooms (%)
Rooms in owner-occupied houses - 3 rooms (%)
Rooms in owner-occupied houses - 4 rooms (%)
Rooms in owner-occupied houses - 5 rooms (%)
Rooms in owner-occupied houses - 6 rooms (%)
Rooms in owner-occupied houses - 7 rooms (%)
Rooms in owner-occupied houses - 8 rooms (%)
Rooms in owner-occupied houses - 9+ rooms (%)
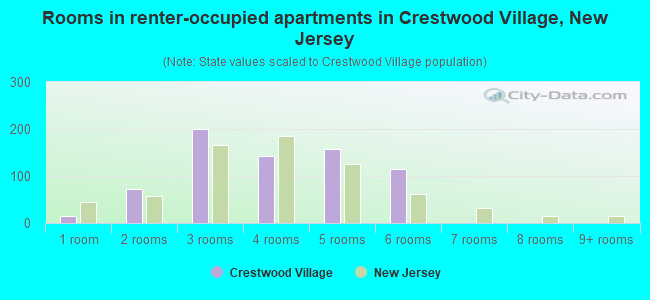
Rooms in renter-occupied houses - 1 room (%)
Rooms in renter-occupied houses - 2 rooms (%)
Rooms in renter-occupied houses - 3 rooms (%)
Rooms in renter-occupied houses - 4 rooms (%)
Rooms in renter-occupied houses - 5 rooms (%)
Rooms in renter-occupied houses - 6 rooms (%)
Rooms in renter-occupied houses - 7 rooms (%)
Rooms in renter-occupied houses - 8 rooms (%)
Rooms in renter-occupied houses - 9+ rooms (%)
Bedrooms in owner-occupied houses - no bedrooms (%)
Bedrooms in owner-occupied houses - 1 bedroom (%)
Bedrooms in owner-occupied houses - 2 bedrooms (%)
Bedrooms in owner-occupied houses - 3 bedrooms (%)
Bedrooms in owner-occupied houses - 4 bedrooms (%)
Bedrooms in owner-occupied houses - 5+ bedrooms (%)
Bedrooms in renter-occupied houses - no bedrooms (%)
Bedrooms in renter-occupied houses - 1 bedroom (%)
Bedrooms in renter-occupied houses - 2 bedrooms (%)
Bedrooms in renter-occupied houses - 3 bedrooms (%)
Bedrooms in renter-occupied houses - 4 bedrooms (%)
Bedrooms in renter-occupied houses - 5+ bedrooms (%)
Vehicles available in owner-occupied houses - no vehicle available (%)
Vehicles available in owner-occupied houses - 1 vehicle available(%)
Vehicles available in owner-occupied houses - 2 Vehicles available (%)
Vehicles available in owner-occupied houses - 3 Vehicles available (%)
Vehicles available in owner-occupied houses - 4 Vehicles available (%)
Vehicles available in owner-occupied houses - 5+ Vehicles available (%)
Vehicles available in renter-occupied houses - no vehicle available (%)
Vehicles available in renter-occupied houses - 1 vehicle available (%)
Vehicles available in renter-occupied houses - 2 Vehicles available (%)
Vehicles available in renter-occupied houses - 3 Vehicles available (%)
Vehicles available in renter-occupied houses - 4 Vehicles available (%)
Vehicles available in renter-occupied houses - 5+ Vehicles available (%)
Housing units in structures - 1, detached (%)
Housing units in structures - 1, attached (%)
Housing units in structures - 2 (%)
Housing units in structures - 3 or 4 (%)
Housing units in structures - 5 to 9 (%)
Housing units in structures - 10 to 19 (%)
Housing units in structures - 20 to 49 (%)
Housing units in structures - 50 or more (%)
Housing units in structures - Mobile home (%)
Housing units in structures - Boat, RV, van, etc. (%)
Housing units in structures - Owners - 1, detached (%)
Housing units in structures - Owners - 1, attached (%)
Housing units in structures - Owners - 2 (%)
Housing units in structures - Owners - 3 or 4 (%)
Housing units in structures - Owners - 5 to 9 (%)
Housing units in structures - Owners - 10 to 19 (%)
Housing units in structures - Owners - 20 to 49 (%)
Housing units in structures - Owners - 50 or more (%)
Housing units in structures - Owners - Mobile home (%)
Housing units in structures - Owners - Boat, RV, van, etc. (%)
Housing units in structures - Renters - 1, detached (%)
Housing units in structures - Renters - 1, attached (%)
Housing units in structures - Renters - 2 (%)
Housing units in structures - Renters - 3 or 4 (%)
Housing units in structures - Renters - 5 to 9 (%)
Housing units in structures - Renters - 10 to 19 (%)
Housing units in structures - Renters - 20 to 49 (%)
Housing units in structures - Renters - 50 or more (%)
Housing units in structures - Renters - Mobile home (%)
Housing units in structures - Renters - Boat, RV, van, etc. (%)
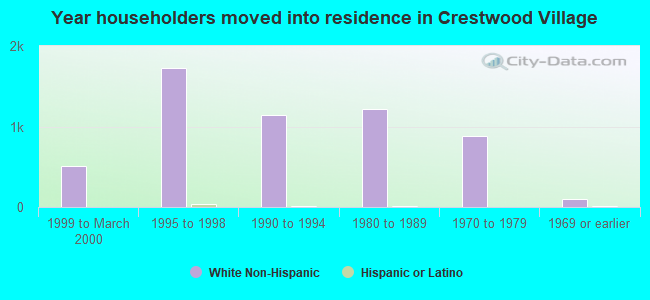
House/condo owner moved in on average (years ago)
Renter moved in on average (years ago)
Year householder moved into unit - Moved in 1999 to March 2000 (%)
Year householder moved into unit - Moved in 1999 to March 2000 (%) - White
Year householder moved into unit - Moved in 1999 to March 2000 (%) - Black or African American
Year householder moved into unit - Moved in 1999 to March 2000 (%) - Asian
Year householder moved into unit - Moved in 1999 to March 2000 (%) - Hispanic or Latino
Year householder moved into unit - Moved in 1999 to March 2000 (%) - American Indian and Alaska Native
Year householder moved into unit - Moved in 1999 to March 2000 (%) - Multirace
Year householder moved into unit - Moved in 1999 to March 2000 (%) - Other Race
Year householder moved into unit - Moved in 1995 to 1998 (%)
Year householder moved into unit - Moved in 1995 to 1998 (%) - White
Year householder moved into unit - Moved in 1995 to 1998 (%) - Black or African American
Year householder moved into unit - Moved in 1995 to 1998 (%) - Asian
Year householder moved into unit - Moved in 1995 to 1998 (%) - Hispanic or Latino
Year householder moved into unit - Moved in 1995 to 1998 (%) - American Indian and Alaska Native
Year householder moved into unit - Moved in 1995 to 1998 (%) - Multirace
Year householder moved into unit - Moved in 1995 to 1998 (%) - Other Race
Year householder moved into unit - Moved in 1990 to 1994 (%)
Year householder moved into unit - Moved in 1990 to 1994 (%) - White
Year householder moved into unit - Moved in 1990 to 1994 (%) - Black or African American
Year householder moved into unit - Moved in 1990 to 1994 (%) - Asian
Year householder moved into unit - Moved in 1990 to 1994 (%) - Hispanic or Latino
Year householder moved into unit - Moved in 1990 to 1994 (%) - American Indian and Alaska Native
Year householder moved into unit - Moved in 1990 to 1994 (%) - Multirace
Year householder moved into unit - Moved in 1990 to 1994 (%) - Other Race
Year householder moved into unit - Moved in 1980 to 1989 (%)
Year householder moved into unit - Moved in 1980 to 1989 (%) - White
Year householder moved into unit - Moved in 1980 to 1989 (%) - Black or African American
Year householder moved into unit - Moved in 1980 to 1989 (%) - Asian
Year householder moved into unit - Moved in 1980 to 1989 (%) - Hispanic or Latino
Year householder moved into unit - Moved in 1980 to 1989 (%) - American Indian and Alaska Native
Year householder moved into unit - Moved in 1980 to 1989 (%) - Multirace
Year householder moved into unit - Moved in 1980 to 1989 (%) - Other Race
Year householder moved into unit - Moved in 1970 to 1979 (%)
Year householder moved into unit - Moved in 1970 to 1979 (%) - White
Year householder moved into unit - Moved in 1970 to 1979 (%) - Black or African American
Year householder moved into unit - Moved in 1970 to 1979 (%) - Asian
Year householder moved into unit - Moved in 1970 to 1979 (%) - Hispanic or Latino
Year householder moved into unit - Moved in 1970 to 1979 (%) - American Indian and Alaska Native
Year householder moved into unit - Moved in 1970 to 1979 (%) - Multirace
Year householder moved into unit - Moved in 1970 to 1979 (%) - Other Race
Year householder moved into unit - Moved in 1969 or earlier (%)
Year householder moved into unit - Moved in 1969 or earlier (%) - White
Year householder moved into unit - Moved in 1969 or earlier (%) - Black or African American
Year householder moved into unit - Moved in 1969 or earlier (%) - Asian
Year householder moved into unit - Moved in 1969 or earlier (%) - Hispanic or Latino
Year householder moved into unit - Moved in 1969 or earlier (%) - American Indian and Alaska Native
Year householder moved into unit - Moved in 1969 or earlier (%) - Multirace
Year householder moved into unit - Moved in 1969 or earlier (%) - Other Race
Housing units lacking complete plumbing facilities (%)
Housing units lacking complete kitchen facilities (%)
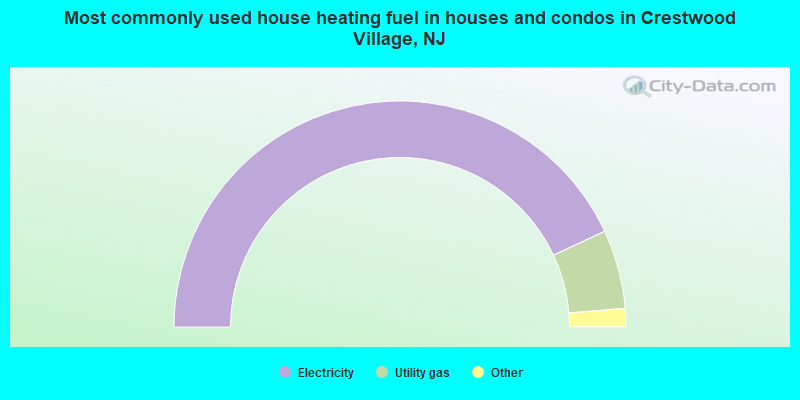
House heating fuel used in houses and condos - Utility gas (%)
House heating fuel used in houses and condos - Bottled, tank, or LP gas (%)
House heating fuel used in houses and condos - Electricity (%)
House heating fuel used in houses and condos - Fuel oil, kerosene, etc. (%)
House heating fuel used in houses and condos - Coal or coke (%)
House heating fuel used in houses and condos - Wood (%)
House heating fuel used in houses and condos - Solar energy (%)
House heating fuel used in houses and condos - Other fuel (%)
House heating fuel used in houses and condos - No fuel used (%)
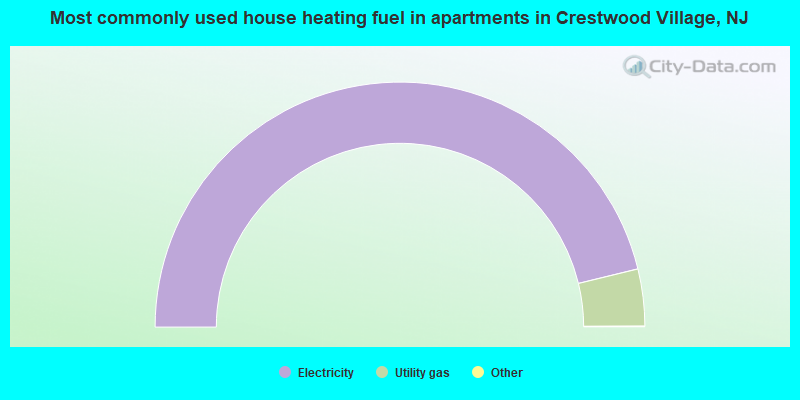
House heating fuel used in apartments - Utility gas (%)
House heating fuel used in apartments - Bottled, tank, or LP gas (%)
House heating fuel used in apartments - Electricity (%)
House heating fuel used in apartments - Fuel oil, kerosene, etc. (%)
House heating fuel used in apartments - Coal or coke (%)
House heating fuel used in apartments - Wood (%)
House heating fuel used in apartments - Solar energy (%)
House heating fuel used in apartments - Other fuel (%)
House heating fuel used in apartments - No fuel used (%)
Median year house/condo built: 1975Median year apartment built: 1982Household type by relationship:
Households: 8,705
Male householders: 2,448 (1,204 living alone ), Female householders: 3,689 (2,744 living alone )1,528 spouses (1,491 opposite-sex spouses ), 132 unmarried partners , (132 opposite-sex unmarried partners ), 422 children (386 natural , 19 adopted , 17 stepchildren ), 96 grandchildren , 140 brothers or sisters , 65 parents , 0 foster children , 33 other relatives , 80 non-relatives In group quarters: 65
Size of family households: 1,900 2-persons , 175 3-persons .
Size of nonfamily households: 3,657 1-person , 141 2-persons , 14 4-persons .
90,630 married couples with children. single-parent households (4,572 men , 14,696 women ).
91.5% of residents of Crestwood Village speak English at home. of residents speak Spanish at home (100% speak English very well ).of residents speak other Indo-European language at home (84% speak English very well , 12% speak English well , 5% speak English not well ).of residents speak Asian or Pacific Island language at home (35% speak English very well , 43% speak English well , 22% speak English not well ).of residents speak other language at home (100% speak English very well ).
Foreign born population: 664 (7.6%)of them are naturalized citizens )
Median number of rooms in houses and condos:
Median number of rooms in apartments
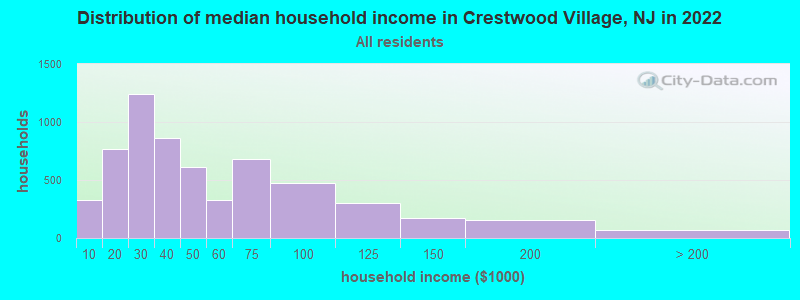
Crestwood Village, NJ household income distribution 324 Less than $10,000771 $10,000 to $19,9991,242 $20,000 to $29,999859 $30,000 to $39,999608 $40,000 to $49,999328 $50,000 to $59,999680 $60,000 to $74,999471 $75,000 to $99,999305 $100,000 to $124,999170 $125,000 to $149,999153 $150,000 to $199,99972 $200,000 or more
Home value of owner - occupied houses in 2022 in Crestwood Village, NJ 87 Less than $10,00044 $10,000 to $14,9999 $15,000 to $19,99937 $20,000 to $24,99942 $25,000 to $29,999249 $30,000 to $34,99928 $35,000 to $39,999341 $40,000 to $49,999680 $50,000 to $59,999722 $60,000 to $69,999347 $70,000 to $79,999465 $80,000 to $89,999384 $90,000 to $99,999434 $100,000 to $124,999235 $125,000 to $149,999284 $150,000 to $174,999110 $175,000 to $199,999183 $200,000 to $249,999176 $250,000 to $299,999176 $300,000 to $399,99911 $400,000 to $499,99937 $500,000 to $749,99920 $750,000 to $999,999133 $1,000,000 to $1,499,99926 $2,000,000 or moreRent paid by renters in 2022 in Crestwood Village, NJ 21 $200 to $2499 $300 to $34920 $400 to $449249 $500 to $54911 $700 to $74945 $800 to $89917 $900 to $999160 $1,000 to $1,24929 $1,500 to $1,99912 $2,500 to $2,99996 $3,000 to $3,49941 $3,500 or more71 No cash rent
Percentage of workers working in this county: 84.7%Number of people working at home: 193 (11.8% of all workers )
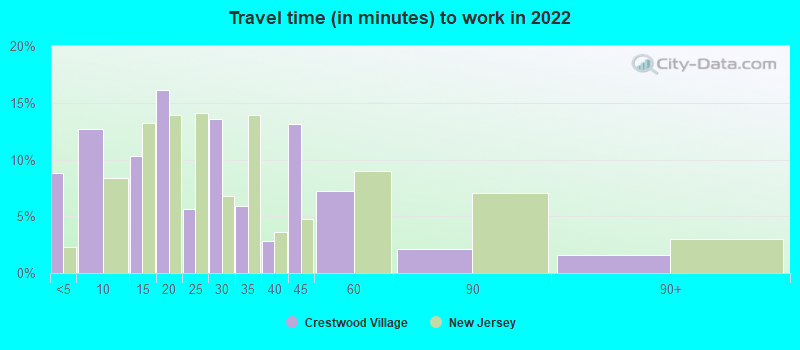
Travel time to work (commute)
Less than 5 minutes: 165 to 9 minutes: 17910 to 14 minutes: 12315 to 19 minutes: 10620 to 24 minutes: 22925 to 29 minutes: 7130 to 34 minutes: 38735 to 39 minutes: 040 to 44 minutes: 3645 to 59 minutes: 15860 to 89 minutes: 12190 or more minutes: 27
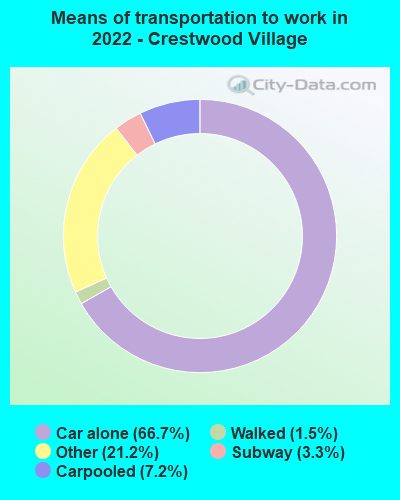
Means of transportation to work:
Drove a car alone: 706 (55.6%)Carpooled: 86 (6.8%)Long-distance train or commuter rail : 34 (2.7%)Taxi: 211 (16.6%)Walked: 20 (1.6%)Worked at home: 193 (15.2%)
Unemployment by race in 2022
Unemployment rate for White non-Hispanic residents 8.7% Males11.2% FemalesUnemployment rate for Asian residents 30.9% Females
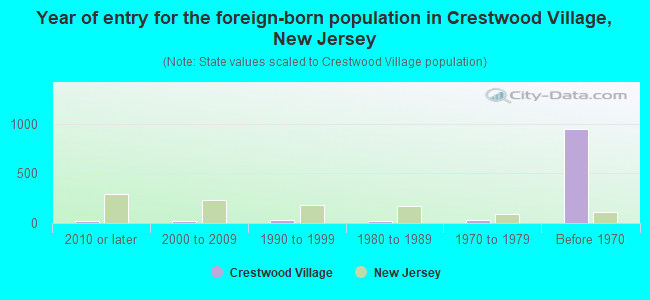
Year of entry for the foreign-born population in Crestwood Village, New Jersey
19 2010 or later 22 2000 to 2009 30 1990 to 1999 23 1980 to 1989 31 1970 to 1979 947 Before 1970
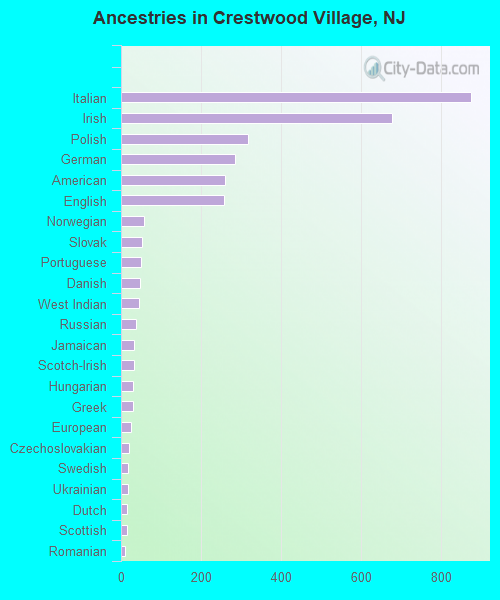
First ancestries reported:
Italian: 876 (23.5%)
Irish: 678 (18.2%)
Polish: 317 (8.5%)
German: 285 (7.7%)
American: 260 (7.0%)
English: 257 (6.9%)
Norwegian: 57 (1.5%)
Slovak: 52 (1.4%)
Portuguese: 51 (1.4%)
Danish: 48 (1.3%)
West Indian: 44 (1.2%)
Russian: 37 (1.0%)
Jamaican: 33 (0.9%)
Scotch-Irish: 32 (0.9%)
Hungarian: 31 (0.8%)
Greek: 30 (0.8%)
European: 24 (0.6%)
Czechoslovakian: 20 (0.5%)
Swedish: 17 (0.5%)
Ukrainian: 17 (0.5%)
Dutch: 16 (0.4%)
Scottish: 14 (0.4%)
Romanian: 11 (0.3%)
French Canadian: 7 (0.2%)
Slavic: 1 (0.03%) Most common places of birth for foreign-born residents (%): Germany Crestwood Village:
15.5% (103)New Jersey:
0.8% (17,217)
Portugal Crestwood Village:
5.9% (39)New Jersey:
1.3% (28,871)
Philippines Crestwood Village:
5.9% (39)New Jersey:
4.0% (85,934)
Korea Crestwood Village:
5.6% (37)New Jersey:
3.3% (70,512)
Ecuador Crestwood Village:
5.3% (35)New Jersey:
4.4% (95,275)
Ireland Crestwood Village:
5.0% (33)New Jersey:
0.4% (8,146)
Jamaica Crestwood Village:
5.0% (33)New Jersey:
2.2% (47,365)
Denmark Crestwood Village:
4.8% (32)New Jersey:
0.1% (1,131)
Romania Crestwood Village:
4.7% (31)New Jersey:
0.3% (6,033)
Spain Crestwood Village:
4.4% (29)New Jersey:
0.5% (10,246)
Cuba Crestwood Village:
4.4% (29)New Jersey:
2.1% (45,435)
Moldova Crestwood Village:
3.5% (23)New Jersey:
0.1% (2,316)
Poland Crestwood Village:
3.5% (23)New Jersey:
2.3% (48,811)
Uruguay Crestwood Village:
3.5% (23)New Jersey:
0.3% (6,972)
Netherlands Crestwood Village:
2.6% (17)New Jersey:
0.1% (2,616)
Canada Crestwood Village:
2.6% (17)New Jersey:
0.9% (18,317)
Italy Crestwood Village:
2.3% (15)New Jersey:
1.5% (33,198)
Brazil Crestwood Village:
2.3% (15)New Jersey:
2.1% (46,020)
Taiwan Crestwood Village:
2.1% (14)New Jersey:
0.7% (15,548)
Uzbekistan Crestwood Village:
2.0% (13)New Jersey:
0.1% (2,517)
Greece Crestwood Village:
1.7% (11)New Jersey:
0.3% (7,501)
Place of birth for U.S.-born residents:
This state: 4,929Other state: 2,952Northeast: 2,382Midwest: 280South: 182West: 127 90.6% of Crestwood Village residents lived in the same house 1 years ago.
Out of people who lived in different houses, 31.9% lived in this county.
Out of people who lived in different counties, 54.7% lived in New Jersey.
Crestwood Village:
90.6%State average:
90.4%
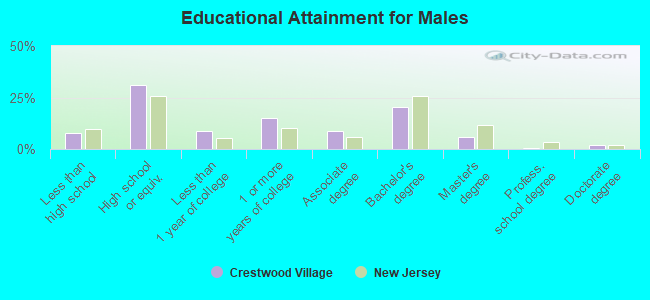
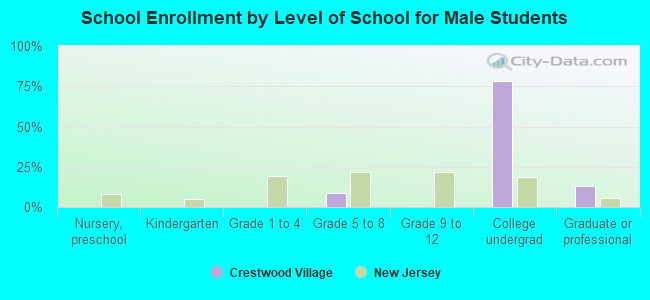
Education attainment for males 25 years and older:
No schooling: 8Nursery to 4th grade: 05th and 6th grade: 57th and 8th grade: 559th grade: 1010th grade: 2011th grade: 8412th grade, no diploma: 84High school graduate (or equivalency): 1,058Less than 1 year of college: 301Some college more than 1 year, no degree: 517Associate degree: 292Bachelor's degree: 692Master's degree: 205Professional school degree: 14Doctorate degree: 65
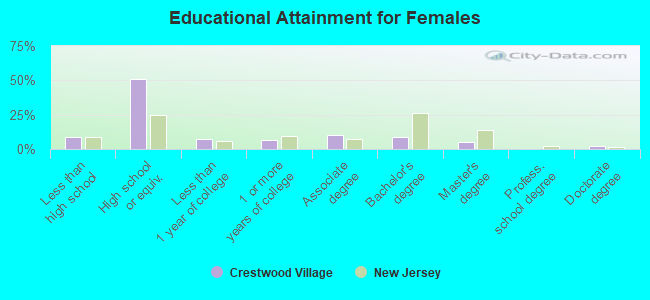
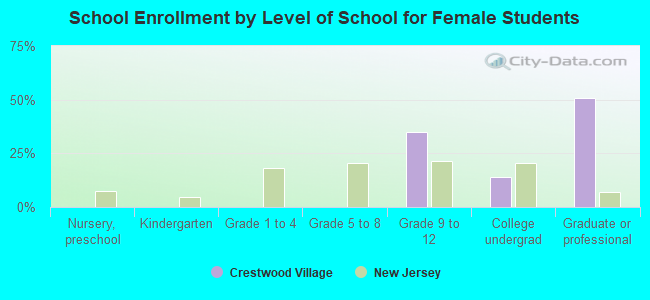
Education attainment for females 25 years and older:
No schooling: 0Nursery to 4th grade: 05th and 6th grade: 07th and 8th grade: 289th grade: 1910th grade: 12011th grade: 4912th grade, no diploma: 224High school graduate (or equivalency): 2,595Less than 1 year of college: 353Some college more than 1 year, no degree: 345Associate degree: 537Bachelor's degree: 454Master's degree: 252Professional school degree: 15Doctorate degree: 102
Housing units in structures:
One, detached: 1,532One, attached: 2,671Two: 9823 or 4: 1,4275 to 9: 12420 to 49: 4850 or more: 234Housing units lacking complete plumbing facilities in 2022: 0.2%Housing units lacking complete kitchen facilities in 2022: 0.9%House/condo owner moved in on average 8 years ago
Renter moved in on average 2 years ago
Private vs. public school enrollment:
Students in private schools in grades 1 to 8 (elementary and middle school): 0 Here:
0.0%New Jersey:
12.3%
Students in private schools in grades 9 to 12 (high school): 0 Here:
0.0%New Jersey:
13.1%
Students in private undergraduate colleges: 103 Here:
74.1%New Jersey:
33.2%