Crestview, FL (Florida) Houses and Residents
| Crestview: | $261,259 |
| Florida: | $354,100 |
Mean price in 2022:
Detached houses: $234,121
Here: $234,121 State: $500,941 Townhouses or other attached units: $97,908
Here: $97,908 State: $370,869 In 5-or-more-unit structures: $59,741
Here: $59,741 State: $447,145
Total population: 22,955 (Urban population: 14,297 (all inside urban clusters), Rural population: 521 (all nonfarm))
Houses: 11,200 (10,445 occupied: 6,434 owner occupied, 4,231 renter occupied)
| % of renters here: | 40% |
| State: | 33% |
Housing density: 875 houses/condos per square mile
Median price asked for vacant for-sale houses and condos in 2022 in this county: $483,280.
Median contract rent in 2022: $1,041 (lower quartile is $748, upper quartile is $1,398)
Median rent asked for vacant for-rent units in 2022: $1,262
Median gross rent in Crestview, FL in 2022: $1,268
Housing units in Crestview with a mortgage: 4,533 (177 second mortgage, 0 home equity loan, 134 both second mortgage and home equity loan)
Houses without a mortgage: 112
Median household income for houses/condos with a mortgage: $83,347
Median household income for apartments without a mortgage: $73,415
Median monthly housing costs: $1,229
Compare current foreclosures in Crestview, FL:
| Photo | Address | Area | Beds / Baths | Price | Details |
|---|---|---|---|---|---|

|
#1
Conquest Ave
Crestview, FL 32536
|
3,036 sq. feet
|
3 baths 4 beds |
show details | |

|
#2
Sunset Dr
Crestview, FL 32536
|
1,188 sq. feet
|
2 baths 3 beds |
show details | |

|
#3
Whitehurst Ln
Crestview, FL 32536
|
1,848 sq. feet
|
2 baths 3 beds |
show details | |

|
#4
Seminole Trl
Crestview, FL 32536
|
1,435 sq. feet
|
2 baths 3 beds |
show details | |

|
#5
Moore Loop
Crestview, FL 32536
|
2,296 sq. feet
|
2 baths 4 beds |
show details | |

|
#6
Whitehurst Ln
Crestview, FL 32536
|
1,990 sq. feet
|
2 baths 3 beds |
show details | |

|
#7
Winstead Rd
Crestview, FL 32539
|
1,107 sq. feet
|
2 baths 3 beds |
show details | |

|
#8
Cabana Way
Crestview, FL 32536
|
1,244 sq. feet
|
2 baths 3 beds |
show details | |

|
#9
Aplin Rd
Crestview, FL 32539
|
1,700 sq. feet
|
1 baths 3 beds |
show details | |

|
#10
Antigone Cir
Crestview, FL 32536
|
2,564 sq. feet
|
4 baths 5 beds |
show details |
| Photo | Address | Area | Beds / Baths | Price | Details |
|---|---|---|---|---|---|

|
#11
Hummingbird Ln
Crestview, FL 32536
|
1,971 sq. feet
|
2 baths 4 beds |
show details | |

|
#12
Oakmont Dr
Crestview, FL 32539
|
1,430 sq. feet
|
2 baths 3 beds |
show details | |

|
#13
Dorcas Rd
Crestview, FL 32539
|
980 sq. feet
|
2 baths 3 beds |
show details | |

|
#14
Corner Creek Rd
Crestview, FL 32536
|
2,516 sq. feet
|
3 baths 4 beds |
show details | |

|
#15
Highway 393
Crestview, FL 32539
|
1,216 sq. feet
|
2 baths 3 beds |
show details | |

|
#16
Peoria Blvd
Crestview, FL 32536
|
2,527 sq. feet
|
3 baths 5 beds |
show details | |

|
#17
Moore Loop
Crestview, FL 32536
|
1,625 sq. feet
|
2 baths 4 beds |
show details | |

|
#18
Highway 393
Crestview, FL 32539
|
784 sq. feet
|
2 baths 2 beds |
show details | |

|
#19
Martin Luther King Jr Ave
Crestview, FL 32536
|
2,568 sq. feet
|
3 baths 5 beds |
show details | |

|
#20
Connor Dr
Crestview, FL 32539
|
1,902 sq. feet
|
2 baths 4 beds |
show details |
| Photo | Address | Area | Beds / Baths | Price | Details |
|---|---|---|---|---|---|

|
#21
W Walnut Ave
Crestview, FL 32536
|
1,000 sq. feet
|
1 baths 2 beds |
show details | |

|
#22
Iron Horse Dr E
Crestview, FL 32539
|
1,567 sq. feet
|
2 baths 3 beds |
show details | |

|
#23
E Chestnut Ave
Crestview, FL 32539
|
1,188 sq. feet
|
1 baths 3 beds |
show details | |

|
#24
Tranquility Dr
Crestview, FL 32536
|
2,361 sq. feet
|
2 baths 4 beds |
show details | |

|
#25
Titanium Dr
Crestview, FL 32536
|
2,316 sq. feet
|
2 baths 4 beds |
show details | |

|
#26
Secretariat Dr
Crestview, FL 32539
|
2,103 sq. feet
|
3 baths 4 beds |
show details | |

|
#27
Golden Acres Cir
Crestview, FL 32539
|
1,456 sq. feet
|
2 baths 3 beds |
show details | |

|
#28
Panama Dr
Crestview, FL 32536
|
1,092 sq. feet
|
2 baths 3 beds |
show details | |

|
#29
S Wilson St
Crestview, FL 32536
|
1,470 sq. feet
|
2 baths 3 beds |
show details | |

|
#30
S Booker St
Crestview, FL 32536
|
396 sq. feet
|
1 baths 1 beds |
show details |
| Photo | Address | Area | Beds / Baths | Price | Details |
|---|---|---|---|---|---|

|
#31
Seminole Trl
Crestview, FL 32536
|
1,012 sq. feet
|
1 baths 3 beds |
show details | |

|
#32
Palmetto Dr
Crestview, FL 32539
|
2,110 sq. feet
|
2 baths 4 beds |
show details | |

|
#33
Thurston Pl
Crestview, FL 32536
|
2,666 sq. feet
|
3 baths 4 beds |
show details | |

|
#34
Westview Dr
Crestview, FL 32536
|
1,234 sq. feet
|
2 baths 3 beds |
show details | |

|
#35
Colt Dr
Crestview, FL 32539
|
1,130 sq. feet
|
2 baths 3 beds |
show details | |

|
#36
Park Ln
Crestview, FL 32536
|
1,610 sq. feet
|
2 baths 3 beds |
show details | |

|
#37
Highway 393
Crestview, FL 32539
|
2,052 sq. feet
|
3 baths 4 beds |
show details | |

|
#38
Tranquility Dr
Crestview, FL 32536
|
2,361 sq. feet
|
2 baths 4 beds |
show details | |

|
#39
Agerton St
Crestview, FL 32536
|
2,152 sq. feet
|
2 baths 4 beds |
show details | |

|
#40
Lexie Dr
Crestview, FL 32536
|
1,470 sq. feet
|
2 baths 3 beds |
show details |
| Photo | Address | Area | Beds / Baths | Price | Details |
|---|---|---|---|---|---|

|
#41
Dorcas Rd
Crestview, FL 32539
|
980 sq. feet
|
2 baths 3 beds |
show details | |

|
#42
Jeremy Ct
Crestview, FL 32539
|
1,431 sq. feet
|
2 baths 3 beds |
show details | |

|
#43
Big Buck Trl
Crestview, FL 32539
|
1,895 sq. feet
|
2 baths 3 beds |
show details | |

|
#44
Eden Sq
Crestview, FL 32539
|
2,128 sq. feet
|
3 baths 4 beds |
show details | |

|
#45
Johnson Ct
Crestview, FL 32536
|
1,496 sq. feet
|
2 baths 3 beds |
show details | |

|
#46
Sikes Dr
Crestview, FL 32539
|
1,320 sq. feet
|
1 baths 3 beds |
show details | |

|
#47
Riverchase Blvd
Crestview, FL 32536
|
2,343 sq. feet
|
2 baths 4 beds |
show details | |

|
#48
Old South Dr
Crestview, FL 32536
|
2,792 sq. feet
|
3 baths 4 beds |
show details | |

|
#49
Brock Ave
Crestview, FL 32539
|
1,658 sq. feet
|
2 baths 3 beds |
show details | |

|
Check over 1 million property listings on Foreclosure.com!
|
browse all offers | |||

Latest news about housing in Crestview, FL collected exclusively by city-data.com from local newspapers, TV, and radio stations

 | Some homes in Southern Sarasota County exceeding $500 ppsqft (51 replies) |
| Leaving Florida (60 replies) |
| South Florida dominates list of cities with the fastest-growing home prices in Florida (0 replies) |
| Relocating to FL Crestview? (13 replies) |
| Why is Walton County real estate so expensive? (34 replies) |
| Best Home Builders in Pace Crestview areas (4 replies) |

Median year apartment built: 2001
Household type by relationship:
Households: 28,004- Male householders: 5,734 (1,831 living alone), Female householders: 4,715 (1,423 living alone)
4,931 spouses (4,898 opposite-sex spouses), 345 unmarried partners, (345 opposite-sex unmarried partners), 9,068 children (8,500 natural, 82 adopted, 486 stepchildren), 826 grandchildren, 0 brothers or sisters, 317 parents, 27 foster children, 347 other relatives, 566 non-relatives
- In group quarters: 1,124
Size of family households: 2,973 2-persons, 1,747 3-persons, 1,120 4-persons, 899 5-persons, 216 6-persons, 270 7-or-more-persons.
Size of nonfamily households: 3,041 1-person, 304 2-persons, 90 3-persons.
4,422 married couples with children.
2,113 single-parent households (814 men, 1,299 women).
91.0% of residents of Crestview speak English at home.
6.0% of residents speak Spanish at home (66% speak English very well, 6% speak English well, 10% speak English not well, 18% don't speak English at all).
1.3% of residents speak other Indo-European language at home (92% speak English very well, 1% speak English well, 6% speak English not well).
1.1% of residents speak Asian or Pacific Island language at home (54% speak English very well, 42% speak English well, 4% speak English not well).
Foreign born population: 1,195 (4.3%)
(43.3% of them are naturalized citizens)
| Here: | 6.5 |
| State: | 5.9 |
| Here: | 4.4 |
| State: | 4.2 |

- Bedrooms in owner-occupied houses and condos in Crestview, Florida
- 9no bedroom
- 01 bedroom
- 3082 bedrooms
- 3,6283 bedrooms
- 2,2394 bedrooms
- 2505+ bedrooms

- Bedrooms in renter-occupied apartments in Crestview, Florida
- 117no bedroom
- 7441 bedroom
- 1,4512 bedrooms
- 1,4903 bedrooms
- 4294 bedrooms
- 05+ bedrooms

- Cars and other vehicles available in Crestview in owner-occupied houses/condos
- 78no vehicle
- 1,8831 vehicle
- 2,7282 vehicles
- 1,1163 vehicles
- 3964 vehicles
- 2325+ vehicles

- Cars and other vehicles available in Crestview in renter-occupied apartments
- 253no vehicle
- 2,1451 vehicle
- 1,0762 vehicles
- 6833 vehicles
- 754 vehicles
- 05+ vehicles

- Rooms in owner-occupied houses in Crestview, Florida
- 91 room
- 02 rooms
- 223 rooms
- 5544 rooms
- 1,1555 rooms
- 1,4556 rooms
- 1,0027 rooms
- 7948 rooms
- 1,4439+ rooms

- Rooms in renter-occupied apartments in Crestview, Florida
- 1171 room
- 3572 rooms
- 6463 rooms
- 9944 rooms
- 1,0525 rooms
- 5406 rooms
- 2007 rooms
- 2328 rooms
- 939+ rooms


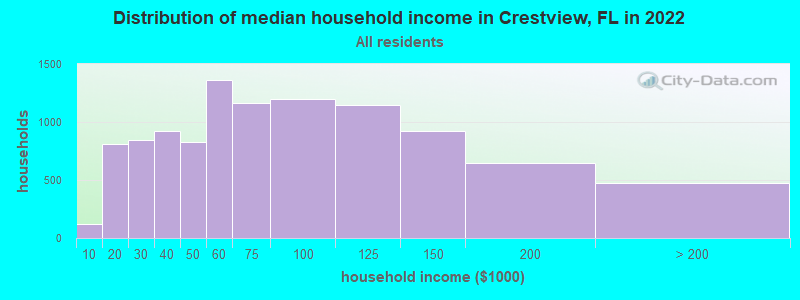
Crestview, FL household income distribution

- 125Less than $10,000
- 810$10,000 to $19,999
- 846$20,000 to $29,999
- 920$30,000 to $39,999
- 824$40,000 to $49,999
- 1,363$50,000 to $59,999
- 1,165$60,000 to $74,999
- 1,196$75,000 to $99,999
- 1,143$100,000 to $124,999
- 923$125,000 to $149,999
- 645$150,000 to $199,999
- 474$200,000 or more
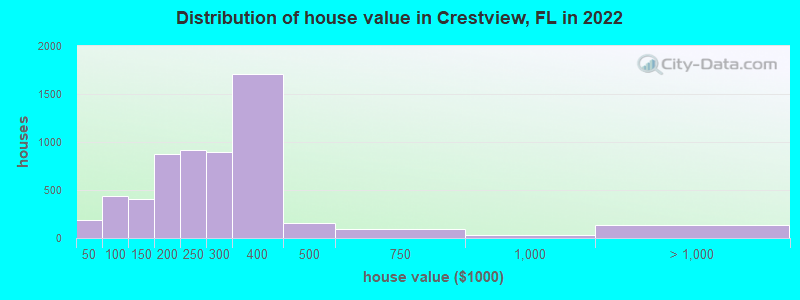
Home value of owner - occupied houses in 2022 in Crestview, FL
-
- 61Less than $10,000
- 30$15,000 to $19,999
- 26$20,000 to $24,999
- 16$25,000 to $29,999
- 55$40,000 to $49,999
- 35$60,000 to $69,999
- 217$70,000 to $79,999
- 55$80,000 to $89,999
- 76$90,000 to $99,999
- 216$100,000 to $124,999
- 192$125,000 to $149,999
- 590$150,000 to $174,999
- 287$175,000 to $199,999
- 918$200,000 to $249,999
- 894$250,000 to $299,999
- 1,707$300,000 to $399,999
- 153$400,000 to $499,999
- 93$500,000 to $749,999
- 35$750,000 to $999,999
- 22$1,000,000 to $1,499,999
- 114$2,000,000 or more
Rent paid by renters in 2022 in Crestview, FL
-
- 41$100 to $149
- 88$150 to $199
- 14$250 to $299
- 125$400 to $449
- 194$500 to $549
- 155$550 to $599
- 183$600 to $649
- 148$650 to $699
- 173$700 to $749
- 112$750 to $799
- 210$800 to $899
- 379$900 to $999
- 781$1,000 to $1,249
- 572$1,250 to $1,499
- 501$1,500 to $1,999
- 38$2,000 to $2,499
- 192No cash rent


Percentage of workers working in this county: 87.4%
Number of people working at home: 1,221 (8.9% of all workers)
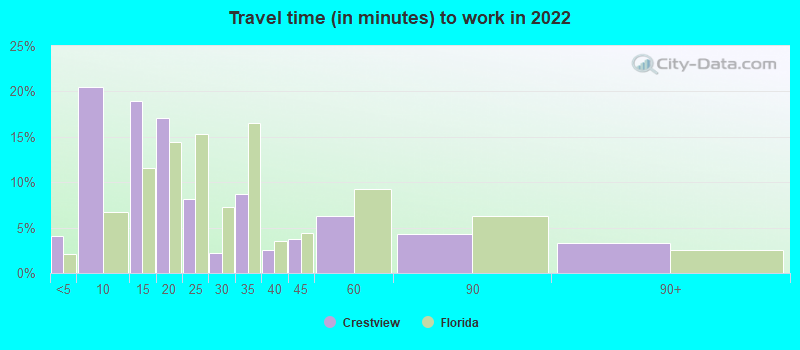
Travel time to work (commute)
- Less than 5 minutes: 204
- 5 to 9 minutes: 1,935
- 10 to 14 minutes: 1,272
- 15 to 19 minutes: 1,060
- 20 to 24 minutes: 723
- 25 to 29 minutes: 496
- 30 to 34 minutes: 1,751
- 35 to 39 minutes: 451
- 40 to 44 minutes: 912
- 45 to 59 minutes: 2,506
- 60 to 89 minutes: 742
- 90 or more minutes: 516
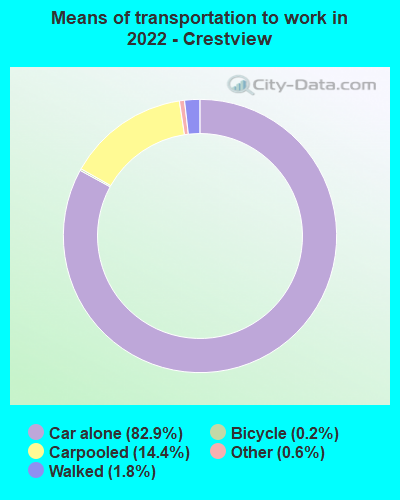
Means of transportation to work:
- Drove a car alone: 9,673 (74.4%)
- Carpooled: 1,816 (14.0%)
- Bus: 5 (0.0%)
- Taxi: 113 (0.9%)
- Bicycle: 9 (0.1%)
- Walked: 199 (1.5%)
- Worked at home: 1,221 (9.4%)

- Unemployment by race in 2022
- Unemployment rate for White non-Hispanic residents
- 3.9%Males
- 7.0%Females
- Unemployment rate for Black residents
- 6.7%Males
- Unemployment rate for Asian residents
- 6.5%Males
- Unemployment rate for Hispanic or Latino residents
- 3.6%Females

- Year of entry for the foreign-born population in Crestview, Florida
- 5262010 or later
- 3712000 to 2009
- 1451990 to 1999
- 1731980 to 1989
- 1271970 to 1979
- 177Before 1970
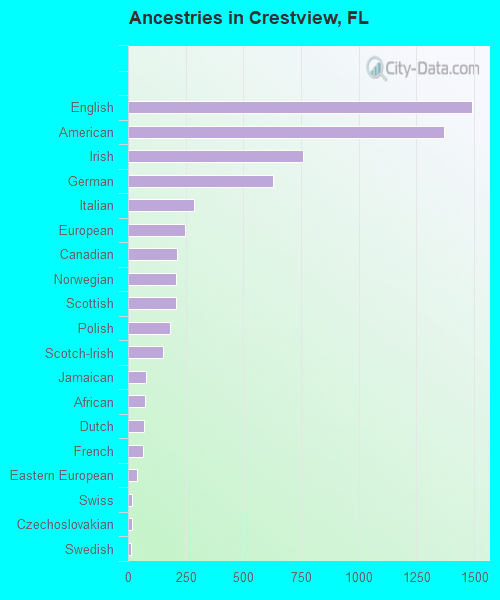
First ancestries reported:
- English: 1,490 (11.5%)
- American: 1,368 (10.6%)
- Irish: 759 (5.9%)
- German: 628 (4.9%)
- Italian: 287 (2.2%)
- European: 249 (1.9%)
- Canadian: 213 (1.6%)
- Norwegian: 209 (1.6%)
- Scottish: 208 (1.6%)
- Polish: 180 (1.4%)
- Scotch-Irish: 152 (1.2%)
- Jamaican: 79 (0.6%)
- African: 74 (0.6%)
- Dutch: 69 (0.5%)
- French: 65 (0.5%)
- Eastern European: 38 (0.3%)
- Swiss: 18 (0.1%)
- Czechoslovakian: 16 (0.1%)
- Swedish: 15 (0.1%)
- French Canadian: 10 (0.08%)
- Haitian: 5 (0.04%)
- Greek: 4 (0.03%)
Most common places of birth for foreign-born residents (%):
| Crestview: | 22.7% (292) |
| Florida: | 1.8% (84,403) |
| Crestview: | 22.5% (289) |
| Florida: | 2.1% (97,632) |
| Crestview: | 8.2% (105) |
| Florida: | 0.3% (12,303) |
| Crestview: | 7.9% (102) |
| Florida: | 0.7% (30,755) |
| Crestview: | 7.6% (97) |
| Florida: | 5.6% (257,152) |
| Crestview: | 7.1% (91) |
| Florida: | 5.0% (227,319) |
| Crestview: | 5.9% (76) |
| Florida: | 0.4% (19,445) |
| Crestview: | 4.3% (55) |
| Florida: | 0.8% (37,723) |
| Crestview: | 3.3% (43) |
| Florida: | 0.5% (22,972) |
| Crestview: | 2.6% (34) |
| Florida: | 1.2% (54,585) |
| Crestview: | 1.8% (23) |
| Florida: | 1.1% (49,838) |
Place of birth for U.S.-born residents:
- This state: 11,204
- Other state: 14,046
- Northeast: 2,323
- Midwest: 3,062
- South: 6,620
- West: 1,996
83.2% of Crestview residents lived in the same house 1 years ago.
Out of people who lived in different houses, 26.2% lived in this county.
Out of people who lived in different counties, 48.2% lived in Florida.
| Crestview: | 83.2% |
| State average: | 86.3% |
Education attainment for males 25 years and older:
- No schooling: 91
- Nursery to 4th grade: 5
- 5th and 6th grade: 14
- 7th and 8th grade: 132
- 9th grade: 44
- 10th grade: 101
- 11th grade: 84
- 12th grade, no diploma: 36
- High school graduate (or equivalency): 2,069
- Less than 1 year of college: 992
- Some college more than 1 year, no degree: 1,668
- Associate degree: 1,874
- Bachelor's degree: 1,212
- Master's degree: 351
- Professional school degree: 49
- Doctorate degree: 32

Education attainment for females 25 years and older:
- No schooling: 35
- Nursery to 4th grade: 0
- 5th and 6th grade: 0
- 7th and 8th grade: 190
- 9th grade: 62
- 10th grade: 151
- 11th grade: 77
- 12th grade, no diploma: 123
- High school graduate (or equivalency): 2,481
- Less than 1 year of college: 869
- Some college more than 1 year, no degree: 1,393
- Associate degree: 1,387
- Bachelor's degree: 1,258
- Master's degree: 1,036
- Professional school degree: 23
- Doctorate degree: 30


Housing units in structures:
- One, detached: 8,247
- One, attached: 452
- Two: 340
- 3 or 4: 280
- 5 to 9: 537
- 10 to 19: 255
- 20 to 49: 669
- 50 or more: 256
- Mobile homes: 160
Housing units lacking complete kitchen facilities in 2022: 2.4%
House/condo owner moved in on average 8 years ago
Renter moved in on average 3 years ago

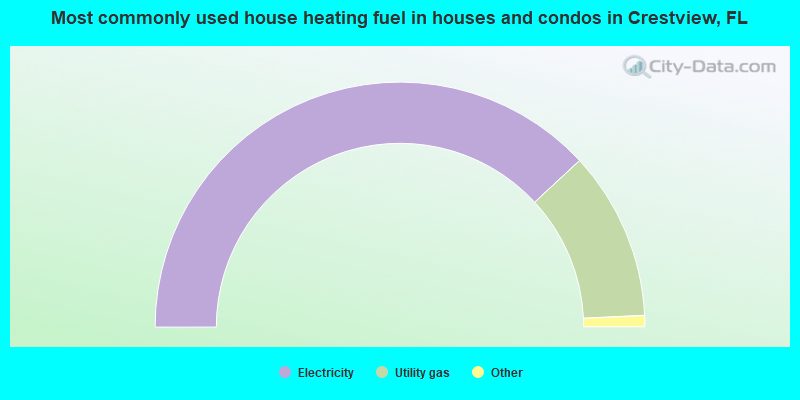
- 76.3%Electricity
- 22.3%Utility gas
- 0.7%Solar energy
- 0.4%No fuel used
- 0.4%Bottled, tank, or LP gas
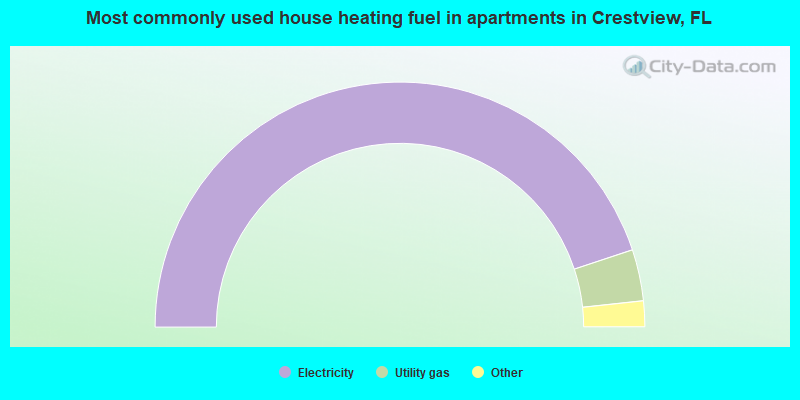
- 89.8%Electricity
- 6.8%Utility gas
- 2.6%No fuel used
- 0.8%Bottled, tank, or LP gas
Private vs. public school enrollment:
| Here: | 5.7% |
| Florida: | 15.8% |
| Here: | 3.7% |
| Florida: | 12.9% |
| Here: | 38.0% |
| Florida: | 23.6% |


