Cold Springs, NV (Nevada) Houses and Residents
| Cold Springs: | $432,045 |
| Nevada: | $434,700 |
Mean price in 2022:
Detached houses: $415,716
Here: $415,716 State: $549,327 Mobile homes: $235,306
Here: $235,306 State: $159,995
Total population: 8,544 (Urban population: 2,736 (all inside urban clusters), Rural population: 1,095 (all nonfarm))
Houses: 3,740 (3,620 occupied: 3,225 owner occupied, 345 renter occupied)
| % of renters here: | 10% |
| State: | 40% |
Housing density: 219 houses/condos per square mile
Median price asked for vacant for-sale houses and condos in 2022 in this county: $350,177.
Median contract rent in 2022: $1,786 (lower quartile is $1,550, upper quartile is over $2,000)
Median gross rent in Cold Springs, NV in 2022: $1,940
Housing units in Cold Springs with a mortgage: 2,531 (234 second mortgage, 4 home equity loan, 201 both second mortgage and home equity loan)
Houses without a mortgage: 16
Median household income for houses/condos with a mortgage: $82,898
Median household income for apartments without a mortgage: $86,541
Median monthly housing costs: $1,595
Compare current foreclosures near Cold Springs, NV:
| Photo | Address | Area | Beds / Baths | Price | Details |
|---|---|---|---|---|---|

|
#1
Anthony Pl
Sun Valley, NV 89433
|
3,901 sq. feet
|
4 baths 7 beds |
$214,000
|
show details |

|
#2
Denslowe Dr
Reno, NV 89512
|
1,230 sq. feet
|
2 baths 3 beds |
show details | |

|
#3
Rancho Mirage Dr
Sparks, NV 89436
|
1,673 sq. feet
|
2 baths 3 beds |
show details | |

|
#4
Hts Dr
Reno, NV 89503
|
2,012 sq. feet
|
2 baths 4 beds |
show details | |

|
#5
Northridge Ave
Reno, NV 89508
|
1,560 sq. feet
|
2 baths 3 beds |
show details | |

|
#6
Flower St
Reno, NV 89506
|
1,250 sq. feet
|
2 baths 4 beds |
show details | |

|
#7
Green Mountain St
Reno, NV 89506
|
1,192 sq. feet
|
1 baths 3 beds |
show details | |

|
#8
Yukon Dr
Sun Valley, NV 89433
|
1,235 sq. feet
|
2 baths 3 beds |
show details | |

|
#9
Rayburn Dr
Reno, NV 89503
|
1,308 sq. feet
|
1 baths 3 beds |
show details | |

|
#10
White Sage Dr
Reno, NV 89506
|
1,284 sq. feet
|
2 baths 3 beds |
show details |
| Photo | Address | Area | Beds / Baths | Price | Details |
|---|---|---|---|---|---|

|
#11
Richard Springs Blvd
Sparks, NV 89436
|
2,110 sq. feet
|
3 baths 3 beds |
show details | |

|
#12
Lytton Rd
Reno, NV 89506
|
1,454 sq. feet
|
2 baths 3 beds |
show details | |

|
#13
Copper Ridge Circle
Reno, NV 89511
|
- sq. feet
|
3 baths 4 beds |
show details | |

|
#14
Rustic Ct
Sun Valley, NV 89433
|
1,345 sq. feet
|
2 baths 3 beds |
show details | |

|
#15
Welsh Dr
Reno, NV 89506
|
2,222 sq. feet
|
2 baths 4 beds |
show details | |

|
#16
Pima Ct
Sun Valley, NV 89433
|
1,064 sq. feet
|
2 baths 3 beds |
show details | |

|
#17
Blue Lakes Rd
Reno, NV 89523
|
1,417 sq. feet
|
2 baths 2 beds |
show details | |

|
#18
Yosemite Pl
Reno, NV 89503
|
1,744 sq. feet
|
2 baths 3 beds |
show details | |

|
#19
Ambassador Dr
Reno, NV 89523
|
1,270 sq. feet
|
2 baths 3 beds |
show details | |

|
#20
Sharlands Ave Unit W2136
Reno, NV 89523
|
930 sq. feet
|
2 baths 2 beds |
show details |
| Photo | Address | Area | Beds / Baths | Price | Details |
|---|---|---|---|---|---|

|
#21
Canyon Park Ln
Reno, NV 89523
|
1,141 sq. feet
|
2 baths 3 beds |
show details | |

|
#22
Stardust St
Reno, NV 89503
|
1,336 sq. feet
|
2 baths 3 beds |
show details | |

|
#23
Prince Way
Reno, NV 89503
|
1,560 sq. feet
|
2 baths 4 beds |
show details | |

|
#24
Breaker Way
Sparks, NV 89431
|
1,398 sq. feet
|
2 baths 4 beds |
show details | |

|
#25
Lightning Ct
Sun Valley, NV 89433
|
1,696 sq. feet
|
2 baths 3 beds |
show details | |

|
#26
Auburn Way
Reno, NV 89502
|
1,008 sq. feet
|
1 baths 3 beds |
show details | |

|
#27
E H St
Sparks, NV 89431
|
1,460 sq. feet
|
2 baths 3 beds |
show details | |

|
#28
Wagon Wheel Cir
Reno, NV 89503
|
1,194 sq. feet
|
2 baths 3 beds |
show details | |

|
#29
Teel St
Sparks, NV 89431
|
1,406 sq. feet
|
2 baths 4 beds |
show details | |

|
#30
W 11th St
Reno, NV 89503
|
2,696 sq. feet
|
2 baths 4 beds |
show details |
| Photo | Address | Area | Beds / Baths | Price | Details |
|---|---|---|---|---|---|

|
#31
Cleveland Ave
Reno, NV 89503
|
1,490 sq. feet
|
2 baths 4 beds |
show details | |

|
#32
Wagon Wheel Cir
Reno, NV 89503
|
1,175 sq. feet
|
2 baths 3 beds |
show details | |

|
#33
W Crow Ct
Sun Valley, NV 89433
|
1,304 sq. feet
|
2 baths 3 beds |
show details | |

|
#34
Sergei St
Sun Valley, NV 89433
|
1,245 sq. feet
|
2 baths 3 beds |
show details | |

|
#35
Nathan Stephen Ct
Reno, NV 89503
|
1,370 sq. feet
|
2 baths 2 beds |
show details | |

|
#36
Grand Island Dr
Sparks, NV 89436
|
2,029 sq. feet
|
2 baths 3 beds |
show details | |

|
#37
Cambrian Ct
Reno, NV 89503
|
2,318 sq. feet
|
2 baths 3 beds |
show details | |

|
#38
Candelaria Dr
Sparks, NV 89434
|
1,888 sq. feet
|
2 baths 4 beds |
show details | |

|
#39
Coit Dr
Reno, NV 89523
|
1,733 sq. feet
|
2 baths 3 beds |
show details | |

|
#40
Sky Country Dr
Reno, NV 89503
|
1,984 sq. feet
|
2 baths 2 beds |
show details |
| Photo | Address | Area | Beds / Baths | Price | Details |
|---|---|---|---|---|---|

|
#41
September Cir
Reno, NV 89523
|
1,966 sq. feet
|
2 baths 3 beds |
show details | |

|
#42
Meridian Ranch Dr
Reno, NV 89523
|
1,824 sq. feet
|
2 baths 3 beds |
show details | |

|
#43
Golden Eagle Dr
Reno, NV 89523
|
1,355 sq. feet
|
2 baths 3 beds |
show details | |

|
#44
Guildwood Dr
Sun Valley, NV 89433
|
1,344 sq. feet
|
2 baths 3 beds |
show details | |

|
#45
Enchanted Valley Dr
Reno, NV 89523
|
2,152 sq. feet
|
3 baths 4 beds |
show details | |

|
#46
Spring View Ct
Sparks, NV 89436
|
1,690 sq. feet
|
3 baths 3 beds |
show details | |

|
#47
High Desert Dr
Sparks, NV 89436
|
3,023 sq. feet
|
3 baths 6 beds |
show details | |

|
#48
Enchanted Valley Dr
Reno, NV 89523
|
2,152 sq. feet
|
3 baths 4 beds |
show details | |

|
#49
Tate Dr
Reno, NV 89523
|
2,717 sq. feet
|
3 baths 4 beds |
show details | |

|
Check over 1 million property listings on Foreclosure.com!
|
browse all offers | |||


 | Breakdown of areas in Reno (45 replies) |
| Fallon??? (23 replies) |
| Wood Burning Fireplace - Verdi (3 replies) |
| I Can't Believe The Wind Here! (25 replies) |
| Reno/Sparks Real Estate Report by area (49 replies) |
| Vegas to Reno (14 replies) |

Median year apartment built: 2009
Household type by relationship:
Households: 11,257- Male householders: 1,804 (324 living alone), Female householders: 1,725 (280 living alone)
2,129 spouses (2,065 opposite-sex spouses), 323 unmarried partners, (315 opposite-sex unmarried partners), 3,692 children (3,336 natural, 134 adopted, 221 stepchildren), 348 grandchildren, 37 brothers or sisters, 419 parents, 0 foster children, 164 other relatives, 611 non-relatives
Size of family households: 782 2-persons, 542 3-persons, 575 4-persons, 497 5-persons, 90 6-persons, 140 7-or-more-persons.
Size of nonfamily households: 642 1-person, 231 2-persons, 22 3-persons, 15 4-persons.
2,296 married couples with children.
502 single-parent households (188 men, 314 women).
91.5% of residents of Cold Springs speak English at home.
6.1% of residents speak Spanish at home (85% speak English very well, 10% speak English well, 5% speak English not well).
1.7% of residents speak other Indo-European language at home (36% speak English very well, 64% speak English well).
1.8% of residents speak Asian or Pacific Island language at home (90% speak English very well, 10% speak English not well).
Foreign born population: 803 (7.1%)
(67.4% of them are naturalized citizens)
| Here: | 6.3 |
| State: | 6.0 |
| Here: | 5.8 |
| State: | 4.2 |

- Bedrooms in owner-occupied houses and condos in Cold Springs, Nevada
- 0no bedroom
- 01 bedroom
- 1472 bedrooms
- 1,9673 bedrooms
- 8274 bedrooms
- 2855+ bedrooms

- Bedrooms in renter-occupied apartments in Cold Springs, Nevada
- 0no bedroom
- 01 bedroom
- 762 bedrooms
- 1683 bedrooms
- 614 bedrooms
- 405+ bedrooms

- Cars and other vehicles available in Cold Springs in owner-occupied houses/condos
- 40no vehicle
- 5191 vehicle
- 1,2232 vehicles
- 7033 vehicles
- 4674 vehicles
- 2745+ vehicles

- Cars and other vehicles available in Cold Springs in renter-occupied apartments
- 0no vehicle
- 971 vehicle
- 832 vehicles
- 1153 vehicles
- 524 vehicles
- 05+ vehicles

- Rooms in owner-occupied houses in Cold Springs, Nevada
- 01 room
- 02 rooms
- 843 rooms
- 764 rooms
- 6915 rooms
- 1,0136 rooms
- 5927 rooms
- 4688 rooms
- 3039+ rooms

- Rooms in renter-occupied apartments in Cold Springs, Nevada
- 01 room
- 02 rooms
- 03 rooms
- 1004 rooms
- 435 rooms
- 776 rooms
- 597 rooms
- 408 rooms
- 269+ rooms


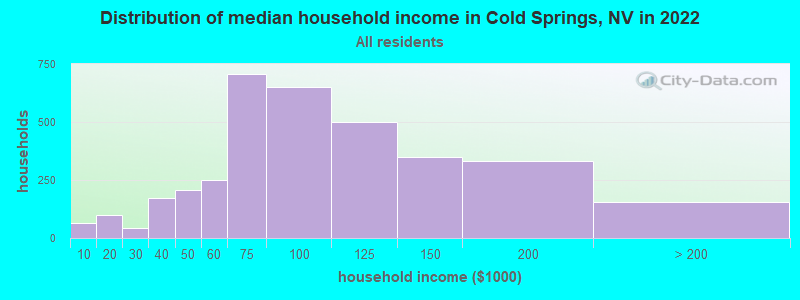
Cold Springs, NV household income distribution

- 63Less than $10,000
- 99$10,000 to $19,999
- 43$20,000 to $29,999
- 174$30,000 to $39,999
- 206$40,000 to $49,999
- 252$50,000 to $59,999
- 709$60,000 to $74,999
- 652$75,000 to $99,999
- 502$100,000 to $124,999
- 350$125,000 to $149,999
- 332$150,000 to $199,999
- 157$200,000 or more
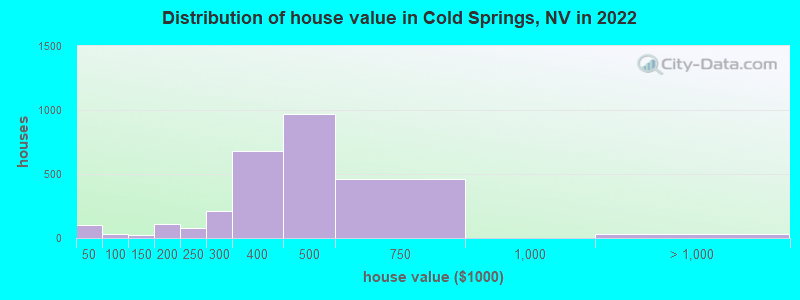
Home value of owner - occupied houses in 2022 in Cold Springs, NV
-
- 13Less than $10,000
- 23$10,000 to $14,999
- 23$30,000 to $34,999
- 19$35,000 to $39,999
- 22$40,000 to $49,999
- 2$70,000 to $79,999
- 9$90,000 to $99,999
- 17$100,000 to $124,999
- 4$125,000 to $149,999
- 77$150,000 to $174,999
- 35$175,000 to $199,999
- 79$200,000 to $249,999
- 208$250,000 to $299,999
- 681$300,000 to $399,999
- 966$400,000 to $499,999
- 458$500,000 to $749,999
- 34$1,000,000 to $1,499,999
Rent paid by renters in 2022 in Cold Springs, NV
-
- 3$500 to $549
- 8$800 to $899
- 13$1,000 to $1,249
- 62$1,250 to $1,499
- 173$1,500 to $1,999
- 86$2,000 to $2,499
- 10No cash rent


Percentage of workers working in this county: 92.4%
Number of people working at home: 347 (6.9% of all workers)
Travel time to work (commute)
- Less than 5 minutes: 149
- 5 to 9 minutes: 149
- 10 to 14 minutes: 164
- 15 to 19 minutes: 548
- 20 to 24 minutes: 545
- 25 to 29 minutes: 456
- 30 to 34 minutes: 1,389
- 35 to 39 minutes: 286
- 40 to 44 minutes: 196
- 45 to 59 minutes: 441
- 60 to 89 minutes: 220
- 90 or more minutes: 60
Means of transportation to work:
- Drove a car alone: 1,472 (75.2%)
- Carpooled: 430 (22.0%)
- Bus or trolley bus: 8 (0.4%)
- Motorcycle: 11 (0.6%)
- Worked at home: 37 (1.9%)

- Unemployment by race in 2022
- Unemployment rate for White non-Hispanic residents
- 1.4%Males
- 4.6%Females
- Unemployment rate for other race residents
- 4.2%Males
- Unemployment rate for two or more race residents
- 15.6%Females
- Unemployment rate for Hispanic or Latino residents
- 1.8%Males
- 11.3%Females

- Year of entry for the foreign-born population in Cold Springs, Nevada
- 202010 or later
- 2202000 to 2009
- 1701990 to 1999
- 461980 to 1989
- 01970 to 1979
- 39Before 1970

First ancestries reported:
- English: 680 (11.6%)
- American: 490 (8.3%)
- German: 457 (7.8%)
- Irish: 319 (5.4%)
- Italian: 184 (3.1%)
- European: 153 (2.6%)
- Russian: 87 (1.5%)
- French: 77 (1.3%)
- Norwegian: 54 (0.9%)
- Scotch-Irish: 52 (0.9%)
- Dutch: 40 (0.7%)
- Swedish: 36 (0.6%)
- Polish: 28 (0.5%)
- Danish: 27 (0.5%)
- Hungarian: 23 (0.4%)
- Swiss: 22 (0.4%)
- Finnish: 19 (0.3%)
- British: 16 (0.3%)
- Portuguese: 16 (0.3%)
- French Canadian: 15 (0.3%)
- Eastern European: 14 (0.2%)
- Canadian: 12 (0.2%)
- Icelander: 12 (0.2%)
- Austrian: 8 (0.1%)
- Belizean: 8 (0.1%)
- Belgian: 7 (0.1%)
- Ukrainian: 7 (0.1%)
- Croatian: 6 (0.1%)
Most common places of birth for foreign-born residents (%):
| Cold Springs: | 34.4% (285) |
| Nevada: | 36.8% (218,248) |
| Cold Springs: | 13.3% (110) |
| Nevada: | 1.1% (6,392) |
| Cold Springs: | 10.4% (86) |
| Nevada: | 15.5% (91,628) |
| Cold Springs: | 8.6% (71) |
| Nevada: | 1.0% (5,738) |
| Cold Springs: | 5.6% (46) |
| Nevada: | 1.9% (11,407) |
| Cold Springs: | 5.1% (42) |
| Nevada: | 0.5% (2,829) |
| Cold Springs: | 4.3% (36) |
| Nevada: | 0.1% (792) |
| Cold Springs: | 2.2% (18) |
| Nevada: | 0.1% (622) |
| Cold Springs: | 1.8% (15) |
| Nevada: | 0.8% (4,783) |
| Cold Springs: | 1.8% (15) |
| Nevada: | 1.8% (10,941) |
| Cold Springs: | 1.8% (15) |
| Nevada: | 4.0% (23,923) |
Place of birth for U.S.-born residents:
- This state: 4,625
- Other state: 5,609
- Northeast: 455
- Midwest: 695
- South: 321
- West: 4,179
90.1% of Cold Springs residents lived in the same house 1 years ago.
Out of people who lived in different houses, 40.7% lived in this county.
Out of people who lived in different counties, 7.3% lived in Nevada.
| Cold Springs: | 90.1% |
| State average: | 86.4% |
Education attainment for males 25 years and older:
- No schooling: 0
- Nursery to 4th grade: 52
- 5th and 6th grade: 30
- 7th and 8th grade: 41
- 9th grade: 0
- 10th grade: 92
- 11th grade: 30
- 12th grade, no diploma: 54
- High school graduate (or equivalency): 1,460
- Less than 1 year of college: 436
- Some college more than 1 year, no degree: 685
- Associate degree: 297
- Bachelor's degree: 331
- Master's degree: 107
- Professional school degree: 0
- Doctorate degree: 32

Education attainment for females 25 years and older:
- No schooling: 0
- Nursery to 4th grade: 15
- 5th and 6th grade: 7
- 7th and 8th grade: 10
- 9th grade: 0
- 10th grade: 61
- 11th grade: 36
- 12th grade, no diploma: 18
- High school graduate (or equivalency): 1,451
- Less than 1 year of college: 411
- Some college more than 1 year, no degree: 594
- Associate degree: 301
- Bachelor's degree: 535
- Master's degree: 192
- Professional school degree: 13
- Doctorate degree: 38


Housing units in structures:
- One, detached: 3,274
- Mobile homes: 465
Median worth of mobile homes: $277,047
Housing units lacking complete kitchen facilities in 2022: 2.0%
House/condo owner moved in on average 8 years ago
Renter moved in on average 3 years ago

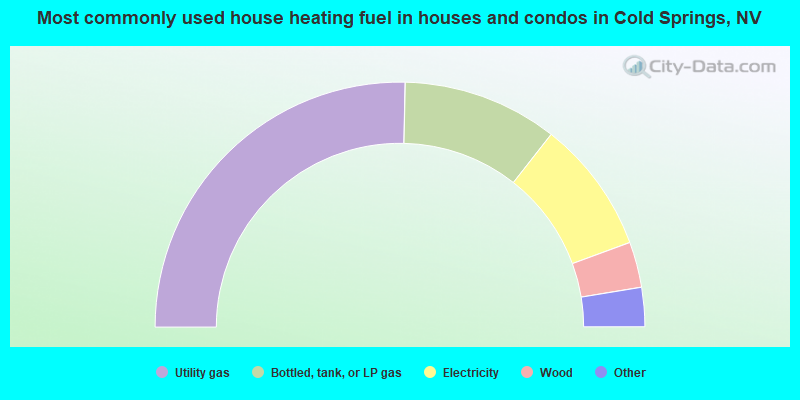
- 50.7%Utility gas
- 20.5%Bottled, tank, or LP gas
- 17.6%Electricity
- 6.0%Wood
- 2.8%Other fuel
- 1.3%Fuel oil, kerosene, etc.
- 1.0%Solar energy
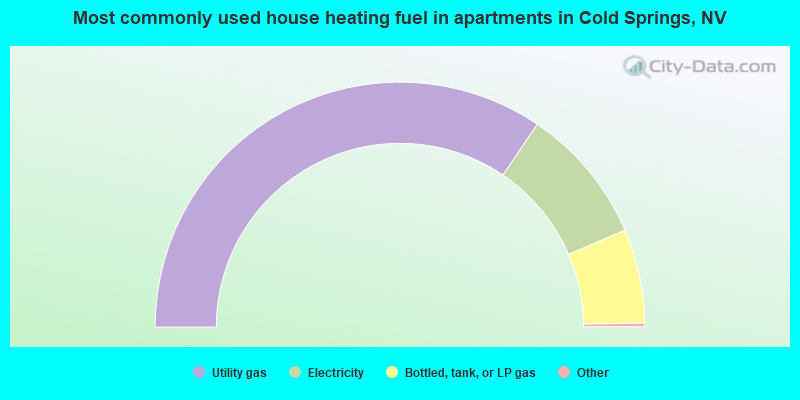
- 69.3%Utility gas
- 18.2%Electricity
- 12.5%Bottled, tank, or LP gas
Private vs. public school enrollment:
| Here: | 12.4% |
| Nevada: | 12.9% |
| Here: | 12.6% |
| Nevada: | 6.9% |
| Here: | 34.6% |
| Nevada: | 16.0% |


