Housing density: 732 houses/condos per square mile
Median price asked for vacant for-sale houses and condos in 2022 in this county: $364,915.
Median contract rent in 2022: $1,817 (lower quartile is $1,147, upper quartile is over $2,000)
Median rent asked for vacant for-rent units in 2022: $1,769
Median gross rent in Clarkstown, NY in 2022: $1,994
Housing units in Clarkstown with a mortgage: 15,454 (1,330 second mortgage, 2,016 home equity loan, 77 both second mortgage and home equity loan) Houses without a mortgage: 4,825
In family households: 273,452 (52,549 male householders, 21,607 female householders)
59,199 spouses, 110,082 children (106,179 natural, 1,852 adopted, 2,051 stepchildren), 4,832 grandchildren, 4,030 brothers or sisters, 3,887 parents, foster children, 6,514 other relatives, 7,870 non-relatives
In nonfamily households: 31,052 (10,342 male householders (8,132 living alone)), 14,744 female householders (12,788 living alone)), 5,966 nonrelatives
In group quarters: 7,183 (2,368 institutionalized population)
64,005 married couples with children.
9,958 single-parent households (2,044 men, 7,914 women).
77.4% of residents of Clarkstown speak English at home.
5.8% of residents speak Spanish at home (66% speak English very well, 15% speak English well, 16% speak English not well, 3% don't speak English at all).
10.3% of residents speak other Indo-European language at home (68% speak English very well, 21% speak English well, 9% speak English not well, 2% don't speak English at all).
5.6% of residents speak Asian or Pacific Island language at home (71% speak English very well, 22% speak English well, 7% speak English not well, 1% don't speak English at all).
0.9% of residents speak other language at home (80% speak English very well, 14% speak English well, 5% speak English not well).
Foreign born population: 16,979 (17.5%)
(79.3% of them are naturalized citizens)
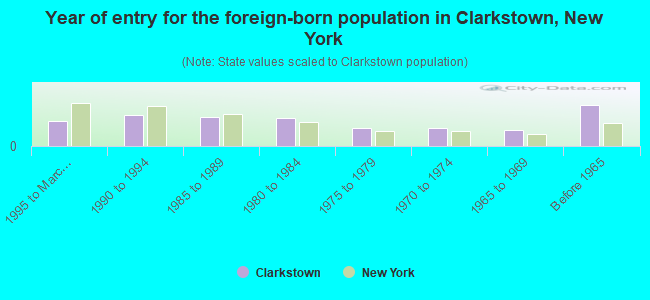
Year of entry for the foreign-born population in Clarkstown, New York
1,6471995 to March 2000
2,0481990 to 1994
1,9721985 to 1989
1,8451980 to 1984
1,2051975 to 1979
1,1721970 to 1974
1,0501965 to 1969
2,744Before 1965
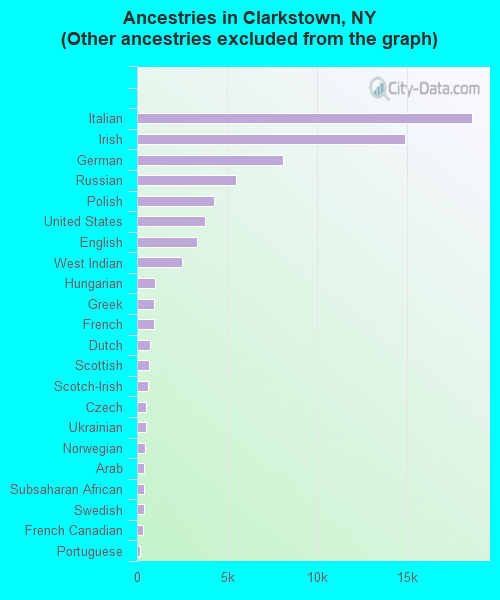
First ancestries reported:
Other: 23,081 (24.9%)
Italian: 18,611 (20.1%)
Irish: 14,861 (16.1%)
German: 8,094 (8.7%)
Russian: 5,482 (5.9%)
Polish: 4,270 (4.6%)
United States: 3,786 (4.1%)
English: 3,343 (3.6%)
West Indian: 2,505 (2.7%)
Hungarian: 987 (1.1%)
Greek: 954 (1.0%)
French: 923 (1.0%)
Dutch: 732 (0.8%)
Scottish: 678 (0.7%)
Scotch-Irish: 600 (0.6%)
Czech: 505 (0.5%)
Ukrainian: 505 (0.5%)
Norwegian: 418 (0.5%)
Arab: 380 (0.4%)
Subsaharan African: 377 (0.4%)
Swedish: 376 (0.4%)
French Canadian: 313 (0.3%)
Portuguese: 179 (0.2%)
Lithuanian: 143 (0.2%)
Swiss: 137 (0.1%)
Slovak: 116 (0.1%)
Welsh: 115 (0.1%)
Danish: 88 (0.10%)
Most common places of birth for foreign-born residents (%):
Philippines
Clarkstown:
12.1% (1,650)
New York:
1.9% (72,408)
India
Clarkstown:
10.8% (1,478)
New York:
3.0% (117,238)
Haiti
Clarkstown:
7.8% (1,068)
New York:
3.2% (125,475)
Italy
Clarkstown:
5.9% (809)
New York:
3.8% (147,729)
Russia
Clarkstown:
5.2% (708)
New York:
2.4% (94,595)
Jamaica
Clarkstown:
4.5% (619)
New York:
5.9% (226,470)
Ireland
Clarkstown:
4.1% (564)
New York:
1.1% (41,934)
Korea
Clarkstown:
4.0% (553)
New York:
2.5% (97,933)
Germany
Clarkstown:
3.8% (525)
New York:
1.8% (69,327)
China, excluding Hong Kong and Taiwan
Clarkstown:
2.9% (400)
New York:
6.0% (233,766)
United Kingdom
Clarkstown:
2.3% (312)
New York:
1.6% (62,237)
Mexico
Clarkstown:
2.2% (307)
New York:
4.2% (161,189)
Ecuador
Clarkstown:
1.9% (263)
New York:
3.6% (139,226)
Other Eastern Europe
Clarkstown:
1.9% (259)
New York:
1.4% (53,825)
Place of birth for U.S.-born residents:
This state: 57,428
Other state: 10,066
Northeast: 6,063
Midwest: 1,074
South: 2,254
West: 675
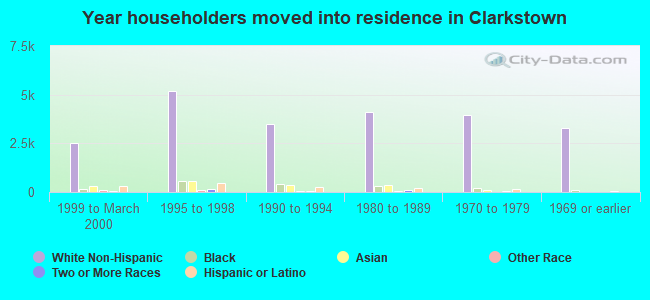
68% of Clarkstown residents lived in the same house 5 years ago. Out of people who lived in different houses, 55% lived in this county. Out of people who lived in different counties, 71% lived in New York.
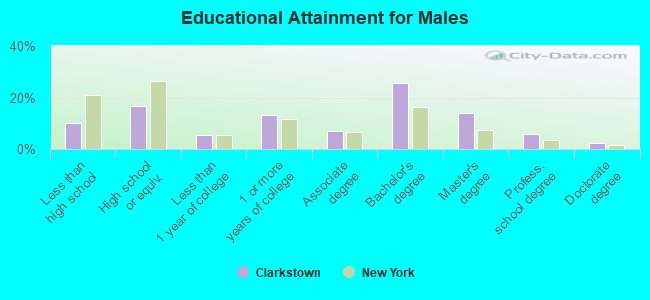
Education attainment for males 25 years and older:
No schooling: 320
Nursery to 4th grade: 103
5th and 6th grade: 232
7th and 8th grade: 365
9th grade: 209
10th grade: 324
11th grade: 249
12th grade, no diploma: 863
High school graduate (or equivalency): 4,378
Less than 1 year of college: 1,415
Some college more than 1 year, no degree: 3,530
Associate degree: 1,810
Bachelor's degree: 6,747
Master's degree: 3,723
Professional school degree: 1,518
Doctorate degree: 627
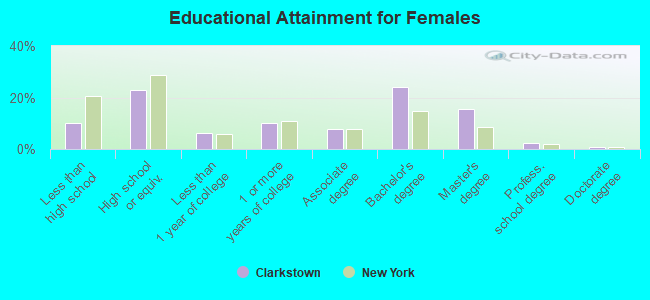
Education attainment for females 25 years and older:
No schooling: 295
Nursery to 4th grade: 134
5th and 6th grade: 318
7th and 8th grade: 479
9th grade: 193
10th grade: 317
11th grade: 339
12th grade, no diploma: 910
High school graduate (or equivalency): 6,911
Less than 1 year of college: 1,821
Some college more than 1 year, no degree: 3,033
Associate degree: 2,389
Bachelor's degree: 7,270
Master's degree: 4,707
Professional school degree: 653
Doctorate degree: 289
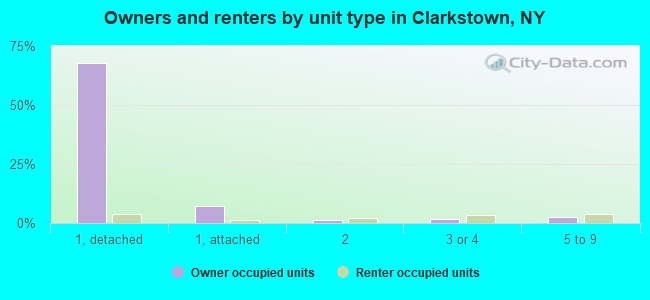
Housing units in structures:
One, detached: 20,150
One, attached: 2,454
Two: 974
3 or 4: 1,416
5 to 9: 1,811
10 to 19: 586
20 to 49: 247
50 or more: 401
Mobile homes: 173
Boats, RVs, vans, etc.: 8
Median worth of mobile homes: $92,437
Housing units lacking complete plumbing facilities: 0.3%
Housing units lacking complete kitchen facilities: 0.3%