Chestnut Ridge, NY (New York) Houses and Residents
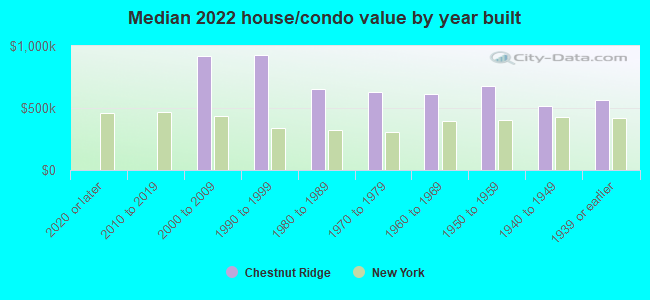
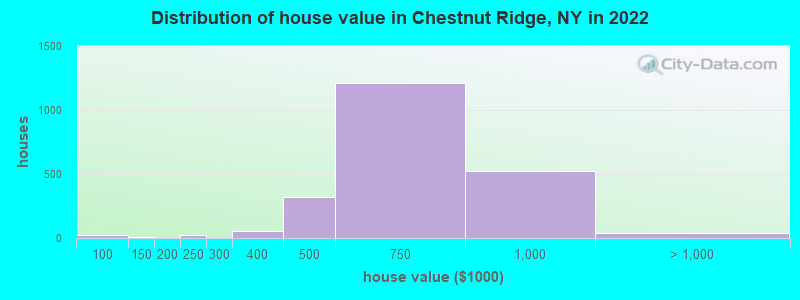
Estimated median house or condo value in 2022: $649,859 (it was $237,800 in 2000 )
Chestnut Ridge:
$649,859New York:
$400,400
Lower value quartile - upper value quartile: $517,097 - $756,809Total population: 8,140 (Urban population: 7,725, Rural population: 0)
Houses: 2,955 (2,761 occupied: 2,140 owner occupied, 639 renter occupied )
% of renters here:
23%State:
46%
Housing density: 598 houses/condos per square mile
Median price asked for vacant for-sale houses and condos in 2022: $417,176.
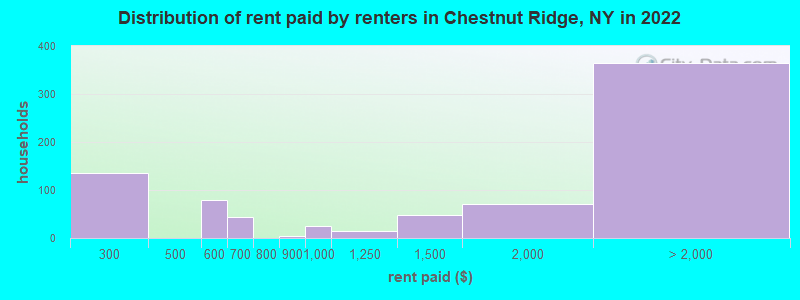
Median contract rent in 2022: $1,466 (lower quartile is $511, upper quartile is over $2,000)
Median rent asked for vacant for-rent units in 2022: $927
Median gross rent in Chestnut Ridge, NY in 2022: $1,740
Housing units in Chestnut Ridge with a mortgage: 1,496 (63 second mortgage, 0 home equity loan, 65 both second mortgage and home equity loan )Houses without a mortgage: 81
Median household income for houses/condos with a mortgage: $129,057
Median household income for apartments without a mortgage: $107,861
Median monthly housing costs: $2,862
Data:
Median house or condo value ($)
Median house or condo value ($ change since 2000)
Median house or condo value ($) - White
Median house or condo value ($) - Black or African American
Median house or condo value ($) - Asian
Median house or condo value ($) - Hispanic or Latino
Median house or condo value ($) - American Indian and Alaska Native
Median house or condo value ($) - Multirace
Median house or condo value ($) - Other Race
Median price asked for mobile homes ($)
Household density (households per square mile)
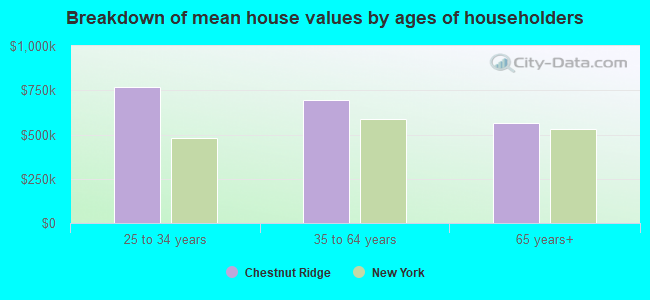
Mean house or condo value by units in structure - 1, detached ($)
Mean house or condo value by units in structure - 1, attached ($)
Mean house or condo value by units in structure - 2 ($)
Mean house or condo value by units in structure by units in structure - 3 or 4 ($)
Mean house or condo value by units in structure - 5 or more ($)
Mean house or condo value by units in structure - Boat, RV, van, etc. ($)
Mean house or condo value by units in structure - Mobile home ($)
Median contract rent ($)
Median contract rent - Lower quartile ($)
Median contract rent - Upper quartile ($)
Median gross rent ($)
Urban houses (%)
Rural houses (%)
Houses occupied (%)
Houses occupied (% change since 2000)
Houses owner occupied (%)
Houses owner occupied (% change since 2000)
Houses renter occupied (%)
Houses renter occupied (% change since 2000)
Vacant housing units - For rent (%)
Vacant housing units - For rent (% change since 2000)
Vacant housing units - For sale only (%)
Vacant housing units - For sale only (% change since 2000)
Vacant housing units - Rented or sold, not occupied (%)
Vacant housing units - Rented or sold, not occupied (% change since 2000)
Vacant housing units - For seasonal, recreational, or occasional use (%)
Vacant housing units - For seasonal, recreational, or occasional use (% change since 2000)
Vacant housing units - For migrant workers (%)
Vacant housing units - For migrant workers (% change since 2000)
Vacant housing units - Other vacant (%)
Vacant housing units - Other vacant (% change since 2000)
Median monthly housing costs ($)
Median household income for houses/condos with a mortgage ($)
Median household income for houses/condos without a mortgage ($)
Median household income ($)
Median household income ($) - White
Median household income ($) - Black or African American
Median household income ($) - Asian
Median household income ($) - Hispanic or Latino
Median household income ($) - American Indian and Alaska Native
Median household income ($) - Multirace
Median household income ($) - Other Race
Mortgage status - with mortgage (%)
Mortgage status - with second mortgage (%)
Mortgage status - with home equity loan (%)
Mortgage status - with both second mortgage and home equity loan (%)
Mortgage status - without a mortgage (%)
Median year house/condo built
Median year apartment built
Household type by relationship - Male householder living alone (%)
Household type by relationship - Male householder not living alone (%)
Household type by relationship - Female householder living alone (%)
Household type by relationship - Female householder not living alone (%)
Household type by relationship - Opposite-Sex spouse (%)
Household type by relationship - Same-Sex spouse (%)
Household type by relationship - Opposite-Sex unmarried partner (%)
Household type by relationship - Same-Sex unmarried partner (%)
Household type by relationship - In group quarters (%)
Size of family households - 2-person household (%)
Size of family households - 3-person household (%)
Size of family households - 4-person household (%)
Size of family households - 5-person household (%)
Size of family households - 6-person household (%)
Size of family households - 7-or-more-person household (%)
Size of nonfamily households - 1-person household (%)
Size of nonfamily households - 2-person household (%)
Size of nonfamily households - 3-person household (%)
Size of nonfamily households - 4-person household (%)
Size of nonfamily households - 5-person household (%)
Size of nonfamily households - 6-person household (%)
Size of nonfamily households - 7-or-moreperson household (%)
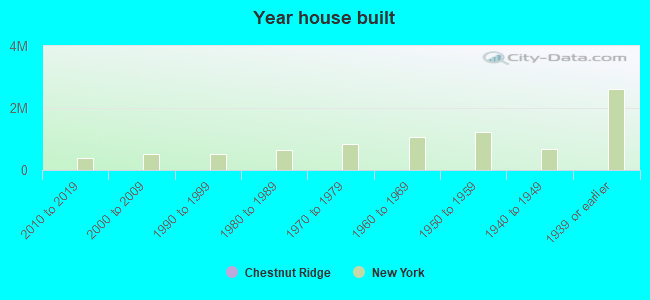
Year house built - Built 2010 or later (%)
Year house built - Built 2000 to 2009 (%)
Year house built - Built 1990 to 1999 (%)
Year house built - Built 1980 to 1989 (%)
Year house built - Built 1970 to 1979 (%)
Year house built - Built 1960 to 1969 (%)
Year house built - Built 1950 to 1959 (%)
Year house built - Built 1940 to 1949 (%)
Year house built - Built 1939 or earlier (%)
Median number of rooms in houses and condos
Median number of rooms in apartments
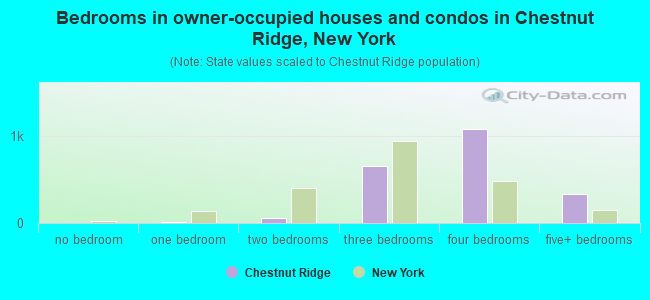
Median number of bedrooms in owner occupied houses
Mean number of bedrooms in owner occupied houses
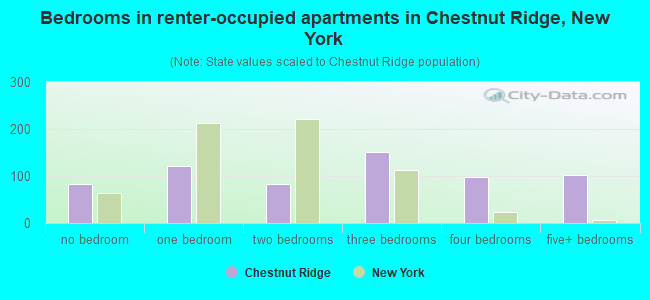
Median number of bedrooms in renter occupied houses
Mean number of bedrooms in renter occupied houses
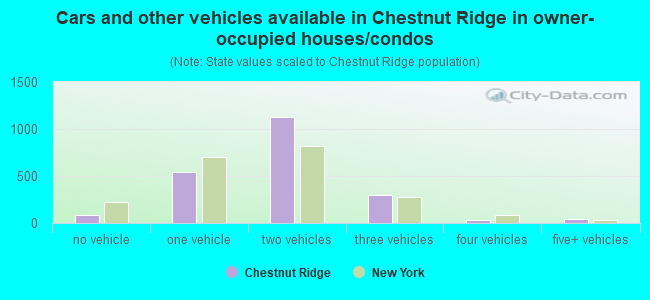
Median number of vehichles in owner occupied houses
Mean number of vehichles in owner occupied houses
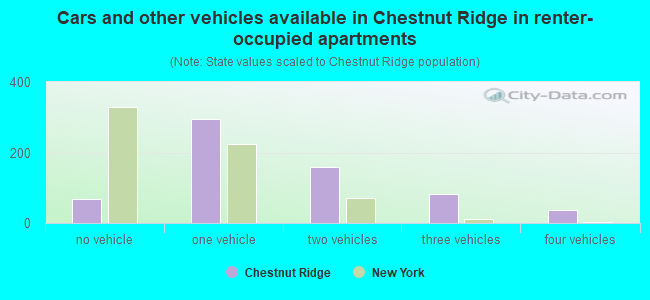
Median number of vehichles in renter occupied houses
Mean number of vehichles in renter occupied houses
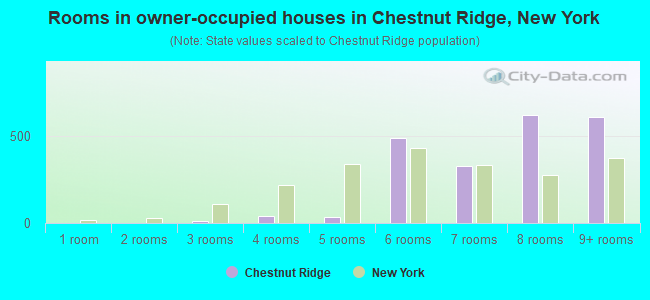
Rooms in owner-occupied houses - 1 room (%)
Rooms in owner-occupied houses - 2 rooms (%)
Rooms in owner-occupied houses - 3 rooms (%)
Rooms in owner-occupied houses - 4 rooms (%)
Rooms in owner-occupied houses - 5 rooms (%)
Rooms in owner-occupied houses - 6 rooms (%)
Rooms in owner-occupied houses - 7 rooms (%)
Rooms in owner-occupied houses - 8 rooms (%)
Rooms in owner-occupied houses - 9+ rooms (%)
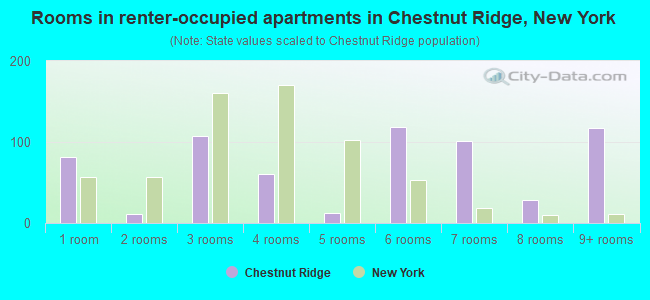
Rooms in renter-occupied houses - 1 room (%)
Rooms in renter-occupied houses - 2 rooms (%)
Rooms in renter-occupied houses - 3 rooms (%)
Rooms in renter-occupied houses - 4 rooms (%)
Rooms in renter-occupied houses - 5 rooms (%)
Rooms in renter-occupied houses - 6 rooms (%)
Rooms in renter-occupied houses - 7 rooms (%)
Rooms in renter-occupied houses - 8 rooms (%)
Rooms in renter-occupied houses - 9+ rooms (%)
Bedrooms in owner-occupied houses - no bedrooms (%)
Bedrooms in owner-occupied houses - 1 bedroom (%)
Bedrooms in owner-occupied houses - 2 bedrooms (%)
Bedrooms in owner-occupied houses - 3 bedrooms (%)
Bedrooms in owner-occupied houses - 4 bedrooms (%)
Bedrooms in owner-occupied houses - 5+ bedrooms (%)
Bedrooms in renter-occupied houses - no bedrooms (%)
Bedrooms in renter-occupied houses - 1 bedroom (%)
Bedrooms in renter-occupied houses - 2 bedrooms (%)
Bedrooms in renter-occupied houses - 3 bedrooms (%)
Bedrooms in renter-occupied houses - 4 bedrooms (%)
Bedrooms in renter-occupied houses - 5+ bedrooms (%)
Vehicles available in owner-occupied houses - no vehicle available (%)
Vehicles available in owner-occupied houses - 1 vehicle available(%)
Vehicles available in owner-occupied houses - 2 Vehicles available (%)
Vehicles available in owner-occupied houses - 3 Vehicles available (%)
Vehicles available in owner-occupied houses - 4 Vehicles available (%)
Vehicles available in owner-occupied houses - 5+ Vehicles available (%)
Vehicles available in renter-occupied houses - no vehicle available (%)
Vehicles available in renter-occupied houses - 1 vehicle available (%)
Vehicles available in renter-occupied houses - 2 Vehicles available (%)
Vehicles available in renter-occupied houses - 3 Vehicles available (%)
Vehicles available in renter-occupied houses - 4 Vehicles available (%)
Vehicles available in renter-occupied houses - 5+ Vehicles available (%)
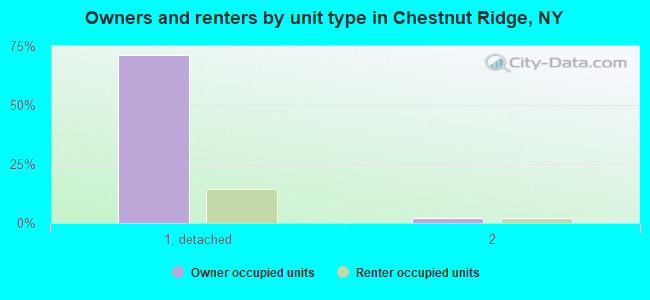
Housing units in structures - 1, detached (%)
Housing units in structures - 1, attached (%)
Housing units in structures - 2 (%)
Housing units in structures - 3 or 4 (%)
Housing units in structures - 5 to 9 (%)
Housing units in structures - 10 to 19 (%)
Housing units in structures - 20 to 49 (%)
Housing units in structures - 50 or more (%)
Housing units in structures - Mobile home (%)
Housing units in structures - Boat, RV, van, etc. (%)
Housing units in structures - Owners - 1, detached (%)
Housing units in structures - Owners - 1, attached (%)
Housing units in structures - Owners - 2 (%)
Housing units in structures - Owners - 3 or 4 (%)
Housing units in structures - Owners - 5 to 9 (%)
Housing units in structures - Owners - 10 to 19 (%)
Housing units in structures - Owners - 20 to 49 (%)
Housing units in structures - Owners - 50 or more (%)
Housing units in structures - Owners - Mobile home (%)
Housing units in structures - Owners - Boat, RV, van, etc. (%)
Housing units in structures - Renters - 1, detached (%)
Housing units in structures - Renters - 1, attached (%)
Housing units in structures - Renters - 2 (%)
Housing units in structures - Renters - 3 or 4 (%)
Housing units in structures - Renters - 5 to 9 (%)
Housing units in structures - Renters - 10 to 19 (%)
Housing units in structures - Renters - 20 to 49 (%)
Housing units in structures - Renters - 50 or more (%)
Housing units in structures - Renters - Mobile home (%)
Housing units in structures - Renters - Boat, RV, van, etc. (%)
House/condo owner moved in on average (years ago)
Renter moved in on average (years ago)
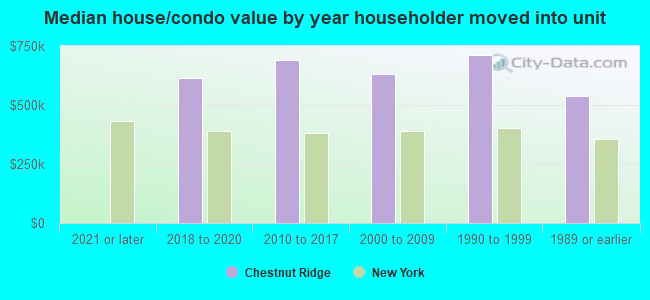
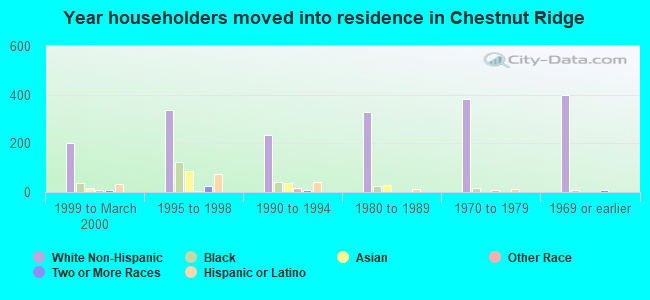
Year householder moved into unit - Moved in 1999 to March 2000 (%)
Year householder moved into unit - Moved in 1999 to March 2000 (%) - White
Year householder moved into unit - Moved in 1999 to March 2000 (%) - Black or African American
Year householder moved into unit - Moved in 1999 to March 2000 (%) - Asian
Year householder moved into unit - Moved in 1999 to March 2000 (%) - Hispanic or Latino
Year householder moved into unit - Moved in 1999 to March 2000 (%) - American Indian and Alaska Native
Year householder moved into unit - Moved in 1999 to March 2000 (%) - Multirace
Year householder moved into unit - Moved in 1999 to March 2000 (%) - Other Race
Year householder moved into unit - Moved in 1995 to 1998 (%)
Year householder moved into unit - Moved in 1995 to 1998 (%) - White
Year householder moved into unit - Moved in 1995 to 1998 (%) - Black or African American
Year householder moved into unit - Moved in 1995 to 1998 (%) - Asian
Year householder moved into unit - Moved in 1995 to 1998 (%) - Hispanic or Latino
Year householder moved into unit - Moved in 1995 to 1998 (%) - American Indian and Alaska Native
Year householder moved into unit - Moved in 1995 to 1998 (%) - Multirace
Year householder moved into unit - Moved in 1995 to 1998 (%) - Other Race
Year householder moved into unit - Moved in 1990 to 1994 (%)
Year householder moved into unit - Moved in 1990 to 1994 (%) - White
Year householder moved into unit - Moved in 1990 to 1994 (%) - Black or African American
Year householder moved into unit - Moved in 1990 to 1994 (%) - Asian
Year householder moved into unit - Moved in 1990 to 1994 (%) - Hispanic or Latino
Year householder moved into unit - Moved in 1990 to 1994 (%) - American Indian and Alaska Native
Year householder moved into unit - Moved in 1990 to 1994 (%) - Multirace
Year householder moved into unit - Moved in 1990 to 1994 (%) - Other Race
Year householder moved into unit - Moved in 1980 to 1989 (%)
Year householder moved into unit - Moved in 1980 to 1989 (%) - White
Year householder moved into unit - Moved in 1980 to 1989 (%) - Black or African American
Year householder moved into unit - Moved in 1980 to 1989 (%) - Asian
Year householder moved into unit - Moved in 1980 to 1989 (%) - Hispanic or Latino
Year householder moved into unit - Moved in 1980 to 1989 (%) - American Indian and Alaska Native
Year householder moved into unit - Moved in 1980 to 1989 (%) - Multirace
Year householder moved into unit - Moved in 1980 to 1989 (%) - Other Race
Year householder moved into unit - Moved in 1970 to 1979 (%)
Year householder moved into unit - Moved in 1970 to 1979 (%) - White
Year householder moved into unit - Moved in 1970 to 1979 (%) - Black or African American
Year householder moved into unit - Moved in 1970 to 1979 (%) - Asian
Year householder moved into unit - Moved in 1970 to 1979 (%) - Hispanic or Latino
Year householder moved into unit - Moved in 1970 to 1979 (%) - American Indian and Alaska Native
Year householder moved into unit - Moved in 1970 to 1979 (%) - Multirace
Year householder moved into unit - Moved in 1970 to 1979 (%) - Other Race
Year householder moved into unit - Moved in 1969 or earlier (%)
Year householder moved into unit - Moved in 1969 or earlier (%) - White
Year householder moved into unit - Moved in 1969 or earlier (%) - Black or African American
Year householder moved into unit - Moved in 1969 or earlier (%) - Asian
Year householder moved into unit - Moved in 1969 or earlier (%) - Hispanic or Latino
Year householder moved into unit - Moved in 1969 or earlier (%) - American Indian and Alaska Native
Year householder moved into unit - Moved in 1969 or earlier (%) - Multirace
Year householder moved into unit - Moved in 1969 or earlier (%) - Other Race
Housing units lacking complete plumbing facilities (%)
Housing units lacking complete kitchen facilities (%)
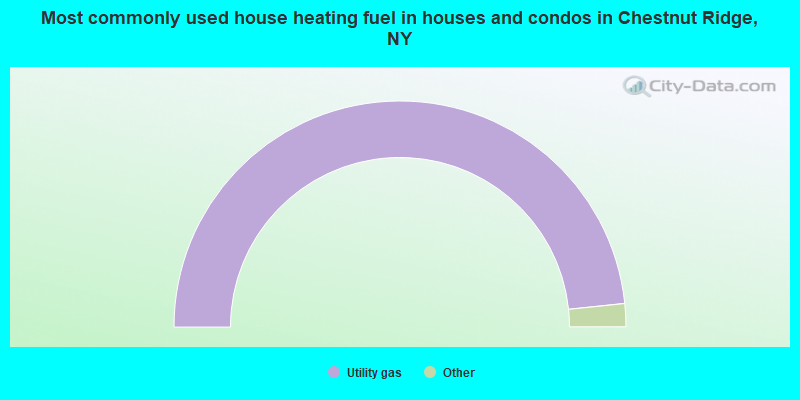
House heating fuel used in houses and condos - Utility gas (%)
House heating fuel used in houses and condos - Bottled, tank, or LP gas (%)
House heating fuel used in houses and condos - Electricity (%)
House heating fuel used in houses and condos - Fuel oil, kerosene, etc. (%)
House heating fuel used in houses and condos - Coal or coke (%)
House heating fuel used in houses and condos - Wood (%)
House heating fuel used in houses and condos - Solar energy (%)
House heating fuel used in houses and condos - Other fuel (%)
House heating fuel used in houses and condos - No fuel used (%)
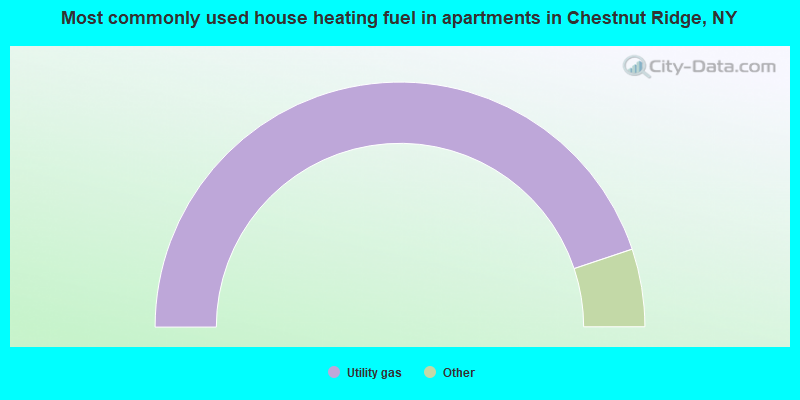
House heating fuel used in apartments - Utility gas (%)
House heating fuel used in apartments - Bottled, tank, or LP gas (%)
House heating fuel used in apartments - Electricity (%)
House heating fuel used in apartments - Fuel oil, kerosene, etc. (%)
House heating fuel used in apartments - Coal or coke (%)
House heating fuel used in apartments - Wood (%)
House heating fuel used in apartments - Solar energy (%)
House heating fuel used in apartments - Other fuel (%)
House heating fuel used in apartments - No fuel used (%)
Median year house/condo built: 1966Median year apartment built: 1973Household type by relationship:
Households: 10,390
Male householders: 1,683 (201 living alone ), Female householders: 1,072 (344 living alone )1,794 spouses (1,786 opposite-sex spouses ), 48 unmarried partners , (48 opposite-sex unmarried partners ), 4,690 children (4,551 natural , 36 adopted , 102 stepchildren ), 91 grandchildren , 25 brothers or sisters , 141 parents , 0 foster children , 267 other relatives , 335 non-relatives In group quarters: 240
Size of family households: 693 2-persons , 163 3-persons , 437 4-persons , 137 5-persons , 214 6-persons , 387 7-or-more-persons .
Size of nonfamily households: 633 1-person , 45 2-persons , 10 3-persons , 37 6-persons .
3,829 married couples with children. single-parent households (38 men , 118 women ).
65.2% of residents of Chestnut Ridge speak English at home. of residents speak Spanish at home (59% speak English very well , 33% speak English well , 6% speak English not well , 3% don't speak English at all ).of residents speak other Indo-European language at home (57% speak English very well , 27% speak English well , 15% speak English not well , 1% don't speak English at all ).of residents speak Asian or Pacific Island language at home (84% speak English very well , 9% speak English well , 7% speak English not well ).of residents speak other language at home (100% speak English very well ).
Foreign born population: 1,377 (13.3%)of them are naturalized citizens )
Median number of rooms in houses and condos:
Median number of rooms in apartments
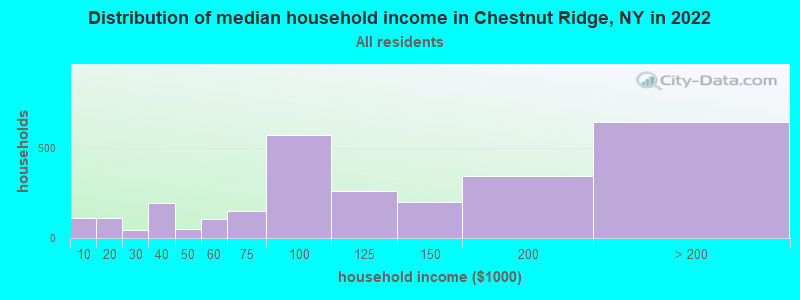
Chestnut Ridge, NY household income distribution 113 Less than $10,000111 $10,000 to $19,99947 $20,000 to $29,999196 $30,000 to $39,99951 $40,000 to $49,999104 $50,000 to $59,999148 $60,000 to $74,999570 $75,000 to $99,999262 $100,000 to $124,999199 $125,000 to $149,999343 $150,000 to $199,999643 $200,000 or more
Home value of owner - occupied houses in 2022 in Chestnut Ridge, NY 8 $40,000 to $49,99910 $60,000 to $69,9998 $90,000 to $99,9998 $100,000 to $124,99922 $200,000 to $249,99955 $300,000 to $399,999321 $400,000 to $499,9991,207 $500,000 to $749,999523 $750,000 to $999,99936 $1,000,000 to $1,499,999Rent paid by renters in 2022 in Chestnut Ridge, NY 99 $200 to $24935 $250 to $29978 $500 to $54943 $650 to $6993 $800 to $89926 $900 to $99914 $1,000 to $1,24946 $1,250 to $1,49970 $1,500 to $1,99947 $2,000 to $2,499149 $2,500 to $2,99911 $3,500 or more156 No cash rent
Percentage of workers working in this county: 59.9%Number of people working at home: 675 (19.2% of all workers )
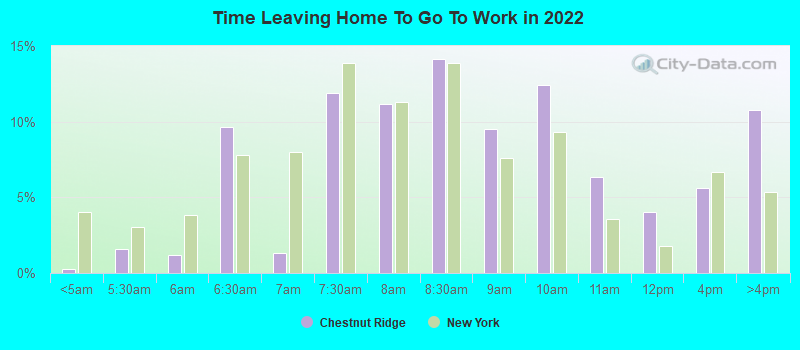
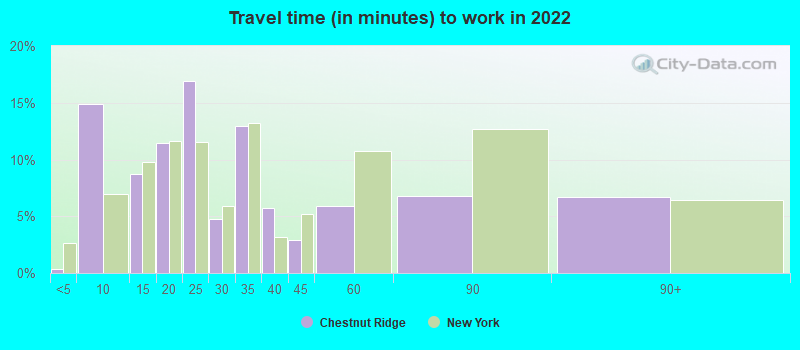
Travel time to work (commute)
Less than 5 minutes: 385 to 9 minutes: 17210 to 14 minutes: 47715 to 19 minutes: 30420 to 24 minutes: 40525 to 29 minutes: 7330 to 34 minutes: 31235 to 39 minutes: 14440 to 44 minutes: 21445 to 59 minutes: 20260 to 89 minutes: 36390 or more minutes: 149
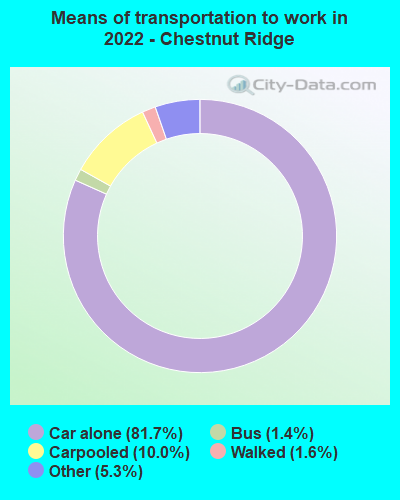
Means of transportation to work:
Drove a car alone: 2,339 (63.4%)Carpooled: 365 (9.9%)Bus : 42 (1.1%)Taxi: 205 (5.6%)Walked: 58 (1.6%)Worked at home: 675 (18.3%)
Unemployment by race in 2022
Unemployment rate for White non-Hispanic residents 2.4% Males4.6% FemalesUnemployment rate for Black residents 10.3% Males14.9% FemalesUnemployment rate for Asian residents 1.7% FemalesUnemployment rate for two or more race residents 2.7% Males6.4% FemalesUnemployment rate for Hispanic or Latino residents 2.8% Males
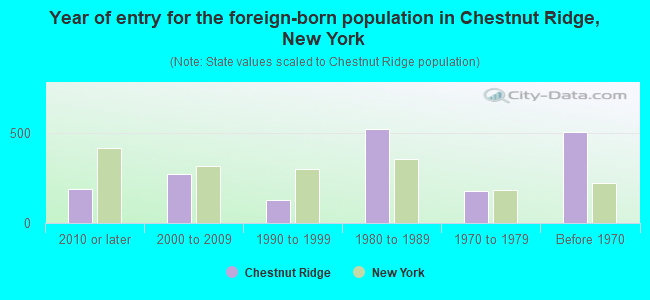
Year of entry for the foreign-born population in Chestnut Ridge, New York
191 2010 or later 274 2000 to 2009 129 1990 to 1999 524 1980 to 1989 177 1970 to 1979 507 Before 1970
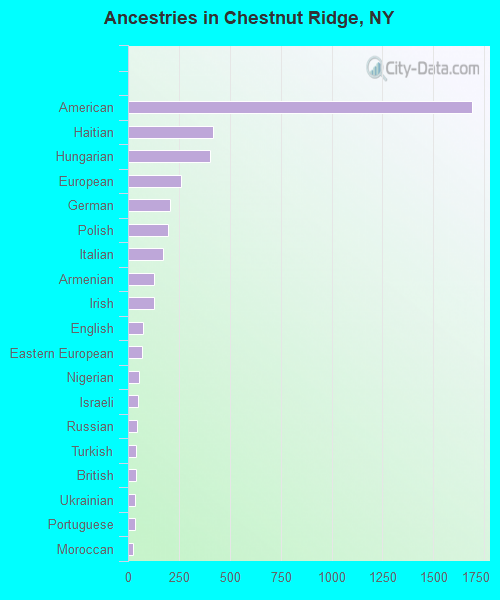
First ancestries reported:
American: 1,689 (28.3%)
Haitian: 419 (7.0%)
Hungarian: 403 (6.8%)
European: 260 (4.4%)
German: 204 (3.4%)
Polish: 195 (3.3%)
Italian: 172 (2.9%)
Armenian: 126 (2.1%)
Irish: 126 (2.1%)
English: 72 (1.2%)
Eastern European: 67 (1.1%)
Nigerian: 53 (0.9%)
Israeli: 47 (0.8%)
Russian: 43 (0.7%)
Turkish: 40 (0.7%)
British: 37 (0.6%)
Ukrainian: 36 (0.6%)
Portuguese: 33 (0.6%)
Moroccan: 24 (0.4%)
Lithuanian: 14 (0.2%)
Ghanaian: 14 (0.2%)
Romanian: 13 (0.2%)
Northern European: 11 (0.2%)
Latvian: 10 (0.2%)
Czechoslovakian: 9 (0.2%)
Scandinavian: 8 (0.1%)
Canadian: 5 (0.08%)
African: 4 (0.07%) Most common places of birth for foreign-born residents (%): Haiti Chestnut Ridge:
16.9% (237)New York:
2.8% (126,936)
Switzerland Chestnut Ridge:
8.1% (114)New York:
0.1% (4,429)
Dominican Republic Chestnut Ridge:
6.2% (87)New York:
11.1% (501,040)
Germany Chestnut Ridge:
6.0% (84)New York:
0.9% (38,713)
Philippines Chestnut Ridge:
5.9% (83)New York:
2.0% (91,070)
United Kingdom, excluding England and Scotland Chestnut Ridge:
5.9% (82)New York:
0.8% (33,869)
Turkey Chestnut Ridge:
4.6% (65)New York:
0.5% (21,009)
El Salvador Chestnut Ridge:
4.5% (63)New York:
2.4% (108,067)
Nigeria Chestnut Ridge:
4.0% (56)New York:
0.7% (33,746)
Argentina Chestnut Ridge:
3.7% (52)New York:
0.5% (21,928)
Ukraine Chestnut Ridge:
3.1% (44)New York:
1.7% (78,421)
India Chestnut Ridge:
2.9% (41)New York:
3.5% (158,432)
Portugal Chestnut Ridge:
2.8% (39)New York:
0.2% (10,519)
England Chestnut Ridge:
2.3% (32)New York:
0.5% (23,058)
Morocco Chestnut Ridge:
2.1% (29)New York:
0.2% (10,005)
Canada Chestnut Ridge:
1.6% (23)New York:
1.3% (59,107)
Italy Chestnut Ridge:
1.6% (23)New York:
1.8% (81,374)
Place of birth for U.S.-born residents:
This state: 6,449Other state: 1,880Northeast: 1,360Midwest: 100South: 357West: 80 90.7% of Chestnut Ridge residents lived in the same house 1 years ago.
Out of people who lived in different houses, 44.6% lived in this county.
Out of people who lived in different counties, 66.0% lived in New York.
Chestnut Ridge:
90.7%State average:
89.6%
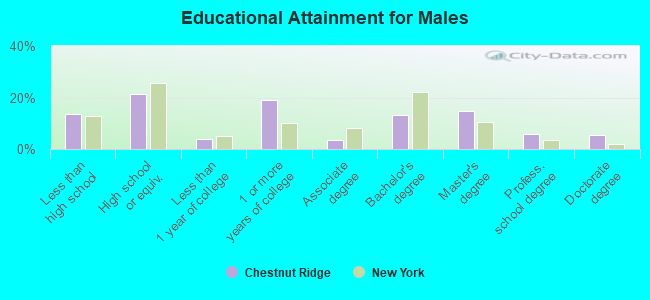
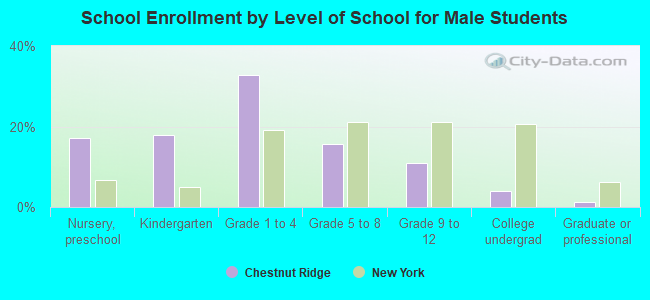
Education attainment for males 25 years and older:
No schooling: 144Nursery to 4th grade: 05th and 6th grade: 317th and 8th grade: 349th grade: 5710th grade: 011th grade: 11612th grade, no diploma: 31High school graduate (or equivalency): 659Less than 1 year of college: 117Some college more than 1 year, no degree: 581Associate degree: 105Bachelor's degree: 403Master's degree: 449Professional school degree: 173Doctorate degree: 161
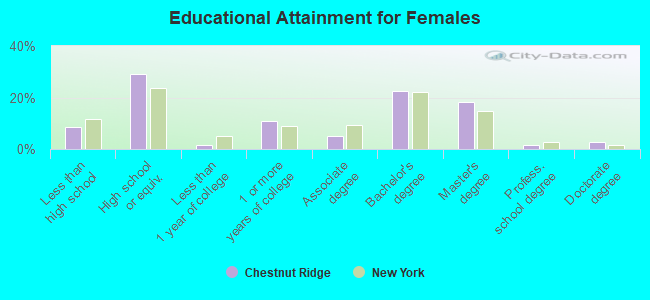
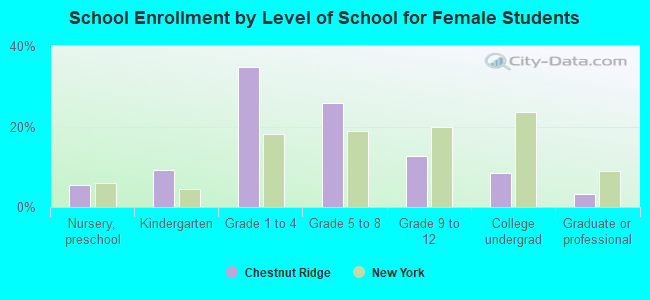
Education attainment for females 25 years and older:
No schooling: 1Nursery to 4th grade: 135th and 6th grade: 207th and 8th grade: 329th grade: 010th grade: 011th grade: 012th grade, no diploma: 179High school graduate (or equivalency): 832Less than 1 year of college: 40Some college more than 1 year, no degree: 311Associate degree: 149Bachelor's degree: 640Master's degree: 524Professional school degree: 42Doctorate degree: 80
Housing units in structures:
One, detached: 2,485One, attached: 84Two: 1553 or 4: 3810 to 19: 1850 or more: 174Housing units lacking complete plumbing facilities in 2022: 0.8%Housing units lacking complete kitchen facilities in 2022: 3.4%House/condo owner moved in on average 14 years ago
Renter moved in on average 3 years ago
Private vs. public school enrollment:
Students in private schools in grades 1 to 8 (elementary and middle school): 1,700 Students in private schools in grades 9 to 12 (high school): 318 Students in private undergraduate colleges: 119