Chelsea, MA (Massachusetts) Houses and Residents
Estimated median house or condo value in 2022: $463,684 (it was $163,200 in 2000 )
Chelsea:
$463,684Massachusetts:
$534,700
Lower value quartile - upper value quartile: $366,944 - $603,239Mean price in 2022: Detached houses: $496,601 Here:
$496,601State:
$651,570
Townhouses or other attached units: $485,398 Here:
$485,398State:
$617,749
In 2-unit structures: $651,933 Here:
$651,933State:
$594,808
In 3-to-4-unit structures: $632,048 Here:
$632,048State:
$601,912
In 5-or-more-unit structures: $416,754 Here:
$416,754State:
$555,768
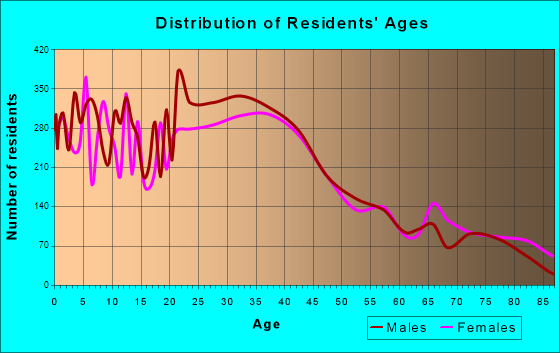
Total population: 38,861 (Urban population: 35,080, Rural population: 0)
Houses: 14,400 (13,650 occupied: 3,864 owner occupied, 9,974 renter occupied )
% of renters here:
72%State:
38%
Housing density: 6,583 houses/condos per square mile
Median price asked for vacant for-sale houses and condos in 2022: $340,247.
Median contract rent in 2022: $1,625 (lower quartile is $1,030, upper quartile is over $2,000)
Median rent asked for vacant for-rent units in 2022: $1,730
Median gross rent in Chelsea, MA in 2022: $1,794
Housing units in Chelsea with a mortgage: 2,728 (235 second mortgage, 30 home equity loan, 141 both second mortgage and home equity loan )Houses without a mortgage: 24
Median household income for houses/condos with a mortgage: $114,249
Median household income for apartments without a mortgage: $71,624
Median monthly housing costs: $1,830
Data:
Median house or condo value ($)
Median house or condo value ($ change since 2000)
Median house or condo value ($) - White
Median house or condo value ($) - Black or African American
Median house or condo value ($) - Asian
Median house or condo value ($) - Hispanic or Latino
Median house or condo value ($) - American Indian and Alaska Native
Median house or condo value ($) - Multirace
Median house or condo value ($) - Other Race
Median price asked for mobile homes ($)
Household density (households per square mile)
Mean house or condo value by units in structure - 1, detached ($)
Mean house or condo value by units in structure - 1, attached ($)
Mean house or condo value by units in structure - 2 ($)
Mean house or condo value by units in structure by units in structure - 3 or 4 ($)
Mean house or condo value by units in structure - 5 or more ($)
Mean house or condo value by units in structure - Boat, RV, van, etc. ($)
Mean house or condo value by units in structure - Mobile home ($)
Median contract rent ($)
Median contract rent - Lower quartile ($)
Median contract rent - Upper quartile ($)
Median gross rent ($)
Urban houses (%)
Rural houses (%)
Houses occupied (%)
Houses occupied (% change since 2000)
Houses owner occupied (%)
Houses owner occupied (% change since 2000)
Houses renter occupied (%)
Houses renter occupied (% change since 2000)
Vacant housing units - For rent (%)
Vacant housing units - For rent (% change since 2000)
Vacant housing units - For sale only (%)
Vacant housing units - For sale only (% change since 2000)
Vacant housing units - Rented or sold, not occupied (%)
Vacant housing units - Rented or sold, not occupied (% change since 2000)
Vacant housing units - For seasonal, recreational, or occasional use (%)
Vacant housing units - For seasonal, recreational, or occasional use (% change since 2000)
Vacant housing units - For migrant workers (%)
Vacant housing units - For migrant workers (% change since 2000)
Vacant housing units - Other vacant (%)
Vacant housing units - Other vacant (% change since 2000)
Median monthly housing costs ($)
Median household income for houses/condos with a mortgage ($)
Median household income for houses/condos without a mortgage ($)
Median household income ($)
Median household income ($) - White
Median household income ($) - Black or African American
Median household income ($) - Asian
Median household income ($) - Hispanic or Latino
Median household income ($) - American Indian and Alaska Native
Median household income ($) - Multirace
Median household income ($) - Other Race
Mortgage status - with mortgage (%)
Mortgage status - with second mortgage (%)
Mortgage status - with home equity loan (%)
Mortgage status - with both second mortgage and home equity loan (%)
Mortgage status - without a mortgage (%)
Median year house/condo built
Median year apartment built
Household type by relationship - Male householder living alone (%)
Household type by relationship - Male householder not living alone (%)
Household type by relationship - Female householder living alone (%)
Household type by relationship - Female householder not living alone (%)
Household type by relationship - Opposite-Sex spouse (%)
Household type by relationship - Same-Sex spouse (%)
Household type by relationship - Opposite-Sex unmarried partner (%)
Household type by relationship - Same-Sex unmarried partner (%)
Household type by relationship - In group quarters (%)
Size of family households - 2-person household (%)
Size of family households - 3-person household (%)
Size of family households - 4-person household (%)
Size of family households - 5-person household (%)
Size of family households - 6-person household (%)
Size of family households - 7-or-more-person household (%)
Size of nonfamily households - 1-person household (%)
Size of nonfamily households - 2-person household (%)
Size of nonfamily households - 3-person household (%)
Size of nonfamily households - 4-person household (%)
Size of nonfamily households - 5-person household (%)
Size of nonfamily households - 6-person household (%)
Size of nonfamily households - 7-or-moreperson household (%)
Year house built - Built 2010 or later (%)
Year house built - Built 2000 to 2009 (%)
Year house built - Built 1990 to 1999 (%)
Year house built - Built 1980 to 1989 (%)
Year house built - Built 1970 to 1979 (%)
Year house built - Built 1960 to 1969 (%)
Year house built - Built 1950 to 1959 (%)
Year house built - Built 1940 to 1949 (%)
Year house built - Built 1939 or earlier (%)
Median number of rooms in houses and condos
Median number of rooms in apartments
Median number of bedrooms in owner occupied houses
Mean number of bedrooms in owner occupied houses
Median number of bedrooms in renter occupied houses
Mean number of bedrooms in renter occupied houses
Median number of vehichles in owner occupied houses
Mean number of vehichles in owner occupied houses
Median number of vehichles in renter occupied houses
Mean number of vehichles in renter occupied houses
Rooms in owner-occupied houses - 1 room (%)
Rooms in owner-occupied houses - 2 rooms (%)
Rooms in owner-occupied houses - 3 rooms (%)
Rooms in owner-occupied houses - 4 rooms (%)
Rooms in owner-occupied houses - 5 rooms (%)
Rooms in owner-occupied houses - 6 rooms (%)
Rooms in owner-occupied houses - 7 rooms (%)
Rooms in owner-occupied houses - 8 rooms (%)
Rooms in owner-occupied houses - 9+ rooms (%)
Rooms in renter-occupied houses - 1 room (%)
Rooms in renter-occupied houses - 2 rooms (%)
Rooms in renter-occupied houses - 3 rooms (%)
Rooms in renter-occupied houses - 4 rooms (%)
Rooms in renter-occupied houses - 5 rooms (%)
Rooms in renter-occupied houses - 6 rooms (%)
Rooms in renter-occupied houses - 7 rooms (%)
Rooms in renter-occupied houses - 8 rooms (%)
Rooms in renter-occupied houses - 9+ rooms (%)
Bedrooms in owner-occupied houses - no bedrooms (%)
Bedrooms in owner-occupied houses - 1 bedroom (%)
Bedrooms in owner-occupied houses - 2 bedrooms (%)
Bedrooms in owner-occupied houses - 3 bedrooms (%)
Bedrooms in owner-occupied houses - 4 bedrooms (%)
Bedrooms in owner-occupied houses - 5+ bedrooms (%)
Bedrooms in renter-occupied houses - no bedrooms (%)
Bedrooms in renter-occupied houses - 1 bedroom (%)
Bedrooms in renter-occupied houses - 2 bedrooms (%)
Bedrooms in renter-occupied houses - 3 bedrooms (%)
Bedrooms in renter-occupied houses - 4 bedrooms (%)
Bedrooms in renter-occupied houses - 5+ bedrooms (%)
Vehicles available in owner-occupied houses - no vehicle available (%)
Vehicles available in owner-occupied houses - 1 vehicle available(%)
Vehicles available in owner-occupied houses - 2 Vehicles available (%)
Vehicles available in owner-occupied houses - 3 Vehicles available (%)
Vehicles available in owner-occupied houses - 4 Vehicles available (%)
Vehicles available in owner-occupied houses - 5+ Vehicles available (%)
Vehicles available in renter-occupied houses - no vehicle available (%)
Vehicles available in renter-occupied houses - 1 vehicle available (%)
Vehicles available in renter-occupied houses - 2 Vehicles available (%)
Vehicles available in renter-occupied houses - 3 Vehicles available (%)
Vehicles available in renter-occupied houses - 4 Vehicles available (%)
Vehicles available in renter-occupied houses - 5+ Vehicles available (%)
Housing units in structures - 1, detached (%)
Housing units in structures - 1, attached (%)
Housing units in structures - 2 (%)
Housing units in structures - 3 or 4 (%)
Housing units in structures - 5 to 9 (%)
Housing units in structures - 10 to 19 (%)
Housing units in structures - 20 to 49 (%)
Housing units in structures - 50 or more (%)
Housing units in structures - Mobile home (%)
Housing units in structures - Boat, RV, van, etc. (%)
Housing units in structures - Owners - 1, detached (%)
Housing units in structures - Owners - 1, attached (%)
Housing units in structures - Owners - 2 (%)
Housing units in structures - Owners - 3 or 4 (%)
Housing units in structures - Owners - 5 to 9 (%)
Housing units in structures - Owners - 10 to 19 (%)
Housing units in structures - Owners - 20 to 49 (%)
Housing units in structures - Owners - 50 or more (%)
Housing units in structures - Owners - Mobile home (%)
Housing units in structures - Owners - Boat, RV, van, etc. (%)
Housing units in structures - Renters - 1, detached (%)
Housing units in structures - Renters - 1, attached (%)
Housing units in structures - Renters - 2 (%)
Housing units in structures - Renters - 3 or 4 (%)
Housing units in structures - Renters - 5 to 9 (%)
Housing units in structures - Renters - 10 to 19 (%)
Housing units in structures - Renters - 20 to 49 (%)
Housing units in structures - Renters - 50 or more (%)
Housing units in structures - Renters - Mobile home (%)
Housing units in structures - Renters - Boat, RV, van, etc. (%)
House/condo owner moved in on average (years ago)
Renter moved in on average (years ago)
Year householder moved into unit - Moved in 1999 to March 2000 (%)
Year householder moved into unit - Moved in 1999 to March 2000 (%) - White
Year householder moved into unit - Moved in 1999 to March 2000 (%) - Black or African American
Year householder moved into unit - Moved in 1999 to March 2000 (%) - Asian
Year householder moved into unit - Moved in 1999 to March 2000 (%) - Hispanic or Latino
Year householder moved into unit - Moved in 1999 to March 2000 (%) - American Indian and Alaska Native
Year householder moved into unit - Moved in 1999 to March 2000 (%) - Multirace
Year householder moved into unit - Moved in 1999 to March 2000 (%) - Other Race
Year householder moved into unit - Moved in 1995 to 1998 (%)
Year householder moved into unit - Moved in 1995 to 1998 (%) - White
Year householder moved into unit - Moved in 1995 to 1998 (%) - Black or African American
Year householder moved into unit - Moved in 1995 to 1998 (%) - Asian
Year householder moved into unit - Moved in 1995 to 1998 (%) - Hispanic or Latino
Year householder moved into unit - Moved in 1995 to 1998 (%) - American Indian and Alaska Native
Year householder moved into unit - Moved in 1995 to 1998 (%) - Multirace
Year householder moved into unit - Moved in 1995 to 1998 (%) - Other Race
Year householder moved into unit - Moved in 1990 to 1994 (%)
Year householder moved into unit - Moved in 1990 to 1994 (%) - White
Year householder moved into unit - Moved in 1990 to 1994 (%) - Black or African American
Year householder moved into unit - Moved in 1990 to 1994 (%) - Asian
Year householder moved into unit - Moved in 1990 to 1994 (%) - Hispanic or Latino
Year householder moved into unit - Moved in 1990 to 1994 (%) - American Indian and Alaska Native
Year householder moved into unit - Moved in 1990 to 1994 (%) - Multirace
Year householder moved into unit - Moved in 1990 to 1994 (%) - Other Race
Year householder moved into unit - Moved in 1980 to 1989 (%)
Year householder moved into unit - Moved in 1980 to 1989 (%) - White
Year householder moved into unit - Moved in 1980 to 1989 (%) - Black or African American
Year householder moved into unit - Moved in 1980 to 1989 (%) - Asian
Year householder moved into unit - Moved in 1980 to 1989 (%) - Hispanic or Latino
Year householder moved into unit - Moved in 1980 to 1989 (%) - American Indian and Alaska Native
Year householder moved into unit - Moved in 1980 to 1989 (%) - Multirace
Year householder moved into unit - Moved in 1980 to 1989 (%) - Other Race
Year householder moved into unit - Moved in 1970 to 1979 (%)
Year householder moved into unit - Moved in 1970 to 1979 (%) - White
Year householder moved into unit - Moved in 1970 to 1979 (%) - Black or African American
Year householder moved into unit - Moved in 1970 to 1979 (%) - Asian
Year householder moved into unit - Moved in 1970 to 1979 (%) - Hispanic or Latino
Year householder moved into unit - Moved in 1970 to 1979 (%) - American Indian and Alaska Native
Year householder moved into unit - Moved in 1970 to 1979 (%) - Multirace
Year householder moved into unit - Moved in 1970 to 1979 (%) - Other Race
Year householder moved into unit - Moved in 1969 or earlier (%)
Year householder moved into unit - Moved in 1969 or earlier (%) - White
Year householder moved into unit - Moved in 1969 or earlier (%) - Black or African American
Year householder moved into unit - Moved in 1969 or earlier (%) - Asian
Year householder moved into unit - Moved in 1969 or earlier (%) - Hispanic or Latino
Year householder moved into unit - Moved in 1969 or earlier (%) - American Indian and Alaska Native
Year householder moved into unit - Moved in 1969 or earlier (%) - Multirace
Year householder moved into unit - Moved in 1969 or earlier (%) - Other Race
Housing units lacking complete plumbing facilities (%)
Housing units lacking complete kitchen facilities (%)
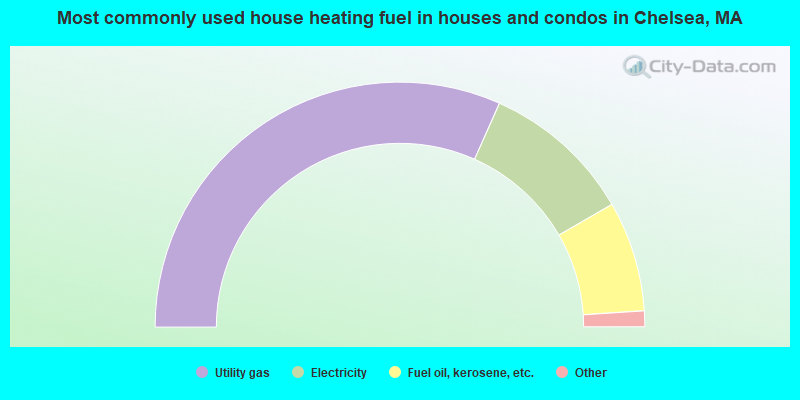
House heating fuel used in houses and condos - Utility gas (%)
House heating fuel used in houses and condos - Bottled, tank, or LP gas (%)
House heating fuel used in houses and condos - Electricity (%)
House heating fuel used in houses and condos - Fuel oil, kerosene, etc. (%)
House heating fuel used in houses and condos - Coal or coke (%)
House heating fuel used in houses and condos - Wood (%)
House heating fuel used in houses and condos - Solar energy (%)
House heating fuel used in houses and condos - Other fuel (%)
House heating fuel used in houses and condos - No fuel used (%)
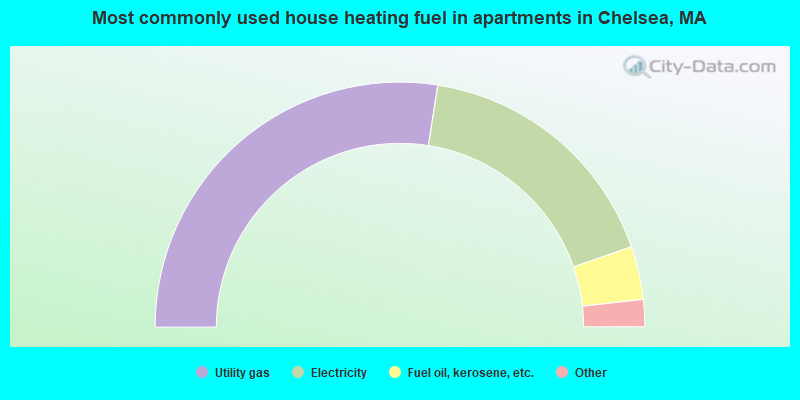
House heating fuel used in apartments - Utility gas (%)
House heating fuel used in apartments - Bottled, tank, or LP gas (%)
House heating fuel used in apartments - Electricity (%)
House heating fuel used in apartments - Fuel oil, kerosene, etc. (%)
House heating fuel used in apartments - Coal or coke (%)
House heating fuel used in apartments - Wood (%)
House heating fuel used in apartments - Solar energy (%)
House heating fuel used in apartments - Other fuel (%)
House heating fuel used in apartments - No fuel used (%)
Latest news about housing in Chelsea, MA collected exclusively by city-data.com from local newspapers, TV, and radio stations
Median year house/condo built: 1938Median year apartment built: 1956Household type by relationship:
Households: 38,921
Male householders: 6,810 (2,245 living alone ), Female householders: 6,250 (2,210 living alone )4,148 spouses (4,074 opposite-sex spouses ), 1,379 unmarried partners , (1,341 opposite-sex unmarried partners ), 10,941 children (9,993 natural , 196 adopted , 752 stepchildren ), 1,175 grandchildren , 1,348 brothers or sisters , 1,013 parents , 0 foster children , 1,705 other relatives , 3,370 non-relatives In group quarters: 776
Size of family households: 1,831 2-persons , 1,602 3-persons , 1,655 4-persons , 1,506 5-persons , 269 6-persons , 679 7-or-more-persons .
Size of nonfamily households: 4,823 1-person , 1,031 2-persons , 150 3-persons , 141 4-persons , 83 5-persons , 12 6-persons .
3,803 married couples with children. single-parent households (982 men , 2,307 women ).
29.5% of residents of Chelsea speak English at home. of residents speak Spanish at home (38% speak English very well , 19% speak English well , 27% speak English not well , 16% don't speak English at all ).of residents speak other Indo-European language at home (54% speak English very well , 23% speak English well , 20% speak English not well , 4% don't speak English at all ).of residents speak Asian or Pacific Island language at home (46% speak English very well , 34% speak English well , 13% speak English not well , 7% don't speak English at all ).of residents speak other language at home (50% speak English very well , 26% speak English well , 23% speak English not well , 1% don't speak English at all ).
Foreign born population: 18,095 (46.5%)of them are naturalized citizens )
Median number of rooms in houses and condos:
Median number of rooms in apartments
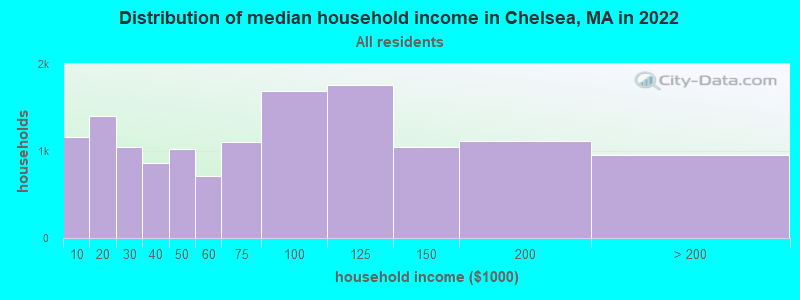
Chelsea, MA household income distribution 1,157 Less than $10,0001,397 $10,000 to $19,9991,049 $20,000 to $29,999866 $30,000 to $39,9991,019 $40,000 to $49,999718 $50,000 to $59,9991,104 $60,000 to $74,9991,692 $75,000 to $99,9991,756 $100,000 to $124,9991,048 $125,000 to $149,9991,110 $150,000 to $199,999951 $200,000 or more
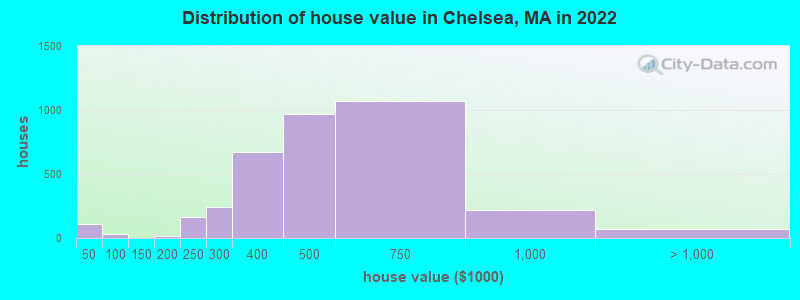
Home value of owner - occupied houses in 2022 in Chelsea, MA 82 Less than $10,00012 $15,000 to $19,99911 $20,000 to $24,99912 $60,000 to $69,9999 $70,000 to $79,9995 $80,000 to $89,99918 $175,000 to $199,999161 $200,000 to $249,999244 $250,000 to $299,999670 $300,000 to $399,999965 $400,000 to $499,9991,071 $500,000 to $749,999215 $750,000 to $999,99930 $1,000,000 to $1,499,99939 $2,000,000 or moreRent paid by renters in 2022 in Chelsea, MA 7 Less than $100125 $100 to $149173 $150 to $199155 $200 to $249194 $250 to $299295 $300 to $349164 $350 to $399208 $400 to $44997 $450 to $499125 $500 to $54978 $550 to $59959 $600 to $64915 $650 to $69948 $700 to $749223 $750 to $79995 $800 to $899287 $900 to $999730 $1,000 to $1,2491,135 $1,250 to $1,4992,589 $1,500 to $1,9992,009 $2,000 to $2,499832 $2,500 to $2,99969 $3,000 to $3,49917 $3,500 or more66 No cash rent
Percentage of workers working in this county: 68.3%Number of people working at home: 2,033 (10.5% of all workers )
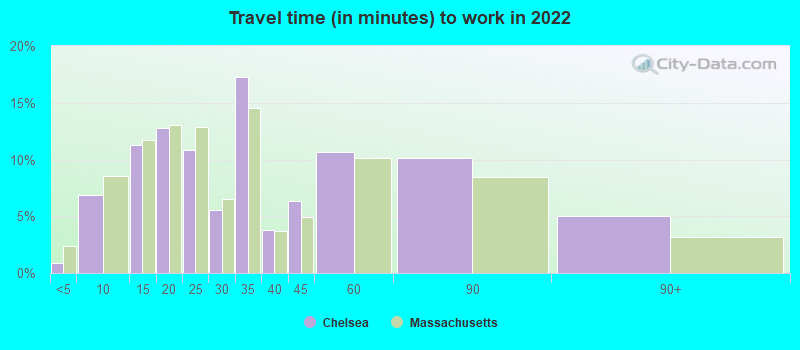
Travel time to work (commute)
Less than 5 minutes: 1195 to 9 minutes: 1,13610 to 14 minutes: 1,51915 to 19 minutes: 2,03220 to 24 minutes: 2,29225 to 29 minutes: 81530 to 34 minutes: 2,68735 to 39 minutes: 52040 to 44 minutes: 76345 to 59 minutes: 2,04160 to 89 minutes: 1,93590 or more minutes: 987
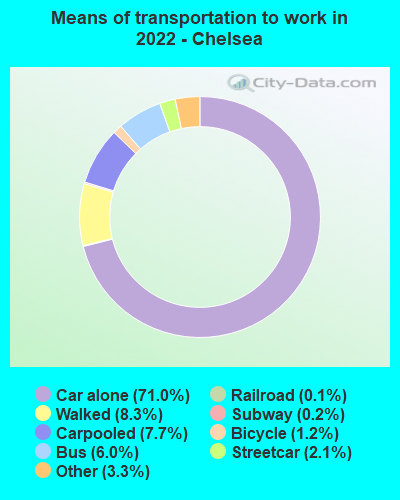
Means of transportation to work:
Drove a car alone: 9,702 (65.0%)Carpooled: 1,165 (7.8%)Bus : 778 (5.2%)Subway or elevated rail : 232 (1.6%)Long-distance train or commuter rail : 20 (0.1%)Light rail, streetcar or trolley : 15 (0.1%)Taxi: 482 (3.2%)Bicycle: 169 (1.1%)Walked: 1,107 (7.4%)Worked at home: 2,033 (13.6%)
Unemployment by race in 2022
Unemployment rate for White non-Hispanic residents 1.8% Males1.7% FemalesUnemployment rate for Black residents 5.1% MalesUnemployment rate for Asian residents 12.9% FemalesUnemployment rate for other race residents 8.2% Males7.2% FemalesUnemployment rate for two or more race residents 7.0% Males9.7% FemalesUnemployment rate for Hispanic or Latino residents 6.9% Males9.3% Females
Year of entry for the foreign-born population in Chelsea, Massachusetts
7,160 2010 or later 4,505 2000 to 2009 3,153 1990 to 1999 3,675 1980 to 1989 796 1970 to 1979 691 Before 1970
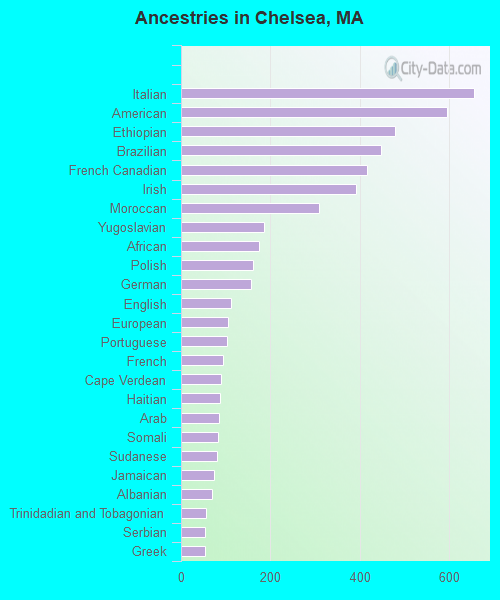
First ancestries reported:
Italian: 657 (2.4%)
American: 596 (2.2%)
Ethiopian: 480 (1.7%)
Brazilian: 449 (1.6%)
French Canadian: 416 (1.5%)
Irish: 392 (1.4%)
Moroccan: 309 (1.1%)
Yugoslavian: 185 (0.7%)
African: 175 (0.6%)
Polish: 161 (0.6%)
German: 156 (0.6%)
English: 113 (0.4%)
European: 105 (0.4%)
Portuguese: 102 (0.4%)
French: 93 (0.3%)
Cape Verdean: 90 (0.3%)
Haitian: 88 (0.3%)
Arab: 86 (0.3%)
Somali: 83 (0.3%)
Sudanese: 81 (0.3%)
Jamaican: 74 (0.3%)
Albanian: 69 (0.3%)
Trinidadian and Tobagonian: 57 (0.2%)
Serbian: 54 (0.2%)
Greek: 54 (0.2%)
British: 42 (0.2%)
Canadian: 41 (0.1%)
Lebanese: 36 (0.1%)
Iraqi: 34 (0.1%)
Ukrainian: 26 (0.09%)
Turkish: 24 (0.09%)
West Indian: 22 (0.08%)
Iranian: 18 (0.07%)
Scottish: 17 (0.06%)
Eastern European: 13 (0.05%)
Afghan: 13 (0.05%)
Bulgarian: 13 (0.05%)
Norwegian: 12 (0.04%)
Nigerian: 12 (0.04%)
Syrian: 12 (0.04%)
Swiss: 11 (0.04%)
Russian: 8 (0.03%)
Scotch-Irish: 7 (0.03%)
Ugandan: 7 (0.03%)
Swedish: 5 (0.02%)
Armenian: 2 (0.01%)
Kenyan: 2 (0.01%)
Liberian: 2 (0.01%)
Most common places of birth for foreign-born residents (%): El Salvador Chelsea:
35.7% (6,878)Massachusetts:
3.7% (45,667)
Honduras Chelsea:
13.1% (2,521)Massachusetts:
1.1% (13,563)
Guatemala Chelsea:
12.8% (2,458)Massachusetts:
2.7% (32,733)
Dominican Republic Chelsea:
5.9% (1,127)Massachusetts:
8.3% (101,767)
Colombia Chelsea:
5.7% (1,104)Massachusetts:
2.3% (27,810)
Brazil Chelsea:
3.1% (597)Massachusetts:
7.6% (92,959)
Ethiopia Chelsea:
2.1% (412)Massachusetts:
0.4% (5,467)
Place of birth for U.S.-born residents:
This state: 15,116Other state: 2,937Northeast: 1,485Midwest: 477South: 615West: 346 83.2% of Chelsea residents lived in the same house 1 years ago.
Out of people who lived in different houses, 32.4% lived in this county.
Out of people who lived in different counties, 62.0% lived in Massachusetts.
Chelsea:
83.2%State average:
87.7%
Education attainment for males 25 years and older:
No schooling: 756Nursery to 4th grade: 7425th and 6th grade: 9337th and 8th grade: 4359th grade: 82610th grade: 55611th grade: 16612th grade, no diploma: 212High school graduate (or equivalency): 4,077Less than 1 year of college: 774Some college more than 1 year, no degree: 951Associate degree: 626Bachelor's degree: 2,307Master's degree: 474Professional school degree: 166Doctorate degree: 105
Education attainment for females 25 years and older:
No schooling: 790Nursery to 4th grade: 5485th and 6th grade: 7667th and 8th grade: 4559th grade: 74010th grade: 11911th grade: 13112th grade, no diploma: 191High school graduate (or equivalency): 4,044Less than 1 year of college: 431Some college more than 1 year, no degree: 830Associate degree: 513Bachelor's degree: 1,694Master's degree: 788Professional school degree: 170Doctorate degree: 78
Housing units in structures:
One, detached: 1,179One, attached: 554Two: 2,7473 or 4: 4,0555 to 9: 1,04310 to 19: 77120 to 49: 1,17150 or more: 2,843Mobile homes: 32Housing units lacking complete plumbing facilities in 2022: 0.8%Housing units lacking complete kitchen facilities in 2022: 1.5%House/condo owner moved in on average 10 years ago
Renter moved in on average 2 years ago
Private vs. public school enrollment:
Students in private schools in grades 1 to 8 (elementary and middle school): 179 Here:
4.8%Massachusetts:
10.3%
Students in private schools in grades 9 to 12 (high school): 157 Here:
8.7%Massachusetts:
12.3%
Students in private undergraduate colleges: 360 Here:
27.3%Massachusetts:
51.2%