Chantilly, VA (Virginia) Houses and Residents
| Chantilly: | $639,755 |
| Virginia: | $365,700 |
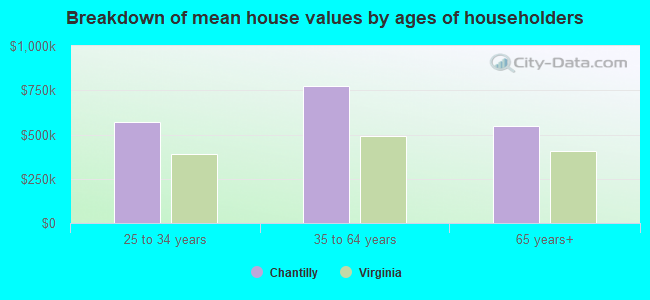
Mean price in 2022:
Detached houses: $805,386
Here: $805,386 State: $472,865 Townhouses or other attached units: $452,121
Here: $452,121 State: $457,437 In 3-to-4-unit structures: $400,396
Here: $400,396 State: $252,346 In 5-or-more-unit structures: $312,151
Here: $312,151 State: $382,551 Mobile homes: $67,501
Here: $67,501 State: $100,736
Total population: 23,039 (All urban)
Houses: 7,310 (7,234 occupied: 5,843 owner occupied, 1,431 renter occupied)
| % of renters here: | 20% |
| State: | 33% |
Housing density: 627 houses/condos per square mile
Median price asked for vacant for-sale houses and condos in 2022: $653,335.
Median contract rent in 2022: $1,812 (lower quartile is $1,594, upper quartile is over $2,000)
Median rent asked for vacant for-rent units in 2022: $4,995
Median gross rent in Chantilly, VA in 2022: over $2,000
Housing units in Chantilly with a mortgage: 4,201 (416 second mortgage, 31 home equity loan, 322 both second mortgage and home equity loan)
Houses without a mortgage: 258
Median household income for houses/condos with a mortgage: $168,750
Median household income for apartments without a mortgage: $119,795
Median monthly housing costs: $2,152
Compare current foreclosures in Chantilly, VA:
| Photo | Address | Area | Beds / Baths | Price | Details |
|---|---|---|---|---|---|

|
#1
Willoughby Ct
Chantilly, VA 20151
|
950 sq. feet
|
2 baths 4 beds |
show details | |

|
#2
Glasgow Dr
Chantilly, VA 20152
|
5,035 sq. feet
|
5 baths 5 beds |
show details | |

|
#3
Kimberley Glen Ct
Chantilly, VA 20151
|
1,264 sq. feet
|
2 baths 3 beds |
show details | |

|
#4
Pleasant Meadow Ct
Chantilly, VA 20151
|
1,294 sq. feet
|
2 baths 3 beds |
show details | |

|
#5
King Charles Dr
Chantilly, VA 20151
|
1,864 sq. feet
|
2 baths 4 beds |
show details | |

|
#6
Flatlick Branch Dr
Chantilly, VA 20151
|
1,070 sq. feet
|
2 baths 4 beds |
show details | |

|
#7
Roger Mack Ct
Chantilly, VA 20151
|
2,760 sq. feet
|
3 baths 4 beds |
show details | |

|
#8
Paramount Pl
Chantilly, VA 20152
|
3,372 sq. feet
|
3 baths 4 beds |
show details | |

|
#9
De Haven Dr
Chantilly, VA 20151
|
1,216 sq. feet
|
3 baths 4 beds |
show details | |

|
#10
Mountcastle Dr
Chantilly, VA 20152
|
4,368 sq. feet
|
4 baths 4 beds |
show details |
| Photo | Address | Area | Beds / Baths | Price | Details |
|---|---|---|---|---|---|

|
#11
Newport Dr
Chantilly, VA 20151
|
1,280 sq. feet
|
3 baths 4 beds |
show details | |

|
#12
Katama Sq
Chantilly, VA 20152
|
2,252 sq. feet
|
2 baths - beds |
show details | |

|
#13
Pamplin Ter # 67a
Chantilly, VA 20152
|
1,574 sq. feet
|
3 baths - beds |
show details | |

|
#14
Flintonbridge Dr
Chantilly, VA 20152
|
2,642 sq. feet
|
2 baths - beds |
show details | |

|
#15
Smallwood Ter
Chantilly, VA 20152
|
1,566 sq. feet
|
3 baths - beds |
show details | |

|
#16
Pamplin Ter # 67a
Chantilly, VA 20152
|
1,574 sq. feet
|
3 baths - beds |
show details | |

|
#17
Edgewater St
Chantilly, VA 20152
|
1,584 sq. feet
|
3 baths - beds |
show details | |

|
#18
Harris St
Chantilly, VA 20152
|
3,756 sq. feet
|
3 baths - beds |
show details | |

|
#19
Shultz Ter
Chantilly, VA 20152
|
1,538 sq. feet
|
3 baths - beds |
show details | |

|
#20
Sandman Ter
Chantilly, VA 20152
|
2,280 sq. feet
|
2 baths - beds |
show details |
| Photo | Address | Area | Beds / Baths | Price | Details |
|---|---|---|---|---|---|

|
#21
Vaira Ter
Chantilly, VA 20152
|
- sq. feet
|
- baths - beds |
show details | |

|
#22
Lightfoot St, Unit 220
Chantilly, VA 20151
|
- sq. feet
|
- baths - beds |
show details | |

|
#23
Trans World Ave
Chantilly, VA 20151
|
- sq. feet
|
- baths - beds |
show details | |

|
#24
Harvest Hills Dr
Chantilly, VA 20152
|
- sq. feet
|
- baths - beds |
show details | |

|
#25
Thunderbolt Pl
Chantilly, VA 20151
|
- sq. feet
|
- baths - beds |
show details | |

|
#26
Marble Rock Dr
Chantilly, VA 20151
|
- sq. feet
|
- baths - beds |
show details | |

|
#27
Riding Center Dr
Chantilly, VA 20152
|
- sq. feet
|
- baths - beds |
show details | |

|
#28
Pleasant Valley Rd
Chantilly, VA 20152
|
- sq. feet
|
- baths - beds |
show details | |

|
#29
Rockland Village Dr Apt 104
Chantilly, VA 20151
|
- sq. feet
|
- baths - beds |
show details | |

|
#30
Barrymoore Pl
Chantilly, VA 20152
|
- sq. feet
|
- baths - beds |
show details |
| Photo | Address | Area | Beds / Baths | Price | Details |
|---|---|---|---|---|---|

|
Check over 1 million property listings on Foreclosure.com!
|
browse all offers | |||
| Photo | Address | Area | Beds / Baths | Price | Details |
|---|

Latest news about housing in Chantilly, VA collected exclusively by city-data.com from local newspapers, TV, and radio stations


Median year apartment built: 1990
Household type by relationship:
Households: 22,965- Male householders: 4,403 (465 living alone), Female householders: 2,739 (632 living alone)
4,934 spouses (4,910 opposite-sex spouses), 230 unmarried partners, (230 opposite-sex unmarried partners), 7,617 children (7,046 natural, 270 adopted, 300 stepchildren), 329 grandchildren, 344 brothers or sisters, 605 parents, 0 foster children, 904 other relatives, 836 non-relatives
- In group quarters: 18
Size of family households: 1,854 2-persons, 1,242 3-persons, 1,610 4-persons, 714 5-persons, 157 6-persons, 226 7-or-more-persons.
Size of nonfamily households: 1,131 1-person, 199 2-persons, 63 3-persons, 33 4-persons.
4,299 married couples with children.
596 single-parent households (177 men, 419 women).
46.0% of residents of Chantilly speak English at home.
14.4% of residents speak Spanish at home (45% speak English very well, 28% speak English well, 20% speak English not well, 7% don't speak English at all).
17.6% of residents speak other Indo-European language at home (58% speak English very well, 35% speak English well, 5% speak English not well, 2% don't speak English at all).
20.2% of residents speak Asian or Pacific Island language at home (59% speak English very well, 27% speak English well, 11% speak English not well, 3% don't speak English at all).
2.0% of residents speak other language at home (86% speak English very well, 13% speak English well, 1% speak English not well).
Foreign born population: 10,374 (45.2%)
(62.9% of them are naturalized citizens)
| Here: | 7.9 |
| State: | 7.0 |
| Here: | 5.0 |
| State: | 4.3 |
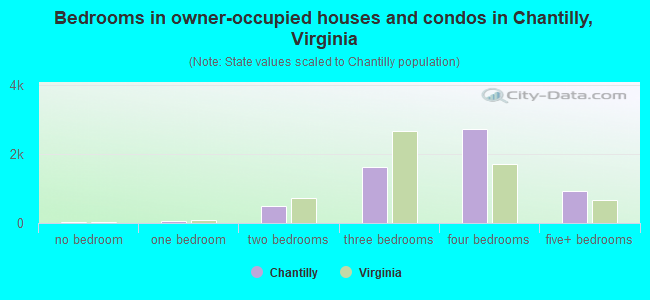
- Bedrooms in owner-occupied houses and condos in Chantilly, Virginia
- 28no bedroom
- 601 bedroom
- 4972 bedrooms
- 1,6253 bedrooms
- 2,7174 bedrooms
- 9175+ bedrooms
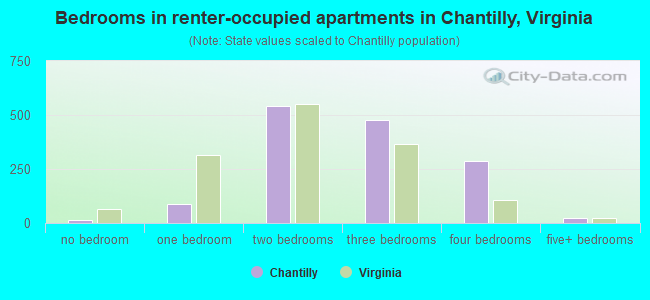
- Bedrooms in renter-occupied apartments in Chantilly, Virginia
- 16no bedroom
- 861 bedroom
- 5412 bedrooms
- 4793 bedrooms
- 2854 bedrooms
- 245+ bedrooms
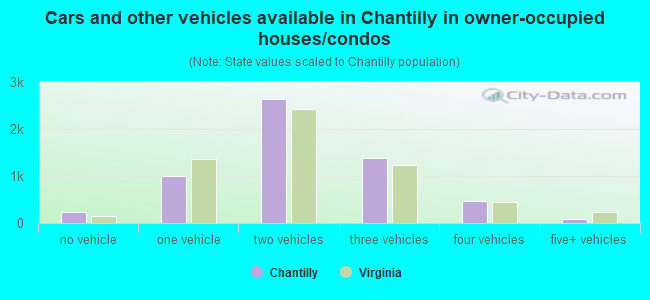
- Cars and other vehicles available in Chantilly in owner-occupied houses/condos
- 235no vehicle
- 1,0041 vehicle
- 2,6482 vehicles
- 1,3933 vehicles
- 4784 vehicles
- 865+ vehicles
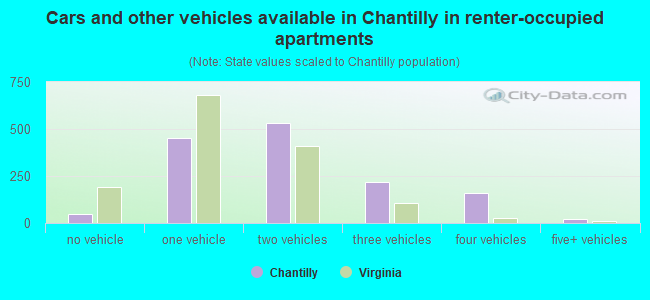
- Cars and other vehicles available in Chantilly in renter-occupied apartments
- 49no vehicle
- 4501 vehicle
- 5322 vehicles
- 2193 vehicles
- 1624 vehicles
- 195+ vehicles
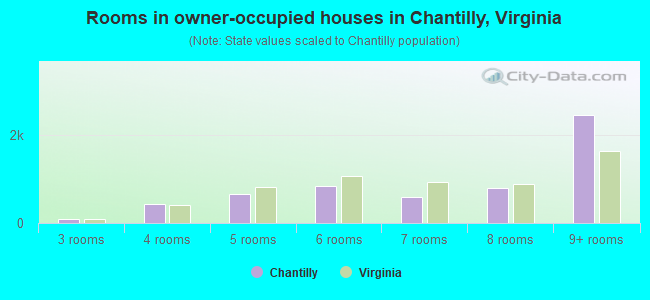
- Rooms in owner-occupied houses in Chantilly, Virginia
- 01 room
- 192 rooms
- 853 rooms
- 4274 rooms
- 6665 rooms
- 8296 rooms
- 5827 rooms
- 7948 rooms
- 2,4419+ rooms
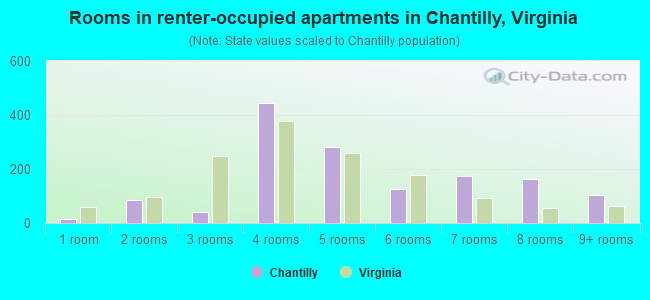
- Rooms in renter-occupied apartments in Chantilly, Virginia
- 161 room
- 862 rooms
- 393 rooms
- 4444 rooms
- 2805 rooms
- 1276 rooms
- 1747 rooms
- 1628 rooms
- 1029+ rooms
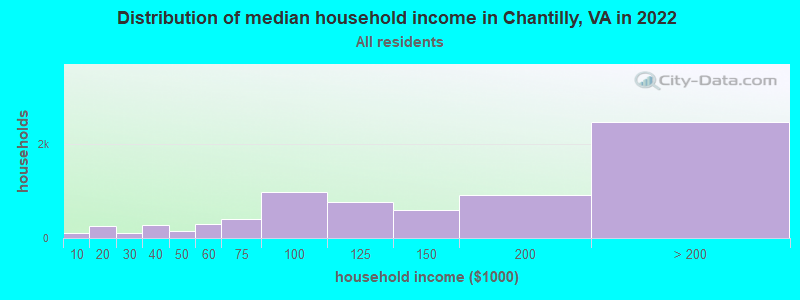
Chantilly, VA household income distribution

- 99Less than $10,000
- 246$10,000 to $19,999
- 116$20,000 to $29,999
- 281$30,000 to $39,999
- 159$40,000 to $49,999
- 293$50,000 to $59,999
- 408$60,000 to $74,999
- 981$75,000 to $99,999
- 773$100,000 to $124,999
- 588$125,000 to $149,999
- 907$150,000 to $199,999
- 2,460$200,000 or more
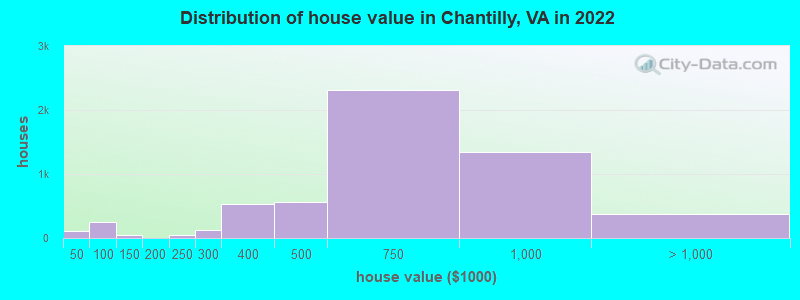
Home value of owner - occupied houses in 2022 in Chantilly, VA
-
- 45Less than $10,000
- 5$15,000 to $19,999
- 9$20,000 to $24,999
- 19$25,000 to $29,999
- 18$30,000 to $34,999
- 5$40,000 to $49,999
- 47$50,000 to $59,999
- 34$60,000 to $69,999
- 115$70,000 to $79,999
- 30$80,000 to $89,999
- 12$90,000 to $99,999
- 20$100,000 to $124,999
- 23$125,000 to $149,999
- 6$175,000 to $199,999
- 48$200,000 to $249,999
- 128$250,000 to $299,999
- 525$300,000 to $399,999
- 562$400,000 to $499,999
- 2,309$500,000 to $749,999
- 1,346$750,000 to $999,999
- 295$1,000,000 to $1,499,999
- 45$1,500,000 to $1,999,999
- 37$2,000,000 or more
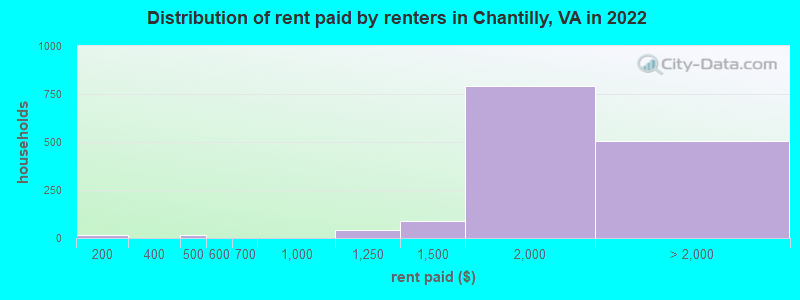
Rent paid by renters in 2022 in Chantilly, VA
-
- 14$100 to $149
- 15$400 to $449
- 1$650 to $699
- 43$1,000 to $1,249
- 91$1,250 to $1,499
- 793$1,500 to $1,999
- 208$2,000 to $2,499
- 186$2,500 to $2,999
- 32$3,000 to $3,499
- 23$3,500 or more
- 54No cash rent
Percentage of workers working in this county: 76.3%
Number of people working at home: 2,633 (20.8% of all workers)
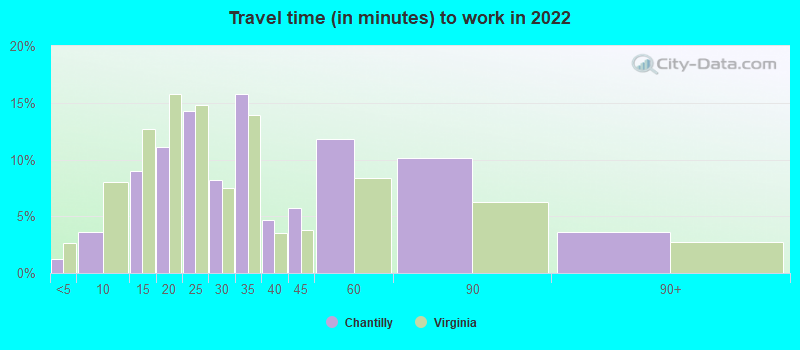
Travel time to work (commute)
- Less than 5 minutes: 183
- 5 to 9 minutes: 620
- 10 to 14 minutes: 1,518
- 15 to 19 minutes: 1,434
- 20 to 24 minutes: 1,429
- 25 to 29 minutes: 628
- 30 to 34 minutes: 1,279
- 35 to 39 minutes: 382
- 40 to 44 minutes: 530
- 45 to 59 minutes: 651
- 60 to 89 minutes: 812
- 90 or more minutes: 268
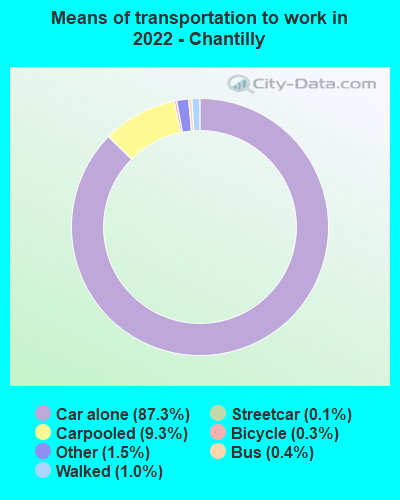
Means of transportation to work:
- Drove a car alone: 35,702 (77.1%)
- Carpooled: 3,933 (8.5%)
- Bus: 124 (0.3%)
- Subway or elevated rail: 35 (0.1%)
- Long-distance train or commuter rail: 7 (0.0%)
- Taxi: 826 (1.8%)
- Bicycle: 98 (0.2%)
- Walked: 448 (1.0%)
- Worked at home: 2,633 (5.7%)
- Unemployment by race in 2022
- Unemployment rate for White non-Hispanic residents
- 2.6%Males
- 1.0%Females
- Unemployment rate for Black residents
- 7.8%Females
- Unemployment rate for Asian residents
- 1.5%Males
- 2.3%Females
- Unemployment rate for other race residents
- 4.7%Males
- Unemployment rate for two or more race residents
- 3.9%Males
- 2.4%Females
- Unemployment rate for Hispanic or Latino residents
- 3.7%Males
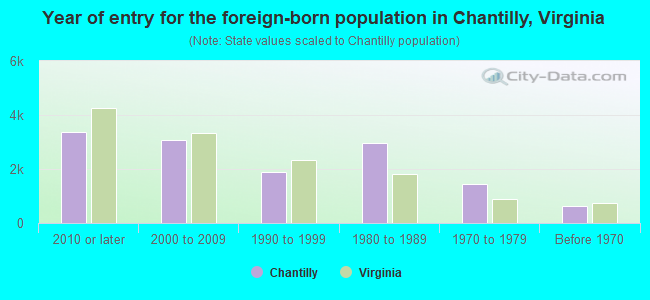
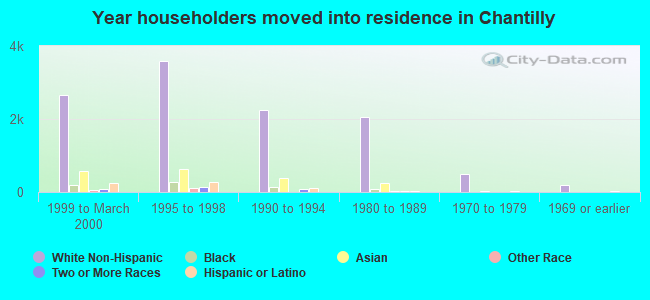
- Year of entry for the foreign-born population in Chantilly, Virginia
- 3,3542010 or later
- 3,0712000 to 2009
- 1,8861990 to 1999
- 2,9511980 to 1989
- 1,4551970 to 1979
- 641Before 1970
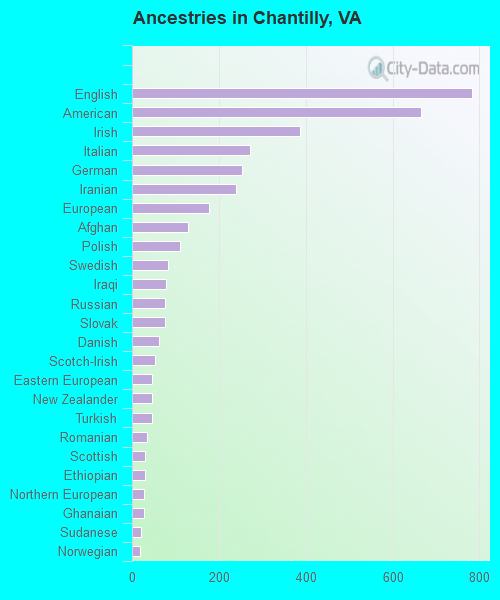
First ancestries reported:
- English: 783 (5.3%)
- American: 666 (4.5%)
- Irish: 388 (2.6%)
- Italian: 272 (1.8%)
- German: 253 (1.7%)
- Iranian: 240 (1.6%)
- European: 178 (1.2%)
- Afghan: 129 (0.9%)
- Polish: 110 (0.7%)
- Swedish: 82 (0.6%)
- Iraqi: 78 (0.5%)
- Russian: 76 (0.5%)
- Slovak: 75 (0.5%)
- Danish: 62 (0.4%)
- Scotch-Irish: 54 (0.4%)
- Eastern European: 45 (0.3%)
- New Zealander: 45 (0.3%)
- Turkish: 45 (0.3%)
- Romanian: 35 (0.2%)
- Scottish: 30 (0.2%)
- Ethiopian: 30 (0.2%)
- Northern European: 27 (0.2%)
- Ghanaian: 27 (0.2%)
- Sudanese: 21 (0.1%)
- Norwegian: 19 (0.1%)
- Cajun: 18 (0.1%)
- Canadian: 17 (0.1%)
- Czech: 17 (0.1%)
- Nigerian: 15 (0.1%)
- Egyptian: 11 (0.07%)
- Greek: 11 (0.07%)
- African: 10 (0.07%)
- Israeli: 9 (0.06%)
- Moroccan: 8 (0.05%)
- Bulgarian: 7 (0.05%)
- Dutch: 7 (0.05%)
- French: 7 (0.05%)
- Lebanese: 6 (0.04%)
Most common places of birth for foreign-born residents (%):
| Chantilly: | 15.7% (1,625) |
| Virginia: | 9.0% (97,830) |
| Chantilly: | 10.0% (1,041) |
| Virginia: | 4.9% (52,857) |
| Chantilly: | 9.7% (1,008) |
| Virginia: | 4.2% (45,750) |
| Chantilly: | 7.0% (727) |
| Virginia: | 0.9% (9,695) |
| Chantilly: | 6.0% (621) |
| Virginia: | 2.3% (24,582) |
| Chantilly: | 5.6% (580) |
| Virginia: | 1.1% (12,049) |
| Chantilly: | 4.7% (485) |
| Virginia: | 3.3% (35,938) |
| Chantilly: | 4.3% (444) |
| Virginia: | 9.9% (107,534) |
| Chantilly: | 4.2% (433) |
| Virginia: | 2.4% (26,366) |
| Chantilly: | 3.9% (405) |
| Virginia: | 3.9% (42,989) |
| Chantilly: | 2.9% (302) |
| Virginia: | 2.4% (25,722) |
| Chantilly: | 2.6% (265) |
| Virginia: | 1.3% (14,417) |
| Chantilly: | 2.5% (256) |
| Virginia: | 5.3% (57,498) |
| Chantilly: | 2.0% (206) |
| Virginia: | 4.8% (52,629) |
| Chantilly: | 1.6% (164) |
| Virginia: | 1.8% (19,426) |
| Chantilly: | 1.5% (157) |
| Virginia: | 0.4% (4,747) |
Place of birth for U.S.-born residents:
- This state: 5,937
- Other state: 6,149
- Northeast: 2,038
- Midwest: 1,081
- South: 2,272
- West: 760
90.5% of Chantilly residents lived in the same house 1 years ago.
Out of people who lived in different houses, 38.3% lived in this county.
Out of people who lived in different counties, 66.2% lived in Virginia.
| Chantilly: | 90.5% |
| State average: | 86.6% |
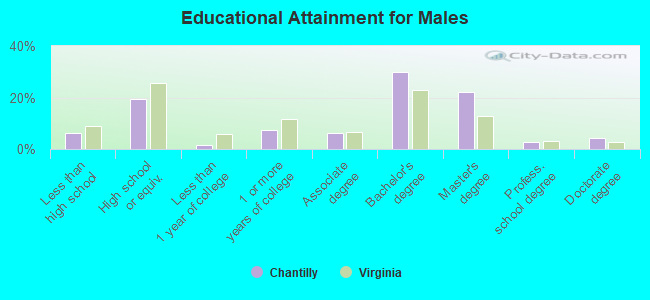
Education attainment for males 25 years and older:
- No schooling: 71
- Nursery to 4th grade: 0
- 5th and 6th grade: 130
- 7th and 8th grade: 11
- 9th grade: 30
- 10th grade: 42
- 11th grade: 52
- 12th grade, no diploma: 140
- High school graduate (or equivalency): 1,488
- Less than 1 year of college: 124
- Some college more than 1 year, no degree: 554
- Associate degree: 478
- Bachelor's degree: 2,283
- Master's degree: 1,680
- Professional school degree: 207
- Doctorate degree: 320
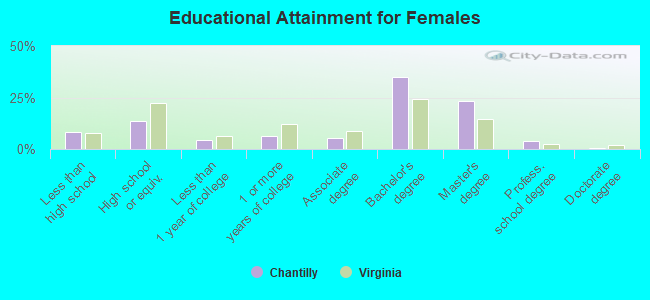
Education attainment for females 25 years and older:
- No schooling: 181
- Nursery to 4th grade: 26
- 5th and 6th grade: 92
- 7th and 8th grade: 59
- 9th grade: 21
- 10th grade: 45
- 11th grade: 22
- 12th grade, no diploma: 172
- High school graduate (or equivalency): 1,038
- Less than 1 year of college: 334
- Some college more than 1 year, no degree: 504
- Associate degree: 430
- Bachelor's degree: 2,684
- Master's degree: 1,788
- Professional school degree: 297
- Doctorate degree: 22


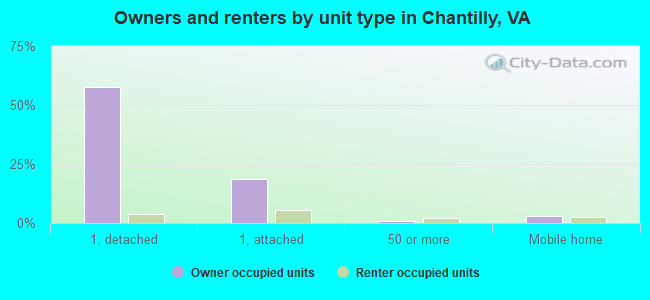
Housing units in structures:
- One, detached: 4,509
- One, attached: 1,718
- Two: 58
- 3 or 4: 14
- 5 to 9: 114
- 10 to 19: 293
- 20 to 49: 12
- 50 or more: 257
- Mobile homes: 331
Median worth of mobile homes: $110,195
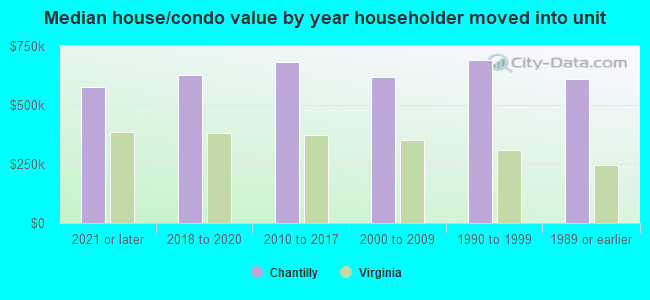
House/condo owner moved in on average 13 years ago
Renter moved in on average 6 years ago
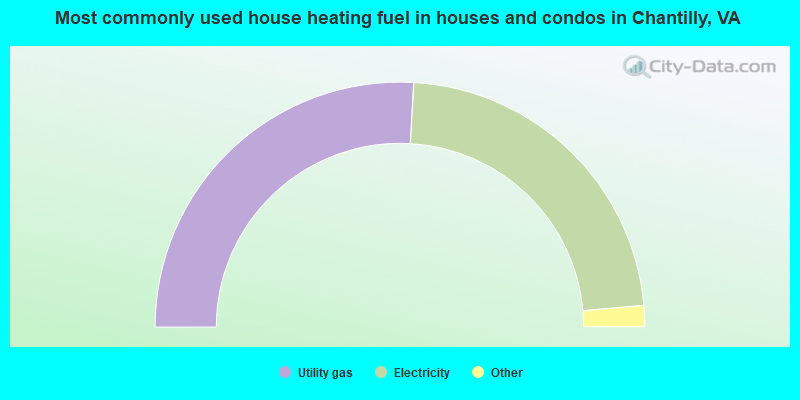
- 51.8%Utility gas
- 45.4%Electricity
- 2.1%Bottled, tank, or LP gas
- 0.8%Fuel oil, kerosene, etc.
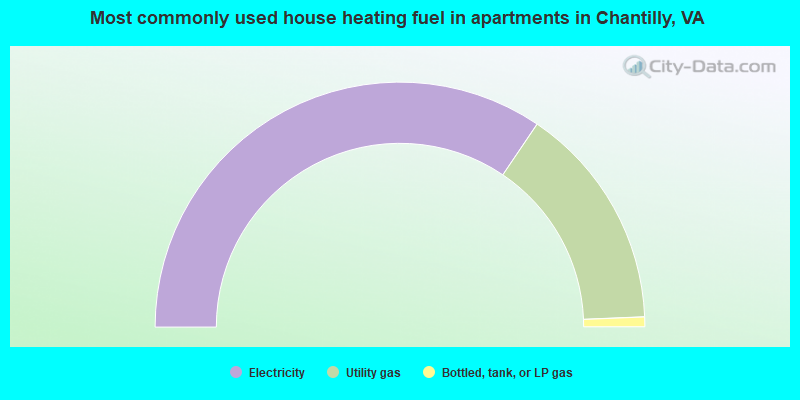
- 69.0%Electricity
- 29.8%Utility gas
- 1.3%Bottled, tank, or LP gas
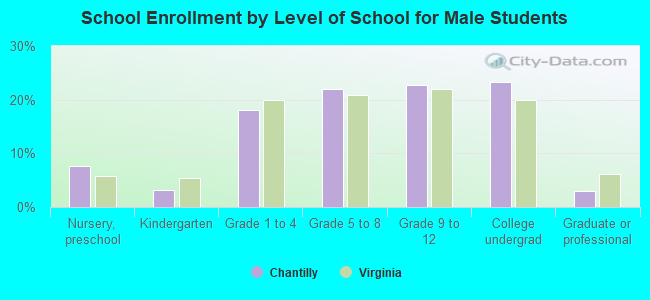
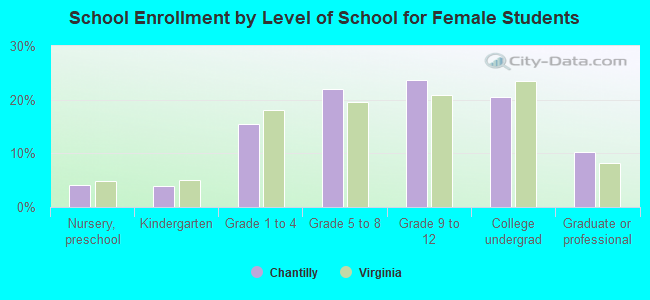
Private vs. public school enrollment:
| Here: | 11.4% |
| Virginia: | 13.2% |
| Here: | 5.2% |
| Virginia: | 10.2% |
| Here: | 13.9% |
| Virginia: | 18.7% |