Centerville, OH (Ohio) Houses and Residents
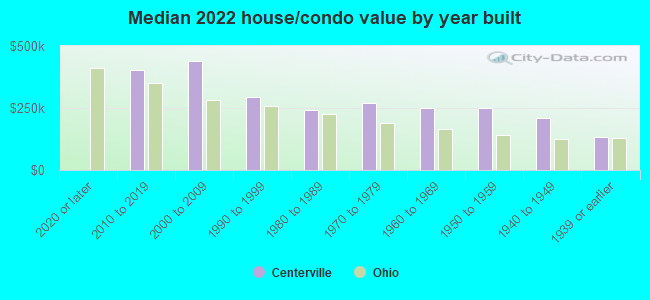
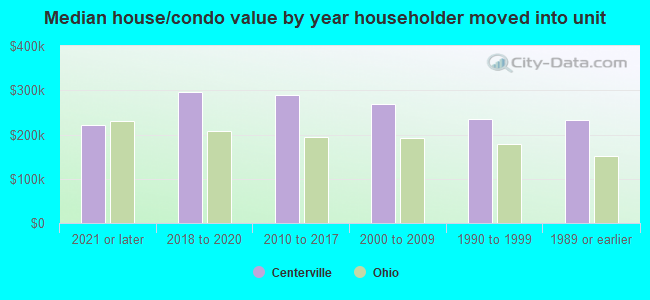
| Centerville: | $274,015 |
| Ohio: | $204,100 |
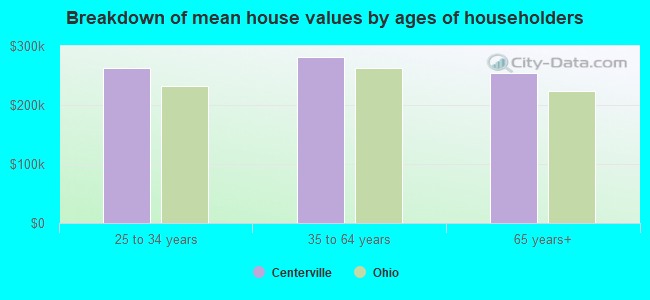
Mean price in 2022:
Detached houses: $311,591
Here: $311,591 State: $254,366 Townhouses or other attached units: $203,444
Here: $203,444 State: $225,733 In 3-to-4-unit structures: $186,000
Here: $186,000 State: $203,002 In 5-or-more-unit structures: $372,410
Here: $372,410 State: $211,593
Total population: 23,915 (Urban population: 22,828, Rural population: 365 (all nonfarm))
Houses: 12,035 (11,521 occupied: 8,243 owner occupied, 3,622 renter occupied)
| % of renters here: | 31% |
| State: | 33% |
Housing density: 1,180 houses/condos per square mile
Median price asked for vacant for-sale houses and condos in 2022: $76,879.
Median contract rent in 2022: $923 (lower quartile is $706, upper quartile is $1,207)
Median rent asked for vacant for-rent units in 2022: $2,600
Median gross rent in Centerville, OH in 2022: $1,095
Housing units in Centerville with a mortgage: 4,876 (446 second mortgage, 26 home equity loan, 410 both second mortgage and home equity loan)
Houses without a mortgage: 450
Median household income for houses/condos with a mortgage: $118,600
Median household income for apartments without a mortgage: $77,714
Median monthly housing costs: $1,165
Compare current foreclosures near Centerville, OH:
| Photo | Address | Area | Beds / Baths | Price | Details |
|---|---|---|---|---|---|

|
#1
813 Ferndale Ave
Dayton, OH 45406
|
- sq. feet
|
2 baths 6 beds |
$103,950
|
show details |

|
#2
Sparks St
Dayton, OH 45426
|
1,100 sq. feet
|
1 baths 3 beds |
$159,900
|
show details |

|
#3
Alexandersville Bell
Dayton, OH 45449
|
1,669 sq. feet
|
2 baths 3 beds |
$125,000
|
show details |

|
#4
Arlene Ave
Dayton, OH 45406
|
1,044 sq. feet
|
1 baths 3 beds |
$42,500
|
show details |

|
#5
Old Salem Rd
Englewood, OH 45322
|
2,458 sq. feet
|
2 baths 4 beds |
$334,900
|
show details |

|
#6
Lewis St
Middletown, OH 45044
|
960 sq. feet
|
1 baths 3 beds |
$189,900
|
show details |

|
#7
Clayton Ave
Middletown, OH 45042
|
- sq. feet
|
1 baths 2 beds |
$65,100
|
show details |

|
#8
Carolyn Dr
Miamisburg, OH 45342
|
1,053 sq. feet
|
1 baths 3 beds |
show details | |

|
#9
E Lindsey Ave
Miamisburg, OH 45342
|
1,161 sq. feet
|
1 baths 3 beds |
show details | |

|
#10
Noranda Dr
Dayton, OH 45415
|
1,857 sq. feet
|
3 baths 5 beds |
show details |
| Photo | Address | Area | Beds / Baths | Price | Details |
|---|---|---|---|---|---|

|
#11
Margaret Dr
Fairborn, OH 45324
|
880 sq. feet
|
1 baths 3 beds |
show details | |

|
#12
Edward Dr
Dayton, OH 45420
|
838 sq. feet
|
1 baths 2 beds |
show details | |

|
#13
Atwood Pl
Dayton, OH 45431
|
1,265 sq. feet
|
1 baths 3 beds |
show details | |

|
#14
Mckay Rd
Dayton, OH 45432
|
2,018 sq. feet
|
1 baths 3 beds |
show details | |

|
#15
Sherman Ave
Middletown, OH 45044
|
924 sq. feet
|
1 baths 2 beds |
show details | |

|
#16
Ridgepath Dr
Dayton, OH 45424
|
1,868 sq. feet
|
2 baths 4 beds |
show details | |

|
#17
Robinson Vail Rd
Franklin, OH 45005
|
1,032 sq. feet
|
2 baths 3 beds |
show details | |

|
#18
Superior Ave
Fairborn, OH 45324
|
941 sq. feet
|
1 baths 3 beds |
show details | |

|
#19
Evansville Ave
Dayton, OH 45406
|
1,856 sq. feet
|
2 baths 3 beds |
show details | |

|
#20
Harshmanville Rd
Dayton, OH 45424
|
1,404 sq. feet
|
2 baths 4 beds |
show details |
| Photo | Address | Area | Beds / Baths | Price | Details |
|---|---|---|---|---|---|

|
#21
E Dixon Ave
Dayton, OH 45419
|
1,532 sq. feet
|
2 baths 3 beds |
show details | |

|
#22
Sesame St
Dayton, OH 45424
|
1,323 sq. feet
|
1 baths 3 beds |
show details | |

|
#23
Patterson Rd
Dayton, OH 45420
|
1,019 sq. feet
|
1 baths 2 beds |
show details | |

|
#24
Robinhood Dr
Miamisburg, OH 45342
|
1,674 sq. feet
|
3 baths 4 beds |
show details | |

|
#25
W 2nd St
Dayton, OH 45402
|
1,784 sq. feet
|
1 baths 3 beds |
show details | |

|
#26
Friar Tuck Ct
Miamisburg, OH 45342
|
1,876 sq. feet
|
2 baths 3 beds |
show details | |

|
#27
E 2nd St
Dayton, OH 45403
|
1,646 sq. feet
|
1 baths 3 beds |
show details | |

|
#28
Maple Hill Dr
Dayton, OH 45449
|
780 sq. feet
|
2 baths 4 beds |
show details | |

|
#29
Janet Ave
Franklin, OH 45005
|
1,215 sq. feet
|
2 baths 3 beds |
show details | |

|
#30
N Gebhart Church Rd
Miamisburg, OH 45342
|
1,404 sq. feet
|
2 baths 4 beds |
show details |
| Photo | Address | Area | Beds / Baths | Price | Details |
|---|---|---|---|---|---|

|
#31
Knollwood Dr
Dayton, OH 45432
|
1,360 sq. feet
|
2 baths 3 beds |
show details | |

|
#32
E 3rd St
Xenia, OH 45385
|
798 sq. feet
|
1 baths 2 beds |
show details | |

|
#33
E Market St
Xenia, OH 45385
|
1,848 sq. feet
|
4 baths 4 beds |
show details | |

|
#34
Spring Meadow Dr
Lebanon, OH 45036
|
2,974 sq. feet
|
3 baths 4 beds |
show details | |

|
#35
E Cottage Ave
Dayton, OH 45449
|
1,808 sq. feet
|
2 baths 3 beds |
show details | |

|
#36
E Dixon Ave
Dayton, OH 45419
|
1,532 sq. feet
|
2 baths 3 beds |
show details | |

|
#37
N Heincke Rd
Miamisburg, OH 45342
|
1,080 sq. feet
|
1 baths 3 beds |
show details | |

|
#38
E Nottingham Rd
Dayton, OH 45405
|
1,225 sq. feet
|
1 baths 3 beds |
show details | |

|
#39
Ross Ave
Dayton, OH 45414
|
1,222 sq. feet
|
1 baths 3 beds |
show details | |

|
#40
N Gettysburg Ave
Dayton, OH 45406
|
780 sq. feet
|
1 baths 2 beds |
show details |
| Photo | Address | Area | Beds / Baths | Price | Details |
|---|---|---|---|---|---|

|
#41
S Heincke Rd
Miamisburg, OH 45342
|
1,107 sq. feet
|
2 baths 3 beds |
show details | |

|
#42
Dorset Dr
Dayton, OH 45405
|
3,581 sq. feet
|
4 baths 4 beds |
show details | |

|
#43
Nordale Ave
Dayton, OH 45420
|
1,324 sq. feet
|
1 baths 3 beds |
show details | |

|
#44
Springmont Ave
Dayton, OH 45420
|
1,188 sq. feet
|
2 baths 3 beds |
show details | |

|
#45
S Monmouth St
Dayton, OH 45403
|
1,132 sq. feet
|
1 baths 2 beds |
show details | |

|
#46
Pandora Dr
Dayton, OH 45431
|
1,519 sq. feet
|
2 baths 3 beds |
show details | |

|
#47
Archwood Dr
Dayton, OH 45406
|
1,157 sq. feet
|
1 baths 3 beds |
show details | |

|
#48
Watervliet Ave
Dayton, OH 45420
|
1,044 sq. feet
|
1 baths 3 beds |
show details | |

|
#49
Darnell Dr
Dayton, OH 45431
|
1,325 sq. feet
|
1 baths 3 beds |
show details | |

|
Check over 1 million property listings on Foreclosure.com!
|
browse all offers | |||

Latest news about housing in Centerville, OH collected exclusively by city-data.com from local newspapers, TV, and radio stations


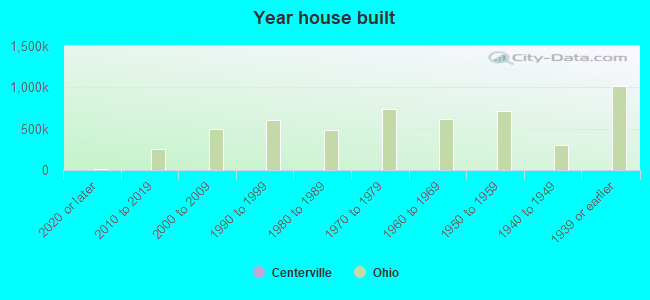
Median year apartment built: 1982
Household type by relationship:
Households: 24,408- Male householders: 5,559 (1,396 living alone), Female householders: 5,881 (2,708 living alone)
5,352 spouses (5,342 opposite-sex spouses), 590 unmarried partners, (558 opposite-sex unmarried partners), 5,528 children (5,214 natural, 84 adopted, 230 stepchildren), 172 grandchildren, 104 brothers or sisters, 206 parents, 0 foster children, 59 other relatives, 243 non-relatives
- In group quarters: 708
Size of family households: 4,031 2-persons, 1,286 3-persons, 977 4-persons, 363 5-persons, 122 6-persons, 13 7-or-more-persons.
Size of nonfamily households: 4,301 1-person, 757 2-persons.
3,530 married couples with children.
859 single-parent households (27 men, 832 women).
90.3% of residents of Centerville speak English at home.
2.6% of residents speak Spanish at home (49% speak English very well, 51% speak English well).
4.0% of residents speak other Indo-European language at home (92% speak English very well, 7% speak English well, 1% don't speak English at all).
2.0% of residents speak Asian or Pacific Island language at home (75% speak English very well, 20% speak English well, 6% speak English not well).
1.8% of residents speak other language at home (52% speak English very well, 24% speak English well, 9% speak English not well, 15% don't speak English at all).
Foreign born population: 1,998 (8.2%)
(74.6% of them are naturalized citizens)
| Here: | 7.1 |
| State: | 6.7 |
| Here: | 4.4 |
| State: | 4.4 |
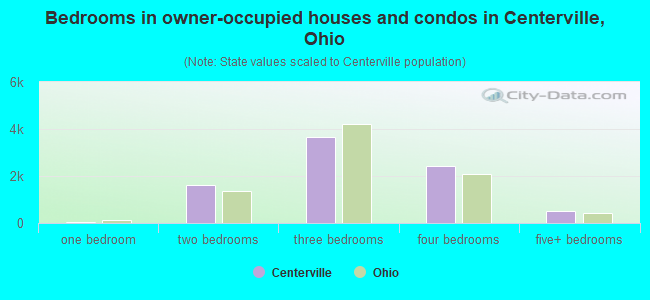
- Bedrooms in owner-occupied houses and condos in Centerville, Ohio
- 0no bedroom
- 391 bedroom
- 1,6082 bedrooms
- 3,6513 bedrooms
- 2,4454 bedrooms
- 5015+ bedrooms
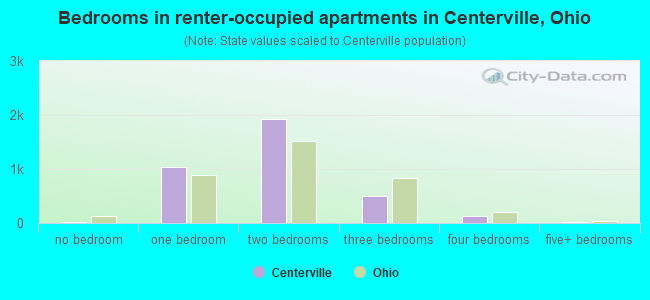
- Bedrooms in renter-occupied apartments in Centerville, Ohio
- 21no bedroom
- 1,0311 bedroom
- 1,9282 bedrooms
- 4983 bedrooms
- 1274 bedrooms
- 185+ bedrooms
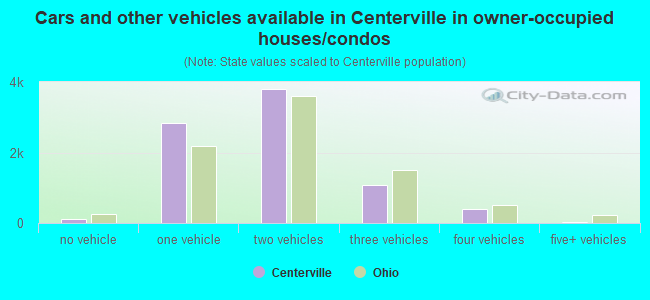
- Cars and other vehicles available in Centerville in owner-occupied houses/condos
- 101no vehicle
- 2,8311 vehicle
- 3,7922 vehicles
- 1,0853 vehicles
- 4054 vehicles
- 295+ vehicles
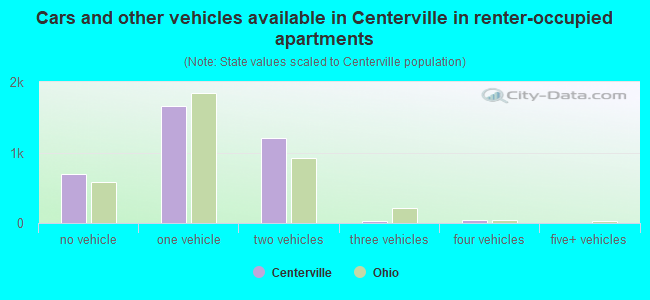
- Cars and other vehicles available in Centerville in renter-occupied apartments
- 691no vehicle
- 1,6601 vehicle
- 1,1992 vehicles
- 323 vehicles
- 404 vehicles
- 05+ vehicles
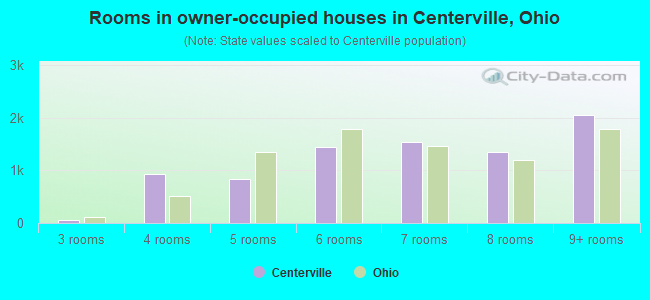
- Rooms in owner-occupied houses in Centerville, Ohio
- 01 room
- 02 rooms
- 663 rooms
- 9244 rooms
- 8465 rooms
- 1,4576 rooms
- 1,5497 rooms
- 1,3448 rooms
- 2,0579+ rooms
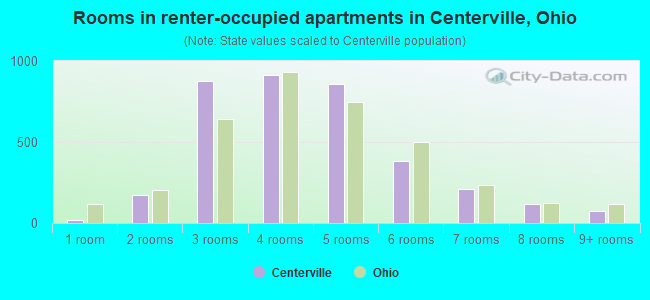
- Rooms in renter-occupied apartments in Centerville, Ohio
- 211 room
- 1702 rooms
- 8743 rooms
- 9114 rooms
- 8615 rooms
- 3846 rooms
- 2117 rooms
- 1178 rooms
- 739+ rooms
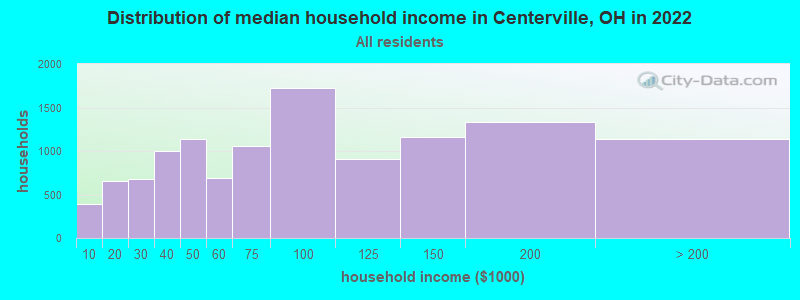
Centerville, OH household income distribution

- 394Less than $10,000
- 654$10,000 to $19,999
- 673$20,000 to $29,999
- 998$30,000 to $39,999
- 1,142$40,000 to $49,999
- 684$50,000 to $59,999
- 1,054$60,000 to $74,999
- 1,719$75,000 to $99,999
- 906$100,000 to $124,999
- 1,163$125,000 to $149,999
- 1,335$150,000 to $199,999
- 1,134$200,000 or more
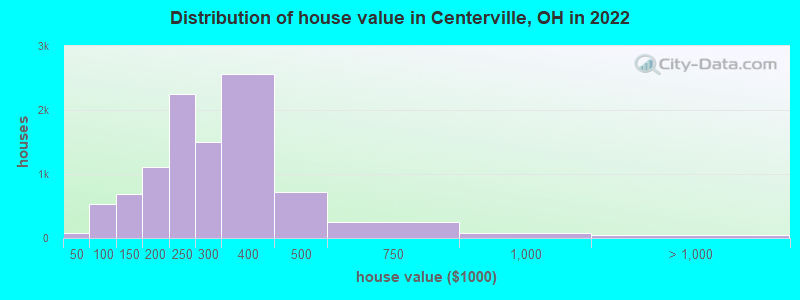
Home value of owner - occupied houses in 2022 in Centerville, OH
-
- 28Less than $10,000
- 20$10,000 to $14,999
- 9$15,000 to $19,999
- 10$35,000 to $39,999
- 3$40,000 to $49,999
- 185$60,000 to $69,999
- 192$70,000 to $79,999
- 84$80,000 to $89,999
- 62$90,000 to $99,999
- 495$100,000 to $124,999
- 199$125,000 to $149,999
- 396$150,000 to $174,999
- 718$175,000 to $199,999
- 2,253$200,000 to $249,999
- 1,498$250,000 to $299,999
- 2,563$300,000 to $399,999
- 713$400,000 to $499,999
- 252$500,000 to $749,999
- 85$750,000 to $999,999
- 11$1,000,000 to $1,499,999
- 38$1,500,000 to $1,999,999
- 1$2,000,000 or more
Rent paid by renters in 2022 in Centerville, OH
-
- 25$100 to $149
- 10$150 to $199
- 98$200 to $249
- 7$350 to $399
- 26$400 to $449
- 83$450 to $499
- 130$500 to $549
- 42$550 to $599
- 81$600 to $649
- 232$650 to $699
- 93$700 to $749
- 276$750 to $799
- 478$800 to $899
- 371$900 to $999
- 803$1,000 to $1,249
- 277$1,250 to $1,499
- 328$1,500 to $1,999
- 114$2,000 to $2,499
- 25$2,500 to $2,999
- 47$3,000 to $3,499
- 189No cash rent

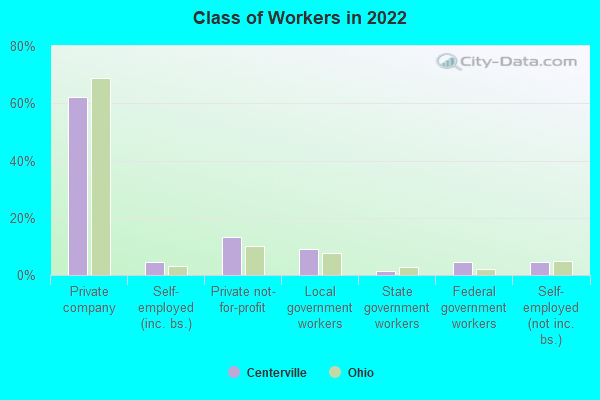
Percentage of workers working in this county: 73.1%
Number of people working at home: 2,663 (21.6% of all workers)
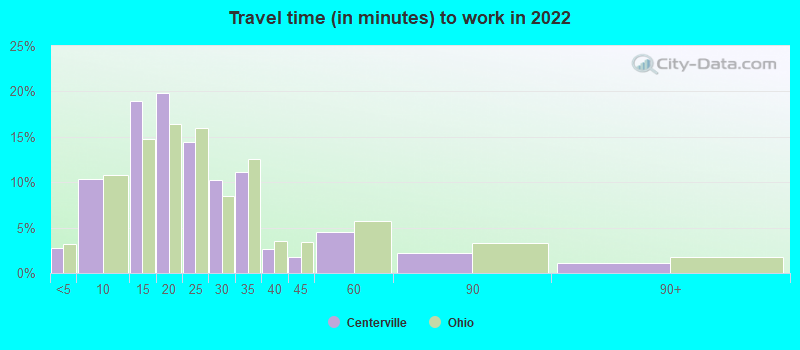
Travel time to work (commute)
- Less than 5 minutes: 156
- 5 to 9 minutes: 1,071
- 10 to 14 minutes: 1,459
- 15 to 19 minutes: 1,880
- 20 to 24 minutes: 2,131
- 25 to 29 minutes: 1,050
- 30 to 34 minutes: 1,547
- 35 to 39 minutes: 183
- 40 to 44 minutes: 169
- 45 to 59 minutes: 286
- 60 to 89 minutes: 37
- 90 or more minutes: 128
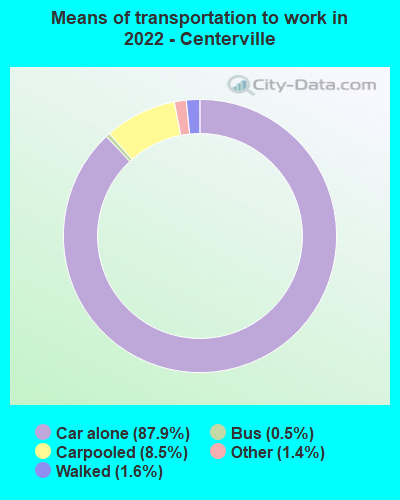
Means of transportation to work:
- Drove a car alone: 10,020 (73.2%)
- Carpooled: 1,010 (7.4%)
- Bus: 34 (0.2%)
- Taxi: 254 (1.9%)
- Bicycle: 6 (0.0%)
- Walked: 163 (1.2%)
- Worked at home: 2,663 (19.5%)
- Unemployment by race in 2022
- Unemployment rate for White non-Hispanic residents
- 3.0%Males
- 0.8%Females
- Unemployment rate for Black residents
- 21.7%Males
- 1.9%Females
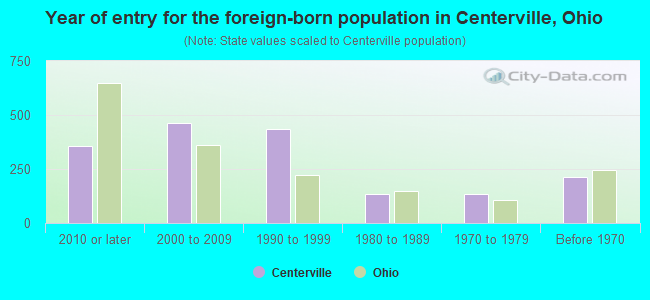
- Year of entry for the foreign-born population in Centerville, Ohio
- 3562010 or later
- 4632000 to 2009
- 4371990 to 1999
- 1331980 to 1989
- 1331970 to 1979
- 211Before 1970
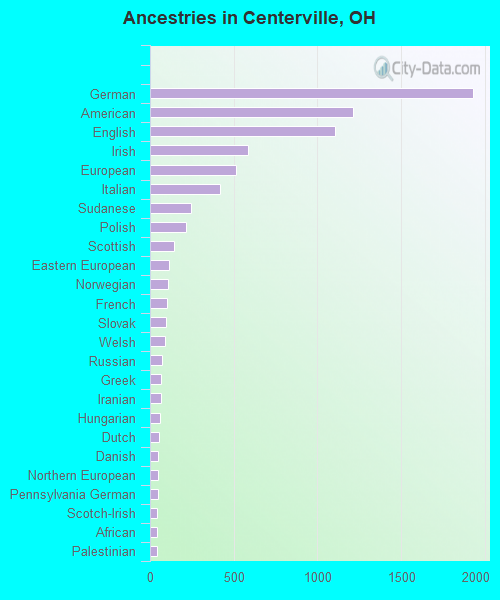
First ancestries reported:
- German: 1,929 (18.9%)
- American: 1,213 (11.9%)
- English: 1,106 (10.8%)
- Irish: 585 (5.7%)
- European: 511 (5.0%)
- Italian: 421 (4.1%)
- Sudanese: 243 (2.4%)
- Polish: 214 (2.1%)
- Scottish: 143 (1.4%)
- Eastern European: 113 (1.1%)
- Norwegian: 110 (1.1%)
- French: 99 (1.0%)
- Slovak: 95 (0.9%)
- Welsh: 90 (0.9%)
- Russian: 70 (0.7%)
- Greek: 65 (0.6%)
- Iranian: 63 (0.6%)
- Hungarian: 61 (0.6%)
- Dutch: 54 (0.5%)
- Danish: 50 (0.5%)
- Northern European: 46 (0.4%)
- Pennsylvania German: 45 (0.4%)
- Scotch-Irish: 44 (0.4%)
- African: 44 (0.4%)
- Palestinian: 42 (0.4%)
- Iraqi: 41 (0.4%)
- British: 40 (0.4%)
- French Canadian: 39 (0.4%)
- Bulgarian: 34 (0.3%)
- Ukrainian: 29 (0.3%)
- Swedish: 26 (0.3%)
- Lebanese: 24 (0.2%)
- Scandinavian: 24 (0.2%)
- Lithuanian: 18 (0.2%)
- Czechoslovakian: 16 (0.2%)
- Belgian: 15 (0.1%)
- Czech: 13 (0.1%)
- Romanian: 9 (0.09%)
- Austrian: 8 (0.08%)
- Slovene: 8 (0.08%)
Most common places of birth for foreign-born residents (%):
| Centerville: | 21.3% (447) |
| Ohio: | 11.6% (66,525) |
| Centerville: | 10.6% (222) |
| Ohio: | 0.5% (3,042) |
| Centerville: | 8.1% (171) |
| Ohio: | 2.2% (12,846) |
| Centerville: | 7.6% (160) |
| Ohio: | 2.6% (14,988) |
| Centerville: | 5.1% (107) |
| Ohio: | 0.8% (4,651) |
| Centerville: | 4.8% (101) |
| Ohio: | 0.3% (1,707) |
| Centerville: | 4.0% (84) |
| Ohio: | 1.6% (9,312) |
| Centerville: | 3.5% (73) |
| Ohio: | 0.2% (1,210) |
| Centerville: | 3.2% (68) |
| Ohio: | 1.9% (10,960) |
| Centerville: | 2.9% (60) |
| Ohio: | 0.7% (3,722) |
| Centerville: | 2.7% (56) |
| Ohio: | 0.6% (3,552) |
| Centerville: | 2.6% (55) |
| Ohio: | 6.2% (35,703) |
| Centerville: | 2.5% (52) |
| Ohio: | 1.0% (5,444) |
| Centerville: | 2.2% (46) |
| Ohio: | 0.0% (131) |
| Centerville: | 1.8% (37) |
| Ohio: | 1.7% (9,564) |
| Centerville: | 1.7% (35) |
| Ohio: | 1.5% (8,452) |
| Centerville: | 1.5% (32) |
| Ohio: | 0.2% (1,424) |
Place of birth for U.S.-born residents:
- This state: 14,816
- Other state: 7,285
- Northeast: 1,348
- Midwest: 2,345
- South: 2,251
- West: 1,477
86.1% of Centerville residents lived in the same house 1 years ago.
Out of people who lived in different houses, 29.6% lived in this county.
Out of people who lived in different counties, 43.9% lived in Ohio.
| Centerville: | 86.1% |
| State average: | 87.8% |
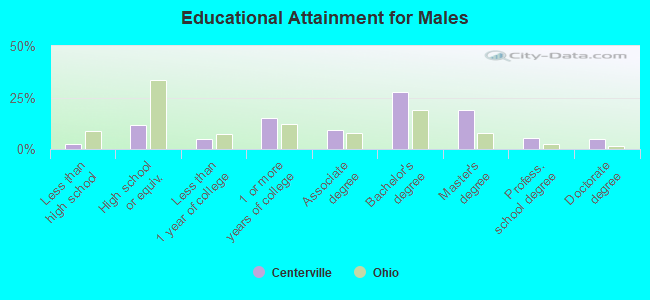
Education attainment for males 25 years and older:
- No schooling: 74
- Nursery to 4th grade: 0
- 5th and 6th grade: 0
- 7th and 8th grade: 16
- 9th grade: 31
- 10th grade: 60
- 11th grade: 15
- 12th grade, no diploma: 36
- High school graduate (or equivalency): 1,015
- Less than 1 year of college: 409
- Some college more than 1 year, no degree: 1,339
- Associate degree: 800
- Bachelor's degree: 2,422
- Master's degree: 1,678
- Professional school degree: 452
- Doctorate degree: 409
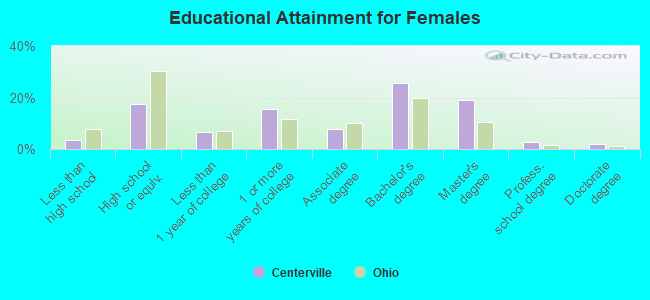
Education attainment for females 25 years and older:
- No schooling: 49
- Nursery to 4th grade: 0
- 5th and 6th grade: 31
- 7th and 8th grade: 94
- 9th grade: 3
- 10th grade: 45
- 11th grade: 54
- 12th grade, no diploma: 80
- High school graduate (or equivalency): 1,841
- Less than 1 year of college: 716
- Some college more than 1 year, no degree: 1,650
- Associate degree: 824
- Bachelor's degree: 2,716
- Master's degree: 2,014
- Professional school degree: 296
- Doctorate degree: 193


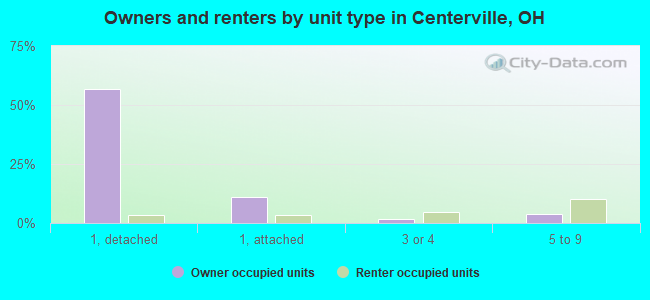
Housing units in structures:
- One, detached: 6,757
- One, attached: 1,432
- Two: 111
- 3 or 4: 819
- 5 to 9: 1,187
- 10 to 19: 890
- 20 to 49: 246
- 50 or more: 566
- Mobile homes: 24
Housing units lacking complete kitchen facilities in 2022: 0.8%
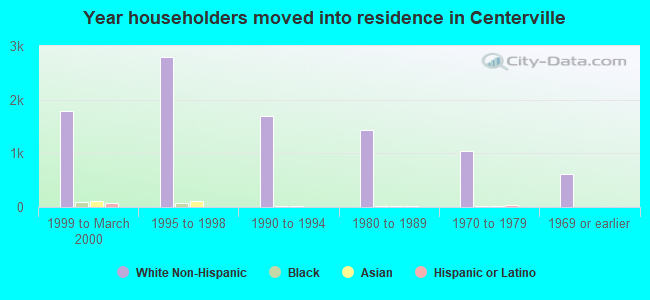
House/condo owner moved in on average 11 years ago
Renter moved in on average 1 years ago
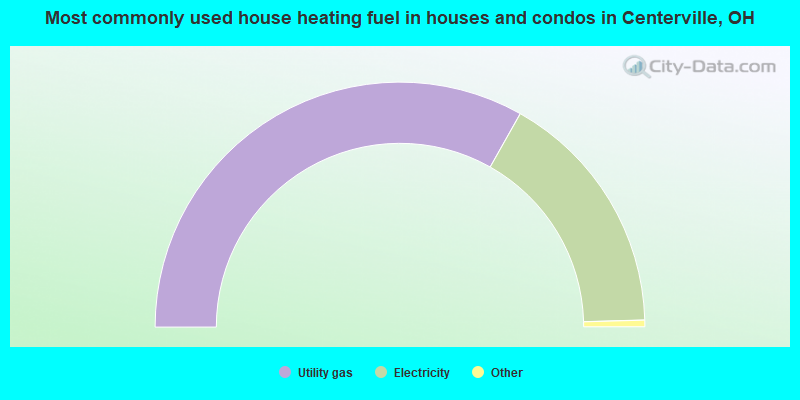
- 66.3%Utility gas
- 32.7%Electricity
- 0.7%Other fuel
- 0.3%Bottled, tank, or LP gas

- 47.2%Electricity
- 45.0%Utility gas
- 4.8%Other fuel
- 2.2%Bottled, tank, or LP gas
- 0.7%No fuel used
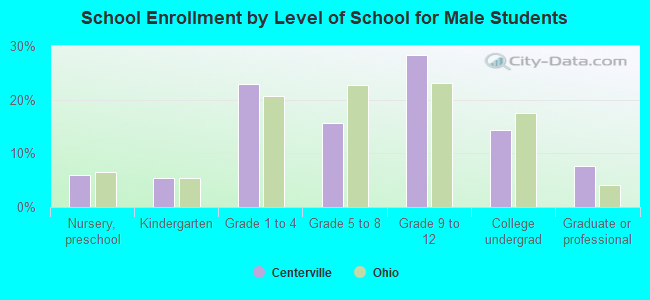
Private vs. public school enrollment:
| Here: | 5.0% |
| Ohio: | 16.0% |
| Here: | 5.5% |
| Ohio: | 13.1% |
| Here: | 10.4% |
| Ohio: | 22.3% |