Centereach, NY (New York) Houses and Residents
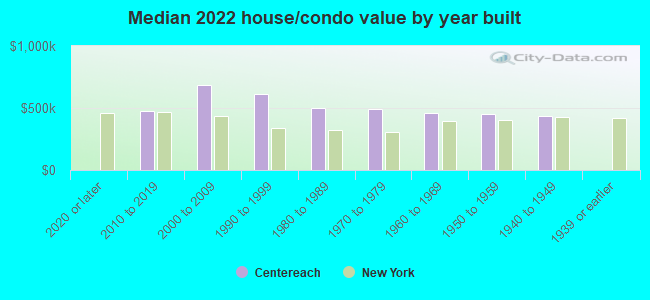
Estimated median house or condo value in 2022: $488,995 (it was $158,900 in 2000 )
Centereach:
$488,995New York:
$400,400
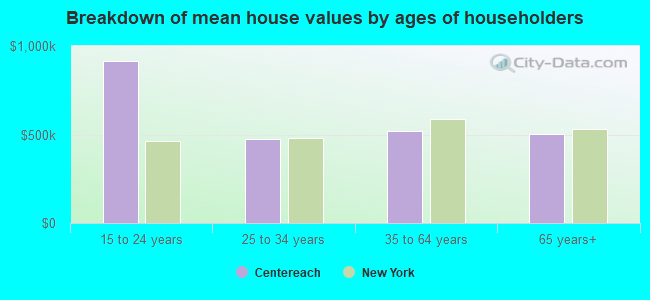
Lower value quartile - upper value quartile: $385,628 - $553,947Mean price in 2022: Detached houses: $481,195 Here:
$481,195State:
$476,719
Townhouses or other attached units: $585,661 Here:
$585,661State:
$699,270
In 2-unit structures: $611,491 Here:
$611,491State:
$713,077
In 5-or-more-unit structures: $786,496 Here:
$786,496State:
$912,009
Total population: 31,578 (Urban population: 27,177, Rural population: 0)
Houses: 10,551 (9,834 occupied: 8,091 owner occupied, 1,739 renter occupied )
% of renters here:
18%State:
46%
Housing density: 1,326 houses/condos per square mile
Median price asked for vacant for-sale houses and condos in 2022: $752,267.
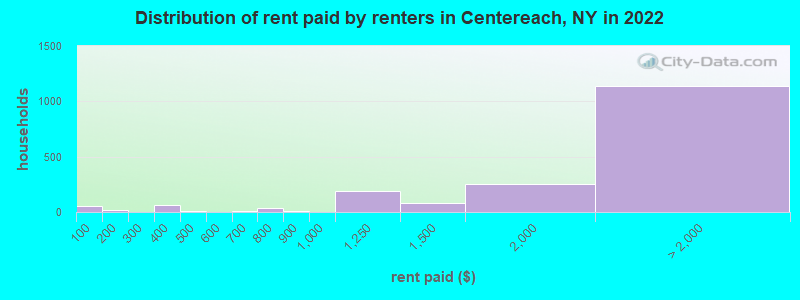
Median contract rent in 2022: over $2,000 (lower quartile is $1,442, upper quartile is over $2,000)
Median rent asked for vacant for-rent units in 2022: $3,469
Median gross rent in Centereach, NY in 2022: over $2,000
Housing units in Centereach with a mortgage: 5,234 (540 second mortgage, 71 home equity loan, 394 both second mortgage and home equity loan )Houses without a mortgage: 154
Median household income for houses/condos with a mortgage: $139,760
Median household income for apartments without a mortgage: $118,318
Median monthly housing costs: $2,274
Data:
Median house or condo value ($)
Median house or condo value ($ change since 2000)
Median house or condo value ($) - White
Median house or condo value ($) - Black or African American
Median house or condo value ($) - Asian
Median house or condo value ($) - Hispanic or Latino
Median house or condo value ($) - American Indian and Alaska Native
Median house or condo value ($) - Multirace
Median house or condo value ($) - Other Race
Median price asked for mobile homes ($)
Household density (households per square mile)
Mean house or condo value by units in structure - 1, detached ($)
Mean house or condo value by units in structure - 1, attached ($)
Mean house or condo value by units in structure - 2 ($)
Mean house or condo value by units in structure by units in structure - 3 or 4 ($)
Mean house or condo value by units in structure - 5 or more ($)
Mean house or condo value by units in structure - Boat, RV, van, etc. ($)
Mean house or condo value by units in structure - Mobile home ($)
Median contract rent ($)
Median contract rent - Lower quartile ($)
Median contract rent - Upper quartile ($)
Median gross rent ($)
Urban houses (%)
Rural houses (%)
Houses occupied (%)
Houses occupied (% change since 2000)
Houses owner occupied (%)
Houses owner occupied (% change since 2000)
Houses renter occupied (%)
Houses renter occupied (% change since 2000)
Vacant housing units - For rent (%)
Vacant housing units - For rent (% change since 2000)
Vacant housing units - For sale only (%)
Vacant housing units - For sale only (% change since 2000)
Vacant housing units - Rented or sold, not occupied (%)
Vacant housing units - Rented or sold, not occupied (% change since 2000)
Vacant housing units - For seasonal, recreational, or occasional use (%)
Vacant housing units - For seasonal, recreational, or occasional use (% change since 2000)
Vacant housing units - For migrant workers (%)
Vacant housing units - For migrant workers (% change since 2000)
Vacant housing units - Other vacant (%)
Vacant housing units - Other vacant (% change since 2000)
Median monthly housing costs ($)
Median household income for houses/condos with a mortgage ($)
Median household income for houses/condos without a mortgage ($)
Median household income ($)
Median household income ($) - White
Median household income ($) - Black or African American
Median household income ($) - Asian
Median household income ($) - Hispanic or Latino
Median household income ($) - American Indian and Alaska Native
Median household income ($) - Multirace
Median household income ($) - Other Race
Mortgage status - with mortgage (%)
Mortgage status - with second mortgage (%)
Mortgage status - with home equity loan (%)
Mortgage status - with both second mortgage and home equity loan (%)
Mortgage status - without a mortgage (%)
Median year house/condo built
Median year apartment built
Household type by relationship - Male householder living alone (%)
Household type by relationship - Male householder not living alone (%)
Household type by relationship - Female householder living alone (%)
Household type by relationship - Female householder not living alone (%)
Household type by relationship - Opposite-Sex spouse (%)
Household type by relationship - Same-Sex spouse (%)
Household type by relationship - Opposite-Sex unmarried partner (%)
Household type by relationship - Same-Sex unmarried partner (%)
Household type by relationship - In group quarters (%)
Size of family households - 2-person household (%)
Size of family households - 3-person household (%)
Size of family households - 4-person household (%)
Size of family households - 5-person household (%)
Size of family households - 6-person household (%)
Size of family households - 7-or-more-person household (%)
Size of nonfamily households - 1-person household (%)
Size of nonfamily households - 2-person household (%)
Size of nonfamily households - 3-person household (%)
Size of nonfamily households - 4-person household (%)
Size of nonfamily households - 5-person household (%)
Size of nonfamily households - 6-person household (%)
Size of nonfamily households - 7-or-moreperson household (%)
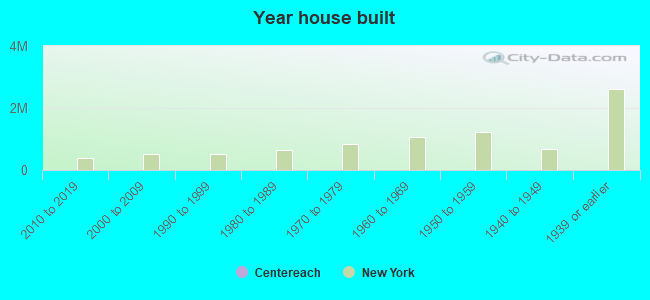
Year house built - Built 2010 or later (%)
Year house built - Built 2000 to 2009 (%)
Year house built - Built 1990 to 1999 (%)
Year house built - Built 1980 to 1989 (%)
Year house built - Built 1970 to 1979 (%)
Year house built - Built 1960 to 1969 (%)
Year house built - Built 1950 to 1959 (%)
Year house built - Built 1940 to 1949 (%)
Year house built - Built 1939 or earlier (%)
Median number of rooms in houses and condos
Median number of rooms in apartments
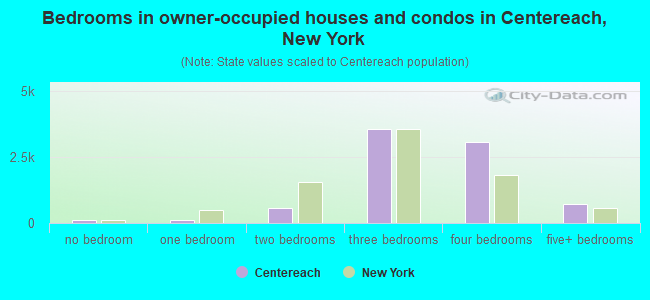
Median number of bedrooms in owner occupied houses
Mean number of bedrooms in owner occupied houses
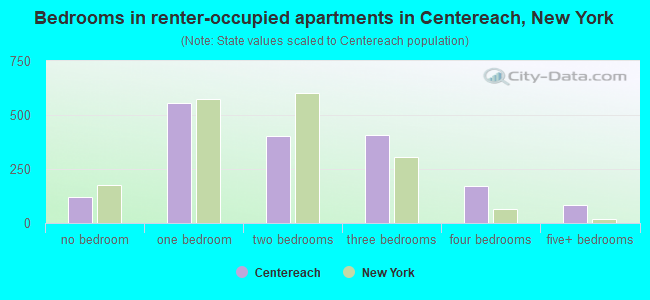
Median number of bedrooms in renter occupied houses
Mean number of bedrooms in renter occupied houses
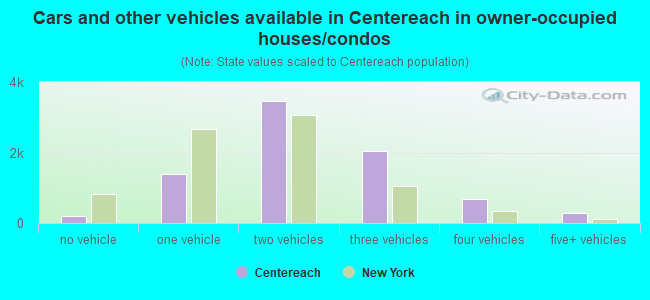
Median number of vehichles in owner occupied houses
Mean number of vehichles in owner occupied houses
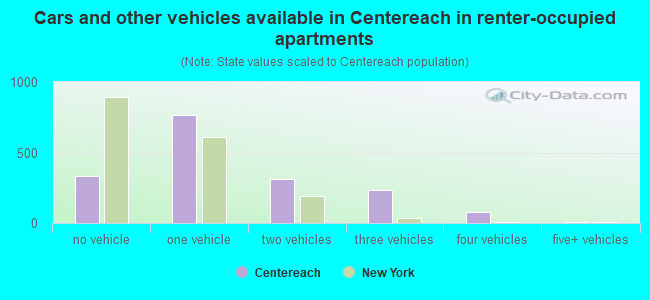
Median number of vehichles in renter occupied houses
Mean number of vehichles in renter occupied houses
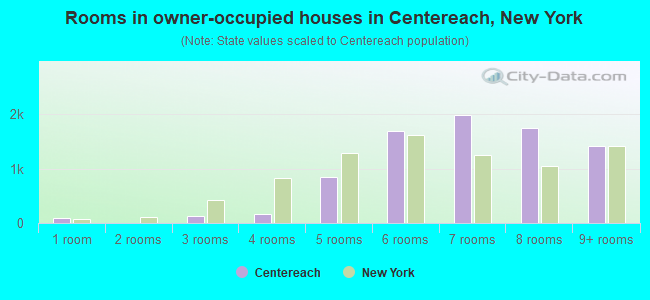
Rooms in owner-occupied houses - 1 room (%)
Rooms in owner-occupied houses - 2 rooms (%)
Rooms in owner-occupied houses - 3 rooms (%)
Rooms in owner-occupied houses - 4 rooms (%)
Rooms in owner-occupied houses - 5 rooms (%)
Rooms in owner-occupied houses - 6 rooms (%)
Rooms in owner-occupied houses - 7 rooms (%)
Rooms in owner-occupied houses - 8 rooms (%)
Rooms in owner-occupied houses - 9+ rooms (%)
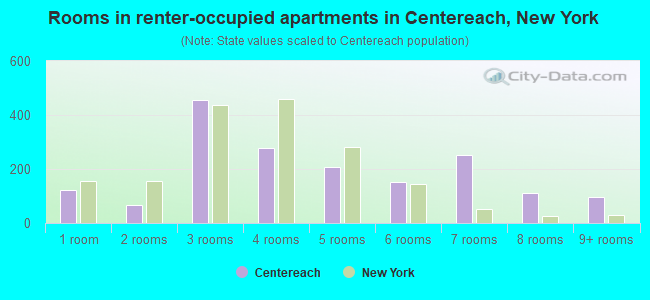
Rooms in renter-occupied houses - 1 room (%)
Rooms in renter-occupied houses - 2 rooms (%)
Rooms in renter-occupied houses - 3 rooms (%)
Rooms in renter-occupied houses - 4 rooms (%)
Rooms in renter-occupied houses - 5 rooms (%)
Rooms in renter-occupied houses - 6 rooms (%)
Rooms in renter-occupied houses - 7 rooms (%)
Rooms in renter-occupied houses - 8 rooms (%)
Rooms in renter-occupied houses - 9+ rooms (%)
Bedrooms in owner-occupied houses - no bedrooms (%)
Bedrooms in owner-occupied houses - 1 bedroom (%)
Bedrooms in owner-occupied houses - 2 bedrooms (%)
Bedrooms in owner-occupied houses - 3 bedrooms (%)
Bedrooms in owner-occupied houses - 4 bedrooms (%)
Bedrooms in owner-occupied houses - 5+ bedrooms (%)
Bedrooms in renter-occupied houses - no bedrooms (%)
Bedrooms in renter-occupied houses - 1 bedroom (%)
Bedrooms in renter-occupied houses - 2 bedrooms (%)
Bedrooms in renter-occupied houses - 3 bedrooms (%)
Bedrooms in renter-occupied houses - 4 bedrooms (%)
Bedrooms in renter-occupied houses - 5+ bedrooms (%)
Vehicles available in owner-occupied houses - no vehicle available (%)
Vehicles available in owner-occupied houses - 1 vehicle available(%)
Vehicles available in owner-occupied houses - 2 Vehicles available (%)
Vehicles available in owner-occupied houses - 3 Vehicles available (%)
Vehicles available in owner-occupied houses - 4 Vehicles available (%)
Vehicles available in owner-occupied houses - 5+ Vehicles available (%)
Vehicles available in renter-occupied houses - no vehicle available (%)
Vehicles available in renter-occupied houses - 1 vehicle available (%)
Vehicles available in renter-occupied houses - 2 Vehicles available (%)
Vehicles available in renter-occupied houses - 3 Vehicles available (%)
Vehicles available in renter-occupied houses - 4 Vehicles available (%)
Vehicles available in renter-occupied houses - 5+ Vehicles available (%)
Housing units in structures - 1, detached (%)
Housing units in structures - 1, attached (%)
Housing units in structures - 2 (%)
Housing units in structures - 3 or 4 (%)
Housing units in structures - 5 to 9 (%)
Housing units in structures - 10 to 19 (%)
Housing units in structures - 20 to 49 (%)
Housing units in structures - 50 or more (%)
Housing units in structures - Mobile home (%)
Housing units in structures - Boat, RV, van, etc. (%)
Housing units in structures - Owners - 1, detached (%)
Housing units in structures - Owners - 1, attached (%)
Housing units in structures - Owners - 2 (%)
Housing units in structures - Owners - 3 or 4 (%)
Housing units in structures - Owners - 5 to 9 (%)
Housing units in structures - Owners - 10 to 19 (%)
Housing units in structures - Owners - 20 to 49 (%)
Housing units in structures - Owners - 50 or more (%)
Housing units in structures - Owners - Mobile home (%)
Housing units in structures - Owners - Boat, RV, van, etc. (%)
Housing units in structures - Renters - 1, detached (%)
Housing units in structures - Renters - 1, attached (%)
Housing units in structures - Renters - 2 (%)
Housing units in structures - Renters - 3 or 4 (%)
Housing units in structures - Renters - 5 to 9 (%)
Housing units in structures - Renters - 10 to 19 (%)
Housing units in structures - Renters - 20 to 49 (%)
Housing units in structures - Renters - 50 or more (%)
Housing units in structures - Renters - Mobile home (%)
Housing units in structures - Renters - Boat, RV, van, etc. (%)
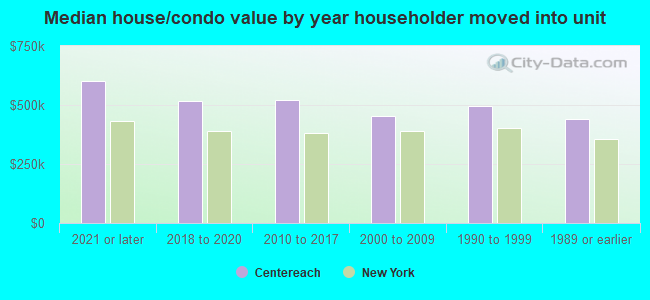
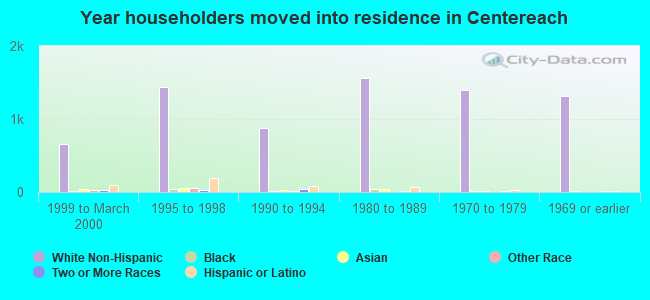
House/condo owner moved in on average (years ago)
Renter moved in on average (years ago)
Year householder moved into unit - Moved in 1999 to March 2000 (%)
Year householder moved into unit - Moved in 1999 to March 2000 (%) - White
Year householder moved into unit - Moved in 1999 to March 2000 (%) - Black or African American
Year householder moved into unit - Moved in 1999 to March 2000 (%) - Asian
Year householder moved into unit - Moved in 1999 to March 2000 (%) - Hispanic or Latino
Year householder moved into unit - Moved in 1999 to March 2000 (%) - American Indian and Alaska Native
Year householder moved into unit - Moved in 1999 to March 2000 (%) - Multirace
Year householder moved into unit - Moved in 1999 to March 2000 (%) - Other Race
Year householder moved into unit - Moved in 1995 to 1998 (%)
Year householder moved into unit - Moved in 1995 to 1998 (%) - White
Year householder moved into unit - Moved in 1995 to 1998 (%) - Black or African American
Year householder moved into unit - Moved in 1995 to 1998 (%) - Asian
Year householder moved into unit - Moved in 1995 to 1998 (%) - Hispanic or Latino
Year householder moved into unit - Moved in 1995 to 1998 (%) - American Indian and Alaska Native
Year householder moved into unit - Moved in 1995 to 1998 (%) - Multirace
Year householder moved into unit - Moved in 1995 to 1998 (%) - Other Race
Year householder moved into unit - Moved in 1990 to 1994 (%)
Year householder moved into unit - Moved in 1990 to 1994 (%) - White
Year householder moved into unit - Moved in 1990 to 1994 (%) - Black or African American
Year householder moved into unit - Moved in 1990 to 1994 (%) - Asian
Year householder moved into unit - Moved in 1990 to 1994 (%) - Hispanic or Latino
Year householder moved into unit - Moved in 1990 to 1994 (%) - American Indian and Alaska Native
Year householder moved into unit - Moved in 1990 to 1994 (%) - Multirace
Year householder moved into unit - Moved in 1990 to 1994 (%) - Other Race
Year householder moved into unit - Moved in 1980 to 1989 (%)
Year householder moved into unit - Moved in 1980 to 1989 (%) - White
Year householder moved into unit - Moved in 1980 to 1989 (%) - Black or African American
Year householder moved into unit - Moved in 1980 to 1989 (%) - Asian
Year householder moved into unit - Moved in 1980 to 1989 (%) - Hispanic or Latino
Year householder moved into unit - Moved in 1980 to 1989 (%) - American Indian and Alaska Native
Year householder moved into unit - Moved in 1980 to 1989 (%) - Multirace
Year householder moved into unit - Moved in 1980 to 1989 (%) - Other Race
Year householder moved into unit - Moved in 1970 to 1979 (%)
Year householder moved into unit - Moved in 1970 to 1979 (%) - White
Year householder moved into unit - Moved in 1970 to 1979 (%) - Black or African American
Year householder moved into unit - Moved in 1970 to 1979 (%) - Asian
Year householder moved into unit - Moved in 1970 to 1979 (%) - Hispanic or Latino
Year householder moved into unit - Moved in 1970 to 1979 (%) - American Indian and Alaska Native
Year householder moved into unit - Moved in 1970 to 1979 (%) - Multirace
Year householder moved into unit - Moved in 1970 to 1979 (%) - Other Race
Year householder moved into unit - Moved in 1969 or earlier (%)
Year householder moved into unit - Moved in 1969 or earlier (%) - White
Year householder moved into unit - Moved in 1969 or earlier (%) - Black or African American
Year householder moved into unit - Moved in 1969 or earlier (%) - Asian
Year householder moved into unit - Moved in 1969 or earlier (%) - Hispanic or Latino
Year householder moved into unit - Moved in 1969 or earlier (%) - American Indian and Alaska Native
Year householder moved into unit - Moved in 1969 or earlier (%) - Multirace
Year householder moved into unit - Moved in 1969 or earlier (%) - Other Race
Housing units lacking complete plumbing facilities (%)
Housing units lacking complete kitchen facilities (%)
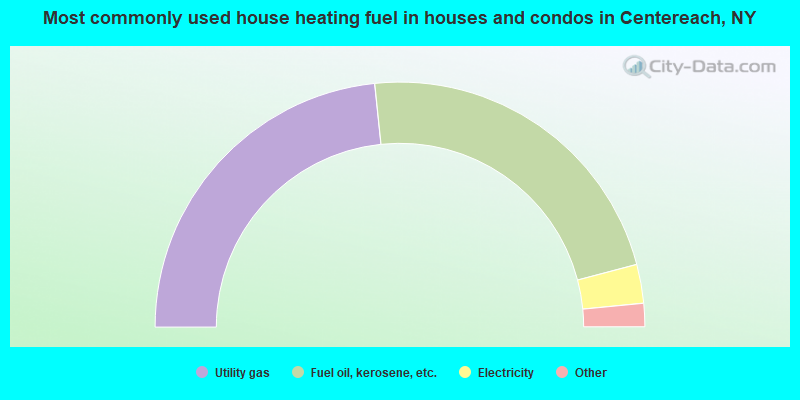
House heating fuel used in houses and condos - Utility gas (%)
House heating fuel used in houses and condos - Bottled, tank, or LP gas (%)
House heating fuel used in houses and condos - Electricity (%)
House heating fuel used in houses and condos - Fuel oil, kerosene, etc. (%)
House heating fuel used in houses and condos - Coal or coke (%)
House heating fuel used in houses and condos - Wood (%)
House heating fuel used in houses and condos - Solar energy (%)
House heating fuel used in houses and condos - Other fuel (%)
House heating fuel used in houses and condos - No fuel used (%)
House heating fuel used in apartments - Utility gas (%)
House heating fuel used in apartments - Bottled, tank, or LP gas (%)
House heating fuel used in apartments - Electricity (%)
House heating fuel used in apartments - Fuel oil, kerosene, etc. (%)
House heating fuel used in apartments - Coal or coke (%)
House heating fuel used in apartments - Wood (%)
House heating fuel used in apartments - Solar energy (%)
House heating fuel used in apartments - Other fuel (%)
House heating fuel used in apartments - No fuel used (%)
Latest news about housing in Centereach, NY collected exclusively by city-data.com from local newspapers, TV, and radio stations
Median year house/condo built: 1968Median year apartment built: 1981Household type by relationship:
Households: 31,909
Male householders: 4,883 (676 living alone ), Female householders: 4,929 (993 living alone )6,473 spouses (6,395 opposite-sex spouses ), 506 unmarried partners , (506 opposite-sex unmarried partners ), 11,607 children (10,832 natural , 242 adopted , 532 stepchildren ), 538 grandchildren , 385 brothers or sisters , 464 parents , 0 foster children , 989 other relatives , 914 non-relatives In group quarters: 218
Size of family households: 2,557 2-persons , 1,984 3-persons , 1,758 4-persons , 989 5-persons , 279 6-persons , 225 7-or-more-persons .
Size of nonfamily households: 1,683 1-person , 203 2-persons , 13 3-persons , 64 4-persons , 35 7-or-more-persons .
5,096 married couples with children. single-parent households (390 men , 887 women ).
80.1% of residents of Centereach speak English at home. of residents speak Spanish at home (60% speak English very well , 23% speak English well , 17% speak English not well ).of residents speak other Indo-European language at home (68% speak English very well , 24% speak English well , 6% speak English not well , 2% don't speak English at all ).of residents speak Asian or Pacific Island language at home (62% speak English very well , 22% speak English well , 14% speak English not well , 2% don't speak English at all ).of residents speak other language at home (86% speak English very well , 10% speak English well , 4% speak English not well ).
Foreign born population: 5,089 (15.9%)of them are naturalized citizens )
Median number of rooms in houses and condos:
Median number of rooms in apartments
Centereach, NY household income distribution 225 Less than $10,000179 $10,000 to $19,999309 $20,000 to $29,999414 $30,000 to $39,999284 $40,000 to $49,999488 $50,000 to $59,999792 $60,000 to $74,9991,184 $75,000 to $99,9991,196 $100,000 to $124,9991,167 $125,000 to $149,9991,364 $150,000 to $199,9992,193 $200,000 or more
Home value of owner - occupied houses in 2022 in Centereach, NY 15 Less than $10,00025 $30,000 to $34,99930 $35,000 to $39,99922 $40,000 to $49,99927 $100,000 to $124,99936 $125,000 to $149,9999 $150,000 to $174,99924 $175,000 to $199,999148 $200,000 to $249,999312 $250,000 to $299,9991,448 $300,000 to $399,9992,632 $400,000 to $499,9992,377 $500,000 to $749,999209 $750,000 to $999,99933 $1,000,000 to $1,499,99917 $1,500,000 to $1,999,99914 $2,000,000 or moreRent paid by renters in 2022 in Centereach, NY 57 Less than $10014 $150 to $19962 $350 to $39913 $400 to $4495 $600 to $6497 $650 to $69938 $700 to $7496 $800 to $899191 $1,000 to $1,24982 $1,250 to $1,499254 $1,500 to $1,999324 $2,000 to $2,499363 $2,500 to $2,999120 $3,000 to $3,499288 $3,500 or more45 No cash rent
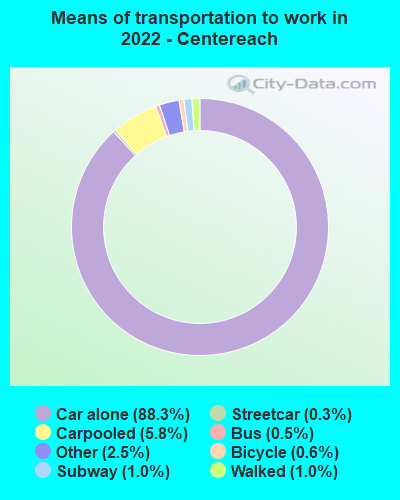
Percentage of workers working in this county: 87.1%Number of people working at home: 1,804 (11.4% of all workers )
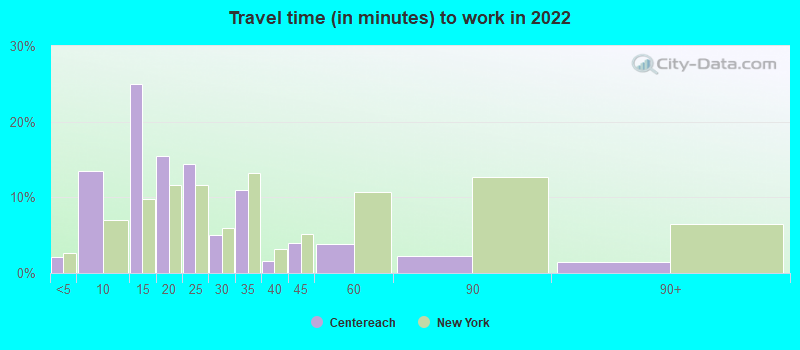
Travel time to work (commute)
Less than 5 minutes: 1475 to 9 minutes: 96310 to 14 minutes: 1,53815 to 19 minutes: 1,87720 to 24 minutes: 2,25125 to 29 minutes: 86630 to 34 minutes: 2,30135 to 39 minutes: 22040 to 44 minutes: 48745 to 59 minutes: 81460 to 89 minutes: 1,49790 or more minutes: 917
Means of transportation to work:
Drove a car alone: 5,817 (69.8%)Carpooled: 435 (5.2%)Bus : 31 (0.4%)Subway or elevated rail : 19 (0.2%)Long-distance train or commuter rail : 70 (0.8%)Taxi: 205 (2.5%)Bicycle: 29 (0.3%)Walked: 68 (0.8%)Worked at home: 1,804 (21.7%)
Unemployment by race in 2022
Unemployment rate for White non-Hispanic residents 7.2% Males1.9% FemalesUnemployment rate for Black residents 0.7% Males5.1% FemalesUnemployment rate for Asian residents 4.0% Males5.4% FemalesUnemployment rate for other race residents 1.2% Males0.9% FemalesUnemployment rate for two or more race residents 8.0% Males14.8% FemalesUnemployment rate for Hispanic or Latino residents 0.9% Males9.1% Females
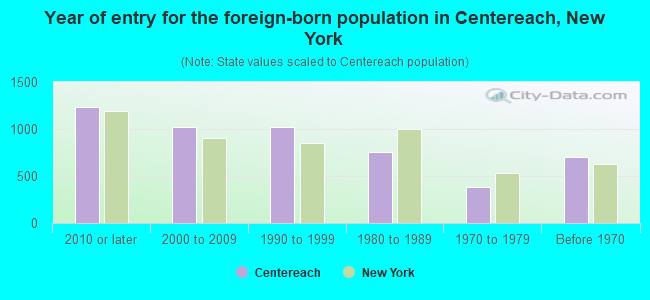
Year of entry for the foreign-born population in Centereach, New York
1,229 2010 or later 1,024 2000 to 2009 1,021 1990 to 1999 754 1980 to 1989 386 1970 to 1979 697 Before 1970
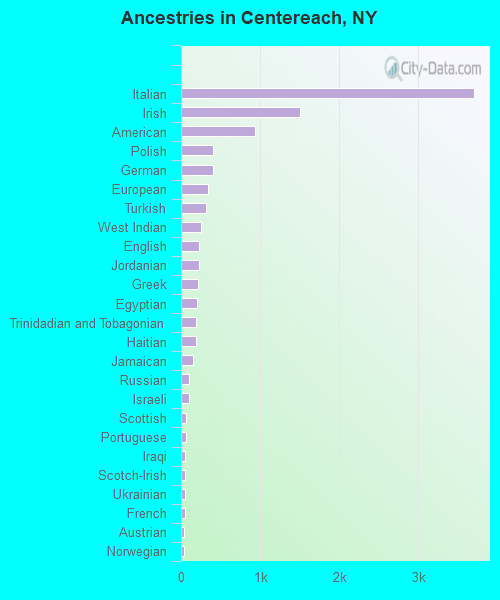
First ancestries reported:
Italian: 3,709 (24.6%)
Irish: 1,504 (10.0%)
American: 934 (6.2%)
Polish: 410 (2.7%)
German: 410 (2.7%)
European: 344 (2.3%)
Turkish: 319 (2.1%)
West Indian: 257 (1.7%)
English: 229 (1.5%)
Jordanian: 227 (1.5%)
Greek: 218 (1.4%)
Egyptian: 203 (1.3%)
Trinidadian and Tobagonian: 189 (1.3%)
Haitian: 185 (1.2%)
Jamaican: 154 (1.0%)
Russian: 106 (0.7%)
Israeli: 103 (0.7%)
Scottish: 61 (0.4%)
Portuguese: 61 (0.4%)
Iraqi: 51 (0.3%)
Scotch-Irish: 51 (0.3%)
Ukrainian: 46 (0.3%)
French: 45 (0.3%)
Austrian: 43 (0.3%)
Norwegian: 42 (0.3%)
Ethiopian: 39 (0.3%)
Eastern European: 30 (0.2%)
Hungarian: 29 (0.2%)
Swedish: 24 (0.2%)
Dutch: 23 (0.2%)
Canadian: 14 (0.09%)
Armenian: 13 (0.09%)
Croatian: 12 (0.08%)
Bulgarian: 12 (0.08%)
Czechoslovakian: 11 (0.07%)
Iranian: 10 (0.07%)
British West Indian: 10 (0.07%)
Czech: 7 (0.05%)
Ghanaian: 7 (0.05%)
African: 6 (0.04%)
Swiss: 5 (0.03%)
Lithuanian: 4 (0.03%)
Maltese: 4 (0.03%)
Slovak: 4 (0.03%)
British: 3 (0.02%)
Northern European: 3 (0.02%)
Most common places of birth for foreign-born residents (%): China, excluding Hong Kong and Taiwan Centereach:
10.8% (506)New York:
9.1% (410,910)
Ecuador Centereach:
8.0% (375)New York:
3.9% (177,448)
Pakistan Centereach:
6.0% (282)New York:
1.4% (62,442)
Turkey Centereach:
5.6% (265)New York:
0.5% (21,009)
Colombia Centereach:
5.0% (237)New York:
2.5% (111,920)
Mexico Centereach:
4.6% (217)New York:
4.8% (214,559)
Philippines Centereach:
4.0% (190)New York:
2.0% (91,070)
Poland Centereach:
3.7% (174)New York:
1.4% (65,102)
Egypt Centereach:
3.5% (163)New York:
0.6% (27,385)
Guatemala Centereach:
3.4% (161)New York:
1.4% (61,245)
Jamaica Centereach:
3.4% (159)New York:
5.0% (227,557)
India Centereach:
2.9% (136)New York:
3.5% (158,432)
Honduras Centereach:
2.7% (128)New York:
1.2% (55,571)
England Centereach:
2.6% (123)New York:
0.5% (23,058)
Haiti Centereach:
2.5% (116)New York:
2.8% (126,936)
El Salvador Centereach:
2.0% (96)New York:
2.4% (108,067)
Germany Centereach:
2.0% (92)New York:
0.9% (38,713)
Trinidad and Tobago Centereach:
1.9% (89)New York:
2.0% (91,428)
Dominican Republic Centereach:
1.7% (81)New York:
11.1% (501,040)
Bangladesh Centereach:
1.7% (81)New York:
2.6% (117,288)
Place of birth for U.S.-born residents:
This state: 24,239Other state: 2,028Northeast: 897Midwest: 288South: 555West: 262 90.3% of Centereach residents lived in the same house 1 years ago.
Out of people who lived in different houses, 35.0% lived in this county.
Out of people who lived in different counties, 71.0% lived in New York.
Centereach:
90.3%State average:
89.6%
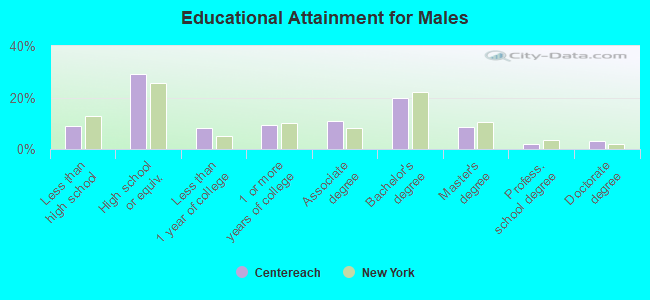
Education attainment for males 25 years and older:
No schooling: 243Nursery to 4th grade: 45th and 6th grade: 337th and 8th grade: 379th grade: 1510th grade: 4411th grade: 20212th grade, no diploma: 348High school graduate (or equivalency): 3,071Less than 1 year of college: 859Some college more than 1 year, no degree: 999Associate degree: 1,163Bachelor's degree: 2,093Master's degree: 882Professional school degree: 196Doctorate degree: 323
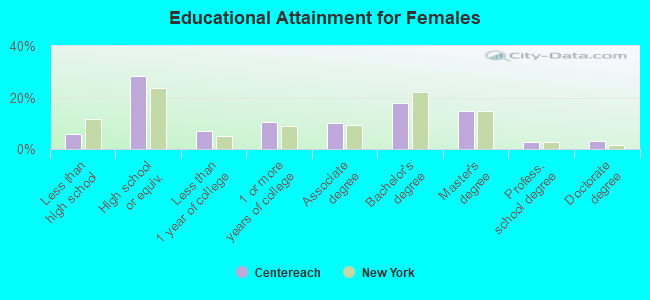
Education attainment for females 25 years and older:
No schooling: 127Nursery to 4th grade: 55th and 6th grade: 637th and 8th grade: 389th grade: 5910th grade: 2511th grade: 13812th grade, no diploma: 167High school graduate (or equivalency): 3,080Less than 1 year of college: 756Some college more than 1 year, no degree: 1,127Associate degree: 1,115Bachelor's degree: 1,937Master's degree: 1,631Professional school degree: 299Doctorate degree: 358
Housing units in structures:
One, detached: 9,326One, attached: 127Two: 1523 or 4: 765 to 9: 17610 to 19: 9620 to 49: 5250 or more: 489Mobile homes: 55Housing units lacking complete plumbing facilities in 2022: 1.0%Housing units lacking complete kitchen facilities in 2022: 2.0%House/condo owner moved in on average 18 years ago
Renter moved in on average 3 years ago
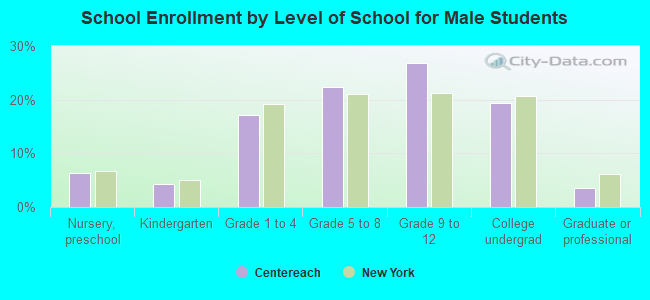
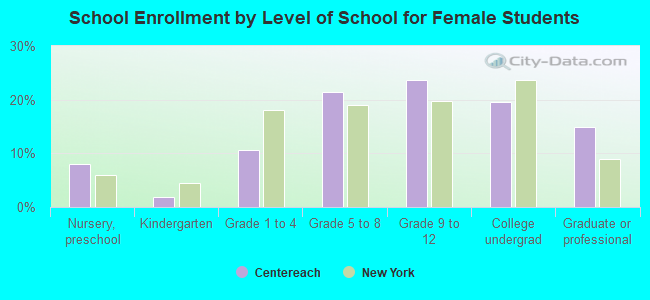
Private vs. public school enrollment:
Students in private schools in grades 1 to 8 (elementary and middle school): 115 Students in private schools in grades 9 to 12 (high school): 25 Students in private undergraduate colleges: 285