Housing density: 513 houses/condos per square mile
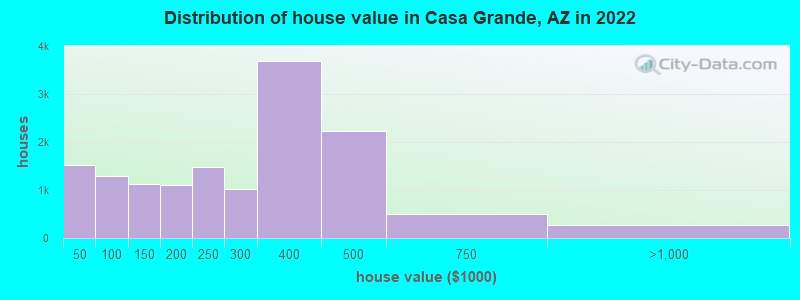
Median price asked for vacant for-sale houses and condos in 2022: $242,898.
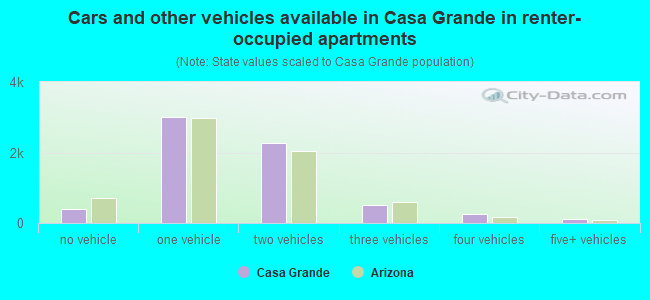
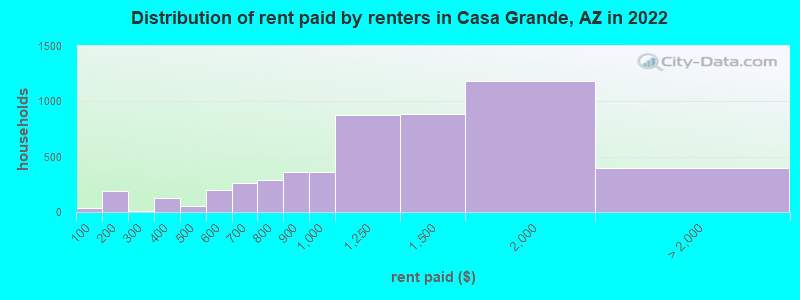
Median contract rent in 2022: $1,297 (lower quartile is $911, upper quartile is $1,546)
Median rent asked for vacant for-rent units in 2022: $742
Median gross rent in Casa Grande, AZ in 2022: $1,471
Housing units in Casa Grande with a mortgage: 8,751 (363 second mortgage, 38 home equity loan, 265 both second mortgage and home equity loan) Houses without a mortgage: 47
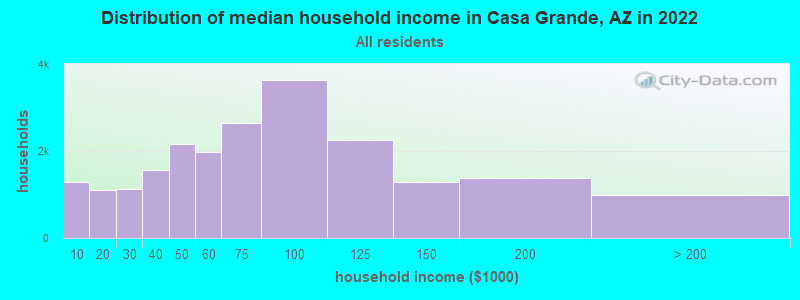
Median household income for houses/condos with a mortgage: $81,436
Median household income for apartments without a mortgage: $65,635
7,964 married couples with children.
4,376 single-parent households (1,385 men, 2,991 women).
75.2% of residents of Casa Grande speak English at home.
22.0% of residents speak Spanish at home (71% speak English very well, 12% speak English well, 11% speak English not well, 5% don't speak English at all).
0.9% of residents speak other Indo-European language at home (40% speak English very well, 60% speak English well).
1.5% of residents speak Asian or Pacific Island language at home (72% speak English very well, 23% speak English well, 5% speak English not well).
0.4% of residents speak other language at home (79% speak English very well, 11% speak English well, 10% speak English not well).
Foreign born population: 7,470 (12.6%)
(39.3% of them are naturalized citizens)
Percentage of workers working in this county: 84.2% Number of people working at home: 2,434 (9.3% of all workers)
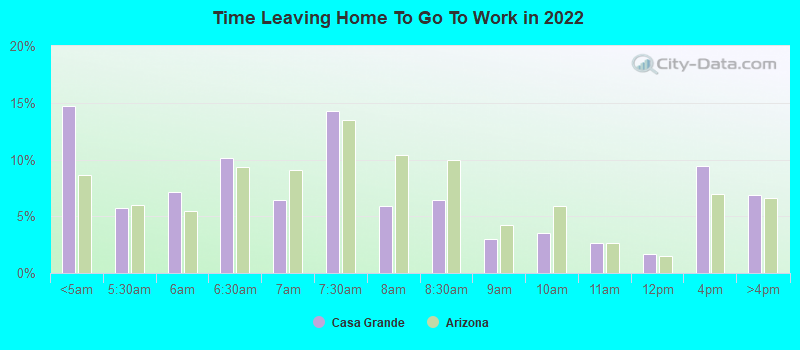
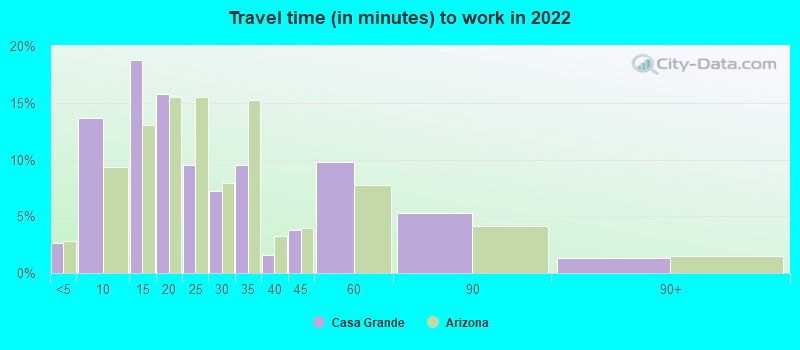
Travel time to work (commute)
Less than 5 minutes: 701
5 to 9 minutes: 3,231
10 to 14 minutes: 5,020
15 to 19 minutes: 3,514
20 to 24 minutes: 2,071
25 to 29 minutes: 1,386
30 to 34 minutes: 1,846
35 to 39 minutes: 602
40 to 44 minutes: 662
45 to 59 minutes: 1,763
60 to 89 minutes: 1,747
90 or more minutes: 167
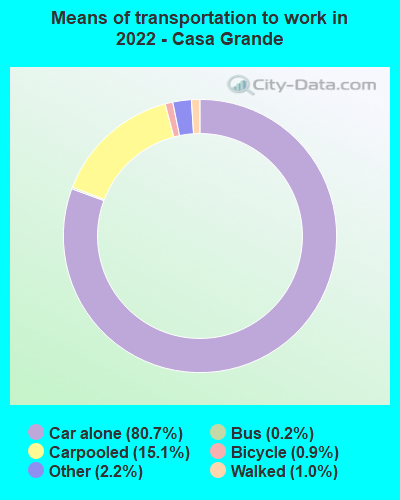
Means of transportation to work:
Drove a car alone: 19,286 (71.0%)
Carpooled: 3,797 (14.0%)
Bus: 33 (0.1%)
Taxi: 595 (2.2%)
Bicycle: 176 (0.6%)
Walked: 252 (0.9%)
Worked at home: 2,260 (8.3%)
Unemployment by race in 2022
Unemployment rate for White non-Hispanic residents
4.0%Males
5.7%Females
Unemployment rate for Black residents
1.7%Females
Unemployment rate for American Indian and Alaska Native residents
1.9%Males
13.9%Females
Unemployment rate for Asian residents
6.3%Males
Unemployment rate for other race residents
14.6%Males
15.8%Females
Unemployment rate for two or more race residents
7.5%Males
Unemployment rate for Hispanic or Latino residents
7.1%Males
7.7%Females
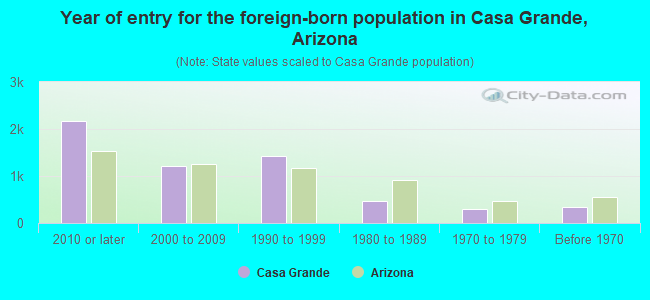
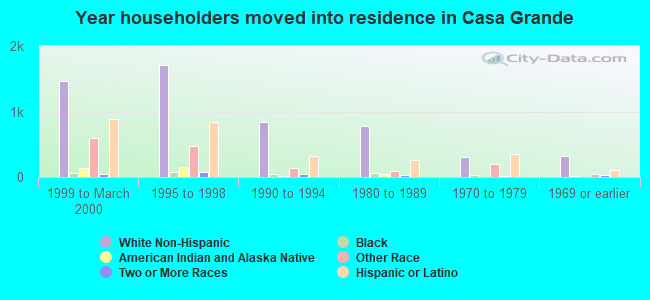
Year of entry for the foreign-born population in Casa Grande, Arizona
2,1602010 or later
1,2092000 to 2009
1,4161990 to 1999
4701980 to 1989
3021970 to 1979
336Before 1970
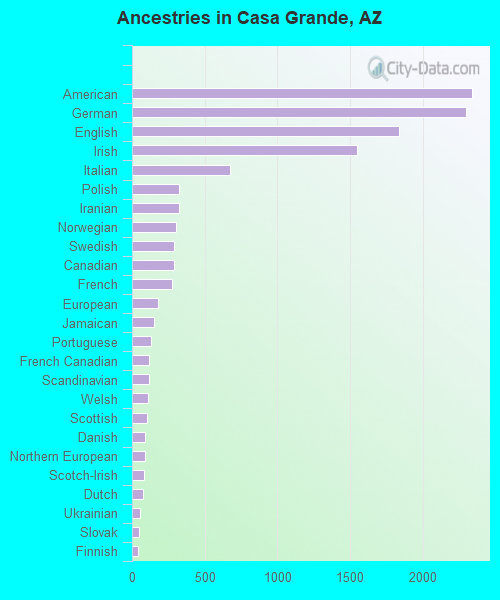
First ancestries reported:
American: 2,340 (7.1%)
German: 2,298 (7.0%)
English: 1,840 (5.6%)
Irish: 1,546 (4.7%)
Italian: 676 (2.1%)
Polish: 324 (1.0%)
Iranian: 323 (1.0%)
Norwegian: 305 (0.9%)
Swedish: 289 (0.9%)
Canadian: 289 (0.9%)
French: 273 (0.8%)
European: 182 (0.6%)
Jamaican: 148 (0.4%)
Portuguese: 129 (0.4%)
French Canadian: 119 (0.4%)
Scandinavian: 114 (0.3%)
Welsh: 109 (0.3%)
Scottish: 101 (0.3%)
Danish: 92 (0.3%)
Northern European: 89 (0.3%)
Scotch-Irish: 81 (0.2%)
Dutch: 76 (0.2%)
Ukrainian: 53 (0.2%)
Slovak: 49 (0.1%)
Finnish: 41 (0.1%)
Czech: 28 (0.08%)
Hungarian: 24 (0.07%)
British: 24 (0.07%)
Belizean: 24 (0.07%)
Russian: 22 (0.07%)
Greek: 21 (0.06%)
African: 21 (0.06%)
Cape Verdean: 16 (0.05%)
Albanian: 14 (0.04%)
Israeli: 13 (0.04%)
Romanian: 13 (0.04%)
Eastern European: 13 (0.04%)
Lithuanian: 12 (0.04%)
Austrian: 10 (0.03%)
Swiss: 8 (0.02%)
Syrian: 8 (0.02%)
Basque: 6 (0.02%)
Luxembourger: 5 (0.02%)
Czechoslovakian: 5 (0.02%)
Yugoslavian: 5 (0.02%)
Trinidadian and Tobagonian: 4 (0.01%)
Most common places of birth for foreign-born residents (%):
Mexico
Casa Grande:
59.5% (3,906)
Arizona:
53.4% (500,086)
Philippines
Casa Grande:
7.6% (501)
Arizona:
3.2% (30,378)
Canada
Casa Grande:
6.3% (416)
Arizona:
4.3% (40,102)
Iran
Casa Grande:
4.3% (284)
Arizona:
0.6% (5,893)
Jamaica
Casa Grande:
3.4% (221)
Arizona:
0.3% (2,710)
El Salvador
Casa Grande:
2.6% (169)
Arizona:
1.2% (10,932)
Nicaragua
Casa Grande:
2.3% (154)
Arizona:
0.4% (3,526)
Vietnam
Casa Grande:
2.2% (144)
Arizona:
2.1% (19,199)
Germany
Casa Grande:
2.0% (133)
Arizona:
1.5% (14,058)
India
Casa Grande:
1.9% (124)
Arizona:
4.5% (41,719)
Place of birth for U.S.-born residents:
This state: 25,221
Other state: 25,607
Northeast: 3,051
Midwest: 8,666
South: 3,564
West: 10,291
81.4% of Casa Grande residents lived in the same house 1 years ago. Out of people who lived in different houses, 37.0% lived in this county. Out of people who lived in different counties, 55.0% lived in Arizona.
Casa Grande:
81.4%
State average:
86.0%
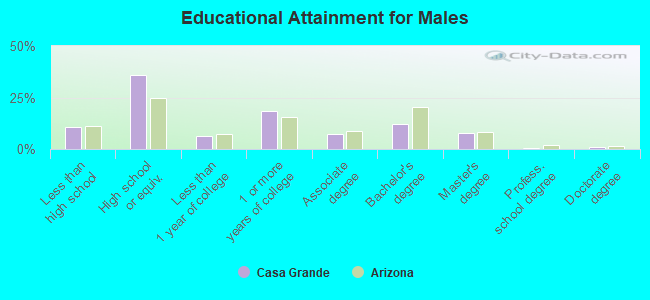
Education attainment for males 25 years and older:
No schooling: 455
Nursery to 4th grade: 35
5th and 6th grade: 194
7th and 8th grade: 169
9th grade: 84
10th grade: 143
11th grade: 226
12th grade, no diploma: 645
High school graduate (or equivalency): 6,670
Less than 1 year of college: 1,213
Some college more than 1 year, no degree: 3,465
Associate degree: 1,335
Bachelor's degree: 2,232
Master's degree: 1,480
Professional school degree: 121
Doctorate degree: 167
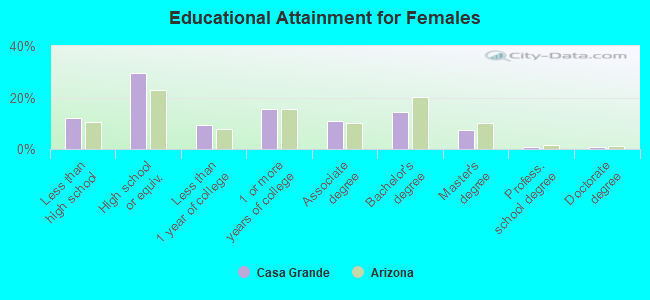
Education attainment for females 25 years and older:
No schooling: 354
Nursery to 4th grade: 108
5th and 6th grade: 144
7th and 8th grade: 692
9th grade: 178
10th grade: 89
11th grade: 371
12th grade, no diploma: 512
High school graduate (or equivalency): 6,039
Less than 1 year of college: 1,873
Some college more than 1 year, no degree: 3,146
Associate degree: 2,176
Bachelor's degree: 2,899
Master's degree: 1,466
Professional school degree: 133
Doctorate degree: 177
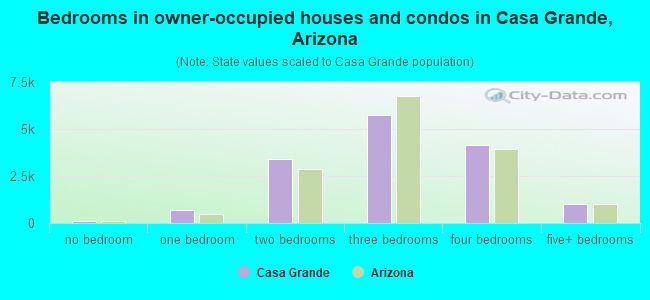
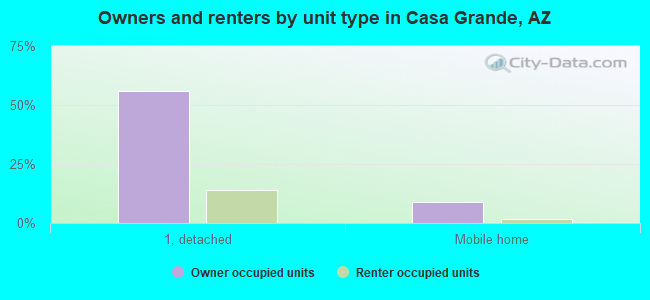
Housing units in structures:
One, detached: 16,372
One, attached: 607
Two: 258
3 or 4: 425
5 to 9: 993
10 to 19: 460
20 to 49: 543
50 or more: 945
Mobile homes: 3,874
Boats, RVs, vans, etc.: 235
Median worth of mobile homes: $67,946
Housing units lacking complete plumbing facilities in 2022: 0.8%
Housing units lacking complete kitchen facilities in 2022: 2.7%