Camden, NJ (New Jersey) Houses and Residents
Estimated median house or condo value in 2022: $94,200 (it was $40,800 in 2000 )
Camden:
$94,200New Jersey:
$428,900
Lower value quartile - upper value quartile: $67,400 - $163,000Mean price in 2022: Detached houses: $152,853 Here:
$152,853State:
$537,591
Townhouses or other attached units: $106,604 Here:
$106,604State:
$381,113
In 2-unit structures: $478,776 Here:
$478,776State:
$444,476
In 3-to-4-unit structures: $114,295 Here:
$114,295State:
$457,463
In 5-or-more-unit structures: $156,750 Here:
$156,750State:
$368,745
Mobile homes: $10,288 Here:
$10,288State:
$119,788
Total population: 77,332 (All urban)
Houses: 26,678 (24,224 occupied: 8,666 owner occupied, 15,558 renter occupied )
% of renters here:
64%State:
35%
Housing density: 3,024 houses/condos per square mile
Median price asked for vacant for-sale houses and condos in 2022: $189,004.
Median contract rent in 2022: $873 (lower quartile is $538, upper quartile is $1,134)
Median rent asked for vacant for-rent units in 2022: $738
Median gross rent in Camden, NJ in 2022: $1,107
Housing units in Camden with a mortgage: 5,064 (352 second mortgage, 2 home equity loan, 325 both second mortgage and home equity loan )Houses without a mortgage: 212
Median household income for houses/condos with a mortgage: $69,180
Median household income for apartments without a mortgage: $56,060
Median monthly housing costs: $1,004
Data:
Median house or condo value ($)
Median house or condo value ($ change since 2000)
Median house or condo value ($) - White
Median house or condo value ($) - Black or African American
Median house or condo value ($) - Asian
Median house or condo value ($) - Hispanic or Latino
Median house or condo value ($) - American Indian and Alaska Native
Median house or condo value ($) - Multirace
Median house or condo value ($) - Other Race
Median price asked for mobile homes ($)
Household density (households per square mile)
Mean house or condo value by units in structure - 1, detached ($)
Mean house or condo value by units in structure - 1, attached ($)
Mean house or condo value by units in structure - 2 ($)
Mean house or condo value by units in structure by units in structure - 3 or 4 ($)
Mean house or condo value by units in structure - 5 or more ($)
Mean house or condo value by units in structure - Boat, RV, van, etc. ($)
Mean house or condo value by units in structure - Mobile home ($)
Median contract rent ($)
Median contract rent - Lower quartile ($)
Median contract rent - Upper quartile ($)
Median gross rent ($)
Urban houses (%)
Rural houses (%)
Houses occupied (%)
Houses occupied (% change since 2000)
Houses owner occupied (%)
Houses owner occupied (% change since 2000)
Houses renter occupied (%)
Houses renter occupied (% change since 2000)
Vacant housing units - For rent (%)
Vacant housing units - For rent (% change since 2000)
Vacant housing units - For sale only (%)
Vacant housing units - For sale only (% change since 2000)
Vacant housing units - Rented or sold, not occupied (%)
Vacant housing units - Rented or sold, not occupied (% change since 2000)
Vacant housing units - For seasonal, recreational, or occasional use (%)
Vacant housing units - For seasonal, recreational, or occasional use (% change since 2000)
Vacant housing units - For migrant workers (%)
Vacant housing units - For migrant workers (% change since 2000)
Vacant housing units - Other vacant (%)
Vacant housing units - Other vacant (% change since 2000)
Median monthly housing costs ($)
Median household income for houses/condos with a mortgage ($)
Median household income for houses/condos without a mortgage ($)
Median household income ($)
Median household income ($) - White
Median household income ($) - Black or African American
Median household income ($) - Asian
Median household income ($) - Hispanic or Latino
Median household income ($) - American Indian and Alaska Native
Median household income ($) - Multirace
Median household income ($) - Other Race
Mortgage status - with mortgage (%)
Mortgage status - with second mortgage (%)
Mortgage status - with home equity loan (%)
Mortgage status - with both second mortgage and home equity loan (%)
Mortgage status - without a mortgage (%)
Median year house/condo built
Median year apartment built
Household type by relationship - Male householder living alone (%)
Household type by relationship - Male householder not living alone (%)
Household type by relationship - Female householder living alone (%)
Household type by relationship - Female householder not living alone (%)
Household type by relationship - Opposite-Sex spouse (%)
Household type by relationship - Same-Sex spouse (%)
Household type by relationship - Opposite-Sex unmarried partner (%)
Household type by relationship - Same-Sex unmarried partner (%)
Household type by relationship - In group quarters (%)
Size of family households - 2-person household (%)
Size of family households - 3-person household (%)
Size of family households - 4-person household (%)
Size of family households - 5-person household (%)
Size of family households - 6-person household (%)
Size of family households - 7-or-more-person household (%)
Size of nonfamily households - 1-person household (%)
Size of nonfamily households - 2-person household (%)
Size of nonfamily households - 3-person household (%)
Size of nonfamily households - 4-person household (%)
Size of nonfamily households - 5-person household (%)
Size of nonfamily households - 6-person household (%)
Size of nonfamily households - 7-or-moreperson household (%)
Year house built - Built 2010 or later (%)
Year house built - Built 2000 to 2009 (%)
Year house built - Built 1990 to 1999 (%)
Year house built - Built 1980 to 1989 (%)
Year house built - Built 1970 to 1979 (%)
Year house built - Built 1960 to 1969 (%)
Year house built - Built 1950 to 1959 (%)
Year house built - Built 1940 to 1949 (%)
Year house built - Built 1939 or earlier (%)
Median number of rooms in houses and condos
Median number of rooms in apartments
Median number of bedrooms in owner occupied houses
Mean number of bedrooms in owner occupied houses
Median number of bedrooms in renter occupied houses
Mean number of bedrooms in renter occupied houses
Median number of vehichles in owner occupied houses
Mean number of vehichles in owner occupied houses
Median number of vehichles in renter occupied houses
Mean number of vehichles in renter occupied houses
Rooms in owner-occupied houses - 1 room (%)
Rooms in owner-occupied houses - 2 rooms (%)
Rooms in owner-occupied houses - 3 rooms (%)
Rooms in owner-occupied houses - 4 rooms (%)
Rooms in owner-occupied houses - 5 rooms (%)
Rooms in owner-occupied houses - 6 rooms (%)
Rooms in owner-occupied houses - 7 rooms (%)
Rooms in owner-occupied houses - 8 rooms (%)
Rooms in owner-occupied houses - 9+ rooms (%)
Rooms in renter-occupied houses - 1 room (%)
Rooms in renter-occupied houses - 2 rooms (%)
Rooms in renter-occupied houses - 3 rooms (%)
Rooms in renter-occupied houses - 4 rooms (%)
Rooms in renter-occupied houses - 5 rooms (%)
Rooms in renter-occupied houses - 6 rooms (%)
Rooms in renter-occupied houses - 7 rooms (%)
Rooms in renter-occupied houses - 8 rooms (%)
Rooms in renter-occupied houses - 9+ rooms (%)
Bedrooms in owner-occupied houses - no bedrooms (%)
Bedrooms in owner-occupied houses - 1 bedroom (%)
Bedrooms in owner-occupied houses - 2 bedrooms (%)
Bedrooms in owner-occupied houses - 3 bedrooms (%)
Bedrooms in owner-occupied houses - 4 bedrooms (%)
Bedrooms in owner-occupied houses - 5+ bedrooms (%)
Bedrooms in renter-occupied houses - no bedrooms (%)
Bedrooms in renter-occupied houses - 1 bedroom (%)
Bedrooms in renter-occupied houses - 2 bedrooms (%)
Bedrooms in renter-occupied houses - 3 bedrooms (%)
Bedrooms in renter-occupied houses - 4 bedrooms (%)
Bedrooms in renter-occupied houses - 5+ bedrooms (%)
Vehicles available in owner-occupied houses - no vehicle available (%)
Vehicles available in owner-occupied houses - 1 vehicle available(%)
Vehicles available in owner-occupied houses - 2 Vehicles available (%)
Vehicles available in owner-occupied houses - 3 Vehicles available (%)
Vehicles available in owner-occupied houses - 4 Vehicles available (%)
Vehicles available in owner-occupied houses - 5+ Vehicles available (%)
Vehicles available in renter-occupied houses - no vehicle available (%)
Vehicles available in renter-occupied houses - 1 vehicle available (%)
Vehicles available in renter-occupied houses - 2 Vehicles available (%)
Vehicles available in renter-occupied houses - 3 Vehicles available (%)
Vehicles available in renter-occupied houses - 4 Vehicles available (%)
Vehicles available in renter-occupied houses - 5+ Vehicles available (%)
Housing units in structures - 1, detached (%)
Housing units in structures - 1, attached (%)
Housing units in structures - 2 (%)
Housing units in structures - 3 or 4 (%)
Housing units in structures - 5 to 9 (%)
Housing units in structures - 10 to 19 (%)
Housing units in structures - 20 to 49 (%)
Housing units in structures - 50 or more (%)
Housing units in structures - Mobile home (%)
Housing units in structures - Boat, RV, van, etc. (%)
Housing units in structures - Owners - 1, detached (%)
Housing units in structures - Owners - 1, attached (%)
Housing units in structures - Owners - 2 (%)
Housing units in structures - Owners - 3 or 4 (%)
Housing units in structures - Owners - 5 to 9 (%)
Housing units in structures - Owners - 10 to 19 (%)
Housing units in structures - Owners - 20 to 49 (%)
Housing units in structures - Owners - 50 or more (%)
Housing units in structures - Owners - Mobile home (%)
Housing units in structures - Owners - Boat, RV, van, etc. (%)
Housing units in structures - Renters - 1, detached (%)
Housing units in structures - Renters - 1, attached (%)
Housing units in structures - Renters - 2 (%)
Housing units in structures - Renters - 3 or 4 (%)
Housing units in structures - Renters - 5 to 9 (%)
Housing units in structures - Renters - 10 to 19 (%)
Housing units in structures - Renters - 20 to 49 (%)
Housing units in structures - Renters - 50 or more (%)
Housing units in structures - Renters - Mobile home (%)
Housing units in structures - Renters - Boat, RV, van, etc. (%)
House/condo owner moved in on average (years ago)
Renter moved in on average (years ago)
Year householder moved into unit - Moved in 1999 to March 2000 (%)
Year householder moved into unit - Moved in 1999 to March 2000 (%) - White
Year householder moved into unit - Moved in 1999 to March 2000 (%) - Black or African American
Year householder moved into unit - Moved in 1999 to March 2000 (%) - Asian
Year householder moved into unit - Moved in 1999 to March 2000 (%) - Hispanic or Latino
Year householder moved into unit - Moved in 1999 to March 2000 (%) - American Indian and Alaska Native
Year householder moved into unit - Moved in 1999 to March 2000 (%) - Multirace
Year householder moved into unit - Moved in 1999 to March 2000 (%) - Other Race
Year householder moved into unit - Moved in 1995 to 1998 (%)
Year householder moved into unit - Moved in 1995 to 1998 (%) - White
Year householder moved into unit - Moved in 1995 to 1998 (%) - Black or African American
Year householder moved into unit - Moved in 1995 to 1998 (%) - Asian
Year householder moved into unit - Moved in 1995 to 1998 (%) - Hispanic or Latino
Year householder moved into unit - Moved in 1995 to 1998 (%) - American Indian and Alaska Native
Year householder moved into unit - Moved in 1995 to 1998 (%) - Multirace
Year householder moved into unit - Moved in 1995 to 1998 (%) - Other Race
Year householder moved into unit - Moved in 1990 to 1994 (%)
Year householder moved into unit - Moved in 1990 to 1994 (%) - White
Year householder moved into unit - Moved in 1990 to 1994 (%) - Black or African American
Year householder moved into unit - Moved in 1990 to 1994 (%) - Asian
Year householder moved into unit - Moved in 1990 to 1994 (%) - Hispanic or Latino
Year householder moved into unit - Moved in 1990 to 1994 (%) - American Indian and Alaska Native
Year householder moved into unit - Moved in 1990 to 1994 (%) - Multirace
Year householder moved into unit - Moved in 1990 to 1994 (%) - Other Race
Year householder moved into unit - Moved in 1980 to 1989 (%)
Year householder moved into unit - Moved in 1980 to 1989 (%) - White
Year householder moved into unit - Moved in 1980 to 1989 (%) - Black or African American
Year householder moved into unit - Moved in 1980 to 1989 (%) - Asian
Year householder moved into unit - Moved in 1980 to 1989 (%) - Hispanic or Latino
Year householder moved into unit - Moved in 1980 to 1989 (%) - American Indian and Alaska Native
Year householder moved into unit - Moved in 1980 to 1989 (%) - Multirace
Year householder moved into unit - Moved in 1980 to 1989 (%) - Other Race
Year householder moved into unit - Moved in 1970 to 1979 (%)
Year householder moved into unit - Moved in 1970 to 1979 (%) - White
Year householder moved into unit - Moved in 1970 to 1979 (%) - Black or African American
Year householder moved into unit - Moved in 1970 to 1979 (%) - Asian
Year householder moved into unit - Moved in 1970 to 1979 (%) - Hispanic or Latino
Year householder moved into unit - Moved in 1970 to 1979 (%) - American Indian and Alaska Native
Year householder moved into unit - Moved in 1970 to 1979 (%) - Multirace
Year householder moved into unit - Moved in 1970 to 1979 (%) - Other Race
Year householder moved into unit - Moved in 1969 or earlier (%)
Year householder moved into unit - Moved in 1969 or earlier (%) - White
Year householder moved into unit - Moved in 1969 or earlier (%) - Black or African American
Year householder moved into unit - Moved in 1969 or earlier (%) - Asian
Year householder moved into unit - Moved in 1969 or earlier (%) - Hispanic or Latino
Year householder moved into unit - Moved in 1969 or earlier (%) - American Indian and Alaska Native
Year householder moved into unit - Moved in 1969 or earlier (%) - Multirace
Year householder moved into unit - Moved in 1969 or earlier (%) - Other Race
Housing units lacking complete plumbing facilities (%)
Housing units lacking complete kitchen facilities (%)
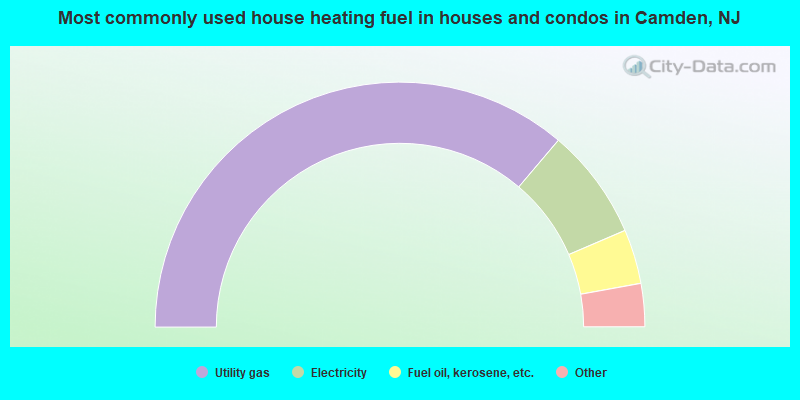
House heating fuel used in houses and condos - Utility gas (%)
House heating fuel used in houses and condos - Bottled, tank, or LP gas (%)
House heating fuel used in houses and condos - Electricity (%)
House heating fuel used in houses and condos - Fuel oil, kerosene, etc. (%)
House heating fuel used in houses and condos - Coal or coke (%)
House heating fuel used in houses and condos - Wood (%)
House heating fuel used in houses and condos - Solar energy (%)
House heating fuel used in houses and condos - Other fuel (%)
House heating fuel used in houses and condos - No fuel used (%)
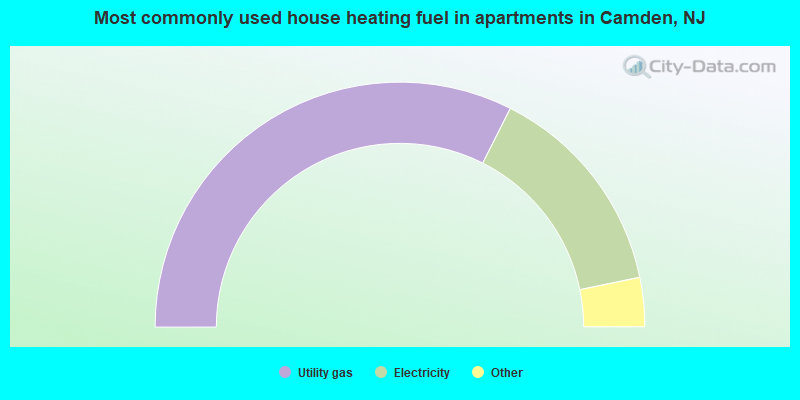
House heating fuel used in apartments - Utility gas (%)
House heating fuel used in apartments - Bottled, tank, or LP gas (%)
House heating fuel used in apartments - Electricity (%)
House heating fuel used in apartments - Fuel oil, kerosene, etc. (%)
House heating fuel used in apartments - Coal or coke (%)
House heating fuel used in apartments - Wood (%)
House heating fuel used in apartments - Solar energy (%)
House heating fuel used in apartments - Other fuel (%)
House heating fuel used in apartments - No fuel used (%)
Latest news about housing in Camden, NJ collected exclusively by city-data.com from local newspapers, TV, and radio stations
Median year house/condo built: 1945Median year apartment built: 1951Household type by relationship:
Households: 70,998
Male householders: 8,765 (2,797 living alone ), Female householders: 15,459 (3,928 living alone )4,129 spouses (4,129 opposite-sex spouses ), 1,953 unmarried partners , (1,896 opposite-sex unmarried partners ), 22,376 children (20,651 natural , 546 adopted , 1,179 stepchildren ), 3,796 grandchildren , 1,621 brothers or sisters , 835 parents , 0 foster children , 5,794 other relatives , 3,340 non-relatives In group quarters: 2,930
Size of family households: 5,556 2-persons , 4,392 3-persons , 2,847 4-persons , 1,313 5-persons , 1,101 6-persons , 838 7-or-more-persons .
Size of nonfamily households: 6,725 1-person , 798 2-persons , 529 3-persons , 125 6-persons .
3,304 married couples with children. single-parent households (1,221 men , 12,153 women ).
55.2% of residents of Camden speak English at home. of residents speak Spanish at home (46% speak English very well , 21% speak English well , 23% speak English not well , 10% don't speak English at all ).of residents speak other Indo-European language at home (63% speak English very well , 37% speak English well ).of residents speak Asian or Pacific Island language at home (52% speak English very well , 18% speak English well , 18% speak English not well , 12% don't speak English at all ).of residents speak other language at home (60% speak English very well , 40% speak English well ).
Foreign born population: 16,219 (22.8%)of them are naturalized citizens )
Median number of rooms in houses and condos:
Median number of rooms in apartments
Owner-occupied Renter-occupied
Rooms in owner-occupied houses in Camden, New Jersey
0 1 room 186 2 rooms 332 3 rooms 393 4 rooms 1,574 5 rooms 2,862 6 rooms 1,801 7 rooms 1,032 8 rooms 486 9+ rooms
Rooms in renter-occupied apartments in Camden, New Jersey
891 1 room 687 2 rooms 1,797 3 rooms 3,976 4 rooms 2,989 5 rooms 4,332 6 rooms 515 7 rooms 199 8 rooms 172 9+ rooms
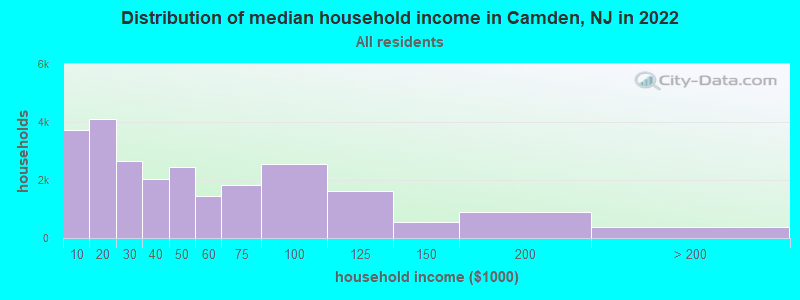
Camden, NJ household income distribution 3,708 Less than $10,0004,110 $10,000 to $19,9992,654 $20,000 to $29,9992,022 $30,000 to $39,9992,460 $40,000 to $49,9991,432 $50,000 to $59,9991,819 $60,000 to $74,9992,564 $75,000 to $99,9991,620 $100,000 to $124,999549 $125,000 to $149,999900 $150,000 to $199,999386 $200,000 or more
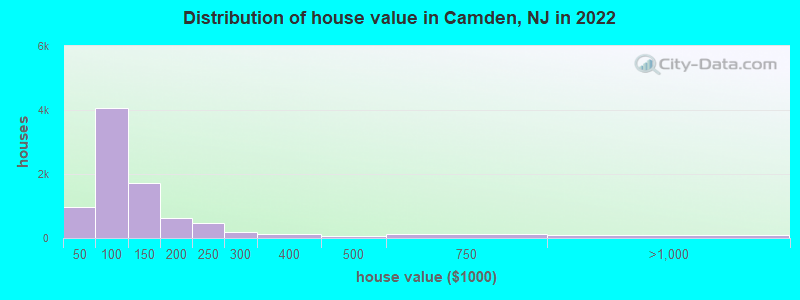
Home value of owner - occupied houses in 2022 in Camden, NJ 101 Less than $10,00058 $10,000 to $14,99988 $15,000 to $19,99966 $20,000 to $24,999152 $30,000 to $34,999246 $35,000 to $39,999265 $40,000 to $49,999701 $50,000 to $59,999518 $60,000 to $69,999413 $70,000 to $79,9991,270 $80,000 to $89,999895 $90,000 to $99,9991,199 $100,000 to $124,999508 $125,000 to $149,999373 $150,000 to $174,999263 $175,000 to $199,999484 $200,000 to $249,999173 $250,000 to $299,999126 $300,000 to $399,99971 $400,000 to $499,999112 $500,000 to $749,99996 $750,000 to $999,999Rent paid by renters in 2022 in Camden, NJ 152 Less than $100829 $100 to $149312 $150 to $199448 $200 to $249274 $250 to $299193 $300 to $349408 $350 to $399221 $400 to $449768 $450 to $499104 $500 to $549118 $550 to $59984 $600 to $649888 $650 to $6991,112 $700 to $7491,085 $750 to $799507 $800 to $8991,099 $900 to $9994,575 $1,000 to $1,249833 $1,250 to $1,499591 $1,500 to $1,999135 $2,000 to $2,499822 No cash rent
Percentage of workers working in this county: 66.9%Number of people working at home: 922 (3.5% of all workers )
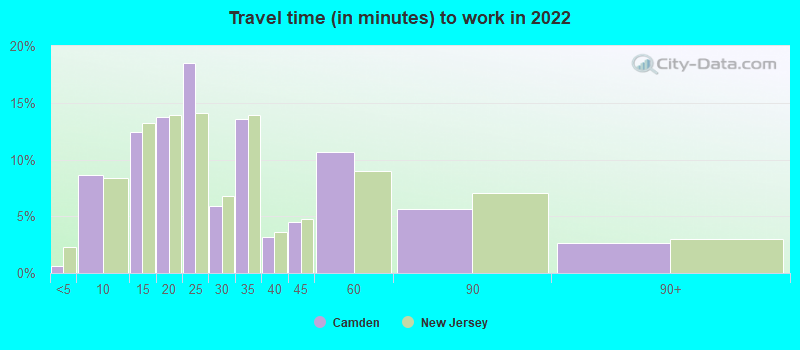
Travel time to work (commute)
Less than 5 minutes: 3065 to 9 minutes: 3,88110 to 14 minutes: 3,36615 to 19 minutes: 3,57220 to 24 minutes: 4,32825 to 29 minutes: 2,00230 to 34 minutes: 3,72235 to 39 minutes: 11740 to 44 minutes: 1,43245 to 59 minutes: 1,24360 to 89 minutes: 1,22890 or more minutes: 599
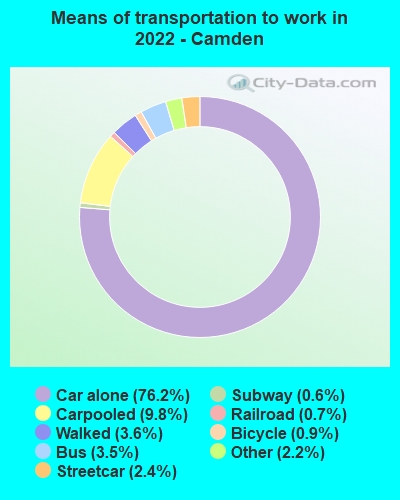
Means of transportation to work:
Drove a car alone: 26,337 (74.2%)Carpooled: 3,383 (9.5%)Bus : 1,222 (3.4%)Subway or elevated rail : 840 (2.4%)Long-distance train or commuter rail : 201 (0.6%)Light rail, streetcar or trolley : 258 (0.7%)Taxi: 767 (2.2%)Bicycle: 299 (0.8%)Walked: 1,261 (3.6%)Worked at home: 922 (2.6%)
Unemployment by race in 2022
Unemployment rate for White non-Hispanic residents 3.6% Males18.5% FemalesUnemployment rate for Black residents 14.2% Males26.7% FemalesUnemployment rate for American Indian and Alaska Native residents 12.7% MalesUnemployment rate for Asian residents 5.4% MalesUnemployment rate for other race residents 7.5% Males11.9% FemalesUnemployment rate for two or more race residents 11.9% Males12.4% FemalesUnemployment rate for Hispanic or Latino residents 5.4% Males3.1% Females
Year of entry for the foreign-born population in Camden, New Jersey
5,023 2010 or later 2,853 2000 to 2009 2,615 1990 to 1999 2,110 1980 to 1989 624 1970 to 1979 324 Before 1970
First ancestries reported:
Nigerian: 530 (1.2%)
American: 529 (1.2%)
Haitian: 473 (1.1%)
Jamaican: 337 (0.8%)
Irish: 284 (0.6%)
Moroccan: 268 (0.6%)
African: 178 (0.4%)
German: 171 (0.4%)
Trinidadian and Tobagonian: 123 (0.3%)
Italian: 97 (0.2%)
Ethiopian: 57 (0.1%)
British West Indian: 49 (0.1%)
Polish: 33 (0.07%)
Guyanese: 31 (0.07%)
Dutch: 24 (0.05%)
Eastern European: 24 (0.05%)
European: 24 (0.05%)
Brazilian: 17 (0.04%)
Hungarian: 14 (0.03%)
French: 11 (0.02%)
Palestinian: 9 (0.02%)
English: 6 (0.01%) Most common places of birth for foreign-born residents (%): Dominican Republic Camden:
50.7% (6,352)New Jersey:
9.7% (209,055)
Mexico Camden:
14.3% (1,788)New Jersey:
4.8% (102,527)
Nicaragua Camden:
5.2% (650)New Jersey:
0.3% (5,500)
Vietnam Camden:
4.3% (538)New Jersey:
0.7% (15,644)
Ecuador Camden:
3.9% (495)New Jersey:
4.4% (95,275)
Guatemala Camden:
3.9% (487)New Jersey:
2.2% (46,813)
Nigeria Camden:
3.1% (384)New Jersey:
1.2% (25,213)
Colombia Camden:
2.7% (342)New Jersey:
4.2% (90,817)
Cuba Camden:
1.9% (233)New Jersey:
2.1% (45,435)
Jamaica Camden:
1.8% (227)New Jersey:
2.2% (47,365)
Honduras Camden:
1.7% (212)New Jersey:
1.7% (37,335)
Place of birth for U.S.-born residents:
This state: 39,224Other state: 9,235Northeast: 6,051Midwest: 473South: 2,310West: 401 89.3% of Camden residents lived in the same house 1 years ago.
Out of people who lived in different houses, 37.7% lived in this county.
Out of people who lived in different counties, 49.8% lived in New Jersey.
Camden:
89.3%State average:
90.4%
Education attainment for males 25 years and older:
No schooling: 1,262Nursery to 4th grade: 4695th and 6th grade: 9057th and 8th grade: 1,1229th grade: 1,15210th grade: 47811th grade: 47612th grade, no diploma: 450High school graduate (or equivalency): 8,346Less than 1 year of college: 1,280Some college more than 1 year, no degree: 3,262Associate degree: 706Bachelor's degree: 825Master's degree: 444Professional school degree: 78Doctorate degree: 312
Education attainment for females 25 years and older:
No schooling: 1,148Nursery to 4th grade: 5725th and 6th grade: 8187th and 8th grade: 5979th grade: 23110th grade: 41811th grade: 1,15912th grade, no diploma: 599High school graduate (or equivalency): 7,173Less than 1 year of college: 1,672Some college more than 1 year, no degree: 3,895Associate degree: 1,977Bachelor's degree: 949Master's degree: 210Professional school degree: 92Doctorate degree: 64
Housing units in structures:
One, detached: 3,891One, attached: 14,005Two: 3,2123 or 4: 1,5455 to 9: 37510 to 19: 1,44720 to 49: 70850 or more: 1,495Housing units lacking complete plumbing facilities in 2022: 3.7%Housing units lacking complete kitchen facilities in 2022: 3.9%House/condo owner moved in on average 18 years ago
Renter moved in on average 4 years ago
Private vs. public school enrollment:
Students in private schools in grades 1 to 8 (elementary and middle school): 1,435 Here:
16.8%New Jersey:
12.3%
Students in private schools in grades 9 to 12 (high school): 1,020 Here:
17.7%New Jersey:
13.1%
Students in private undergraduate colleges: 648 Here:
22.1%New Jersey:
33.2%