Buffalo, MN (Minnesota) Houses and Residents
| Buffalo: | $284,464 |
| Minnesota: | $314,600 |
Mean price in 2022:
Detached houses: $326,539
Here: $326,539 State: $374,552 Townhouses or other attached units: $318,014
Here: $318,014 State: $312,049 In 2-unit structures: $170,140
Here: $170,140 State: $323,045 In 5-or-more-unit structures: $227,603
Here: $227,603 State: $258,516 Mobile homes: $36,599
Here: $36,599 State: $94,605
Total population: 15,912 (Urban population: 10,058 (all inside urban clusters), Rural population: 73 (all nonfarm))
Houses: 6,776 (6,521 occupied: 5,059 owner occupied, 1,570 renter occupied)
| % of renters here: | 24% |
| State: | 28% |
Housing density: 1,125 houses/condos per square mile
Median price asked for vacant for-sale houses and condos in 2022: $321,474.
Median contract rent in 2022: $1,033 (lower quartile is $791, upper quartile is $1,249)
Median rent asked for vacant for-rent units in 2022: $1,067
Median gross rent in Buffalo, MN in 2022: $1,118
Housing units in Buffalo with a mortgage: 3,805 (230 second mortgage, 15 home equity loan, 173 both second mortgage and home equity loan)
Houses without a mortgage: 21
Median household income for houses/condos with a mortgage: $98,480
Median household income for apartments without a mortgage: $57,543
Median monthly housing costs: $1,423
Compare current foreclosures in Buffalo, MN:
| Photo | Address | Area | Beds / Baths | Price | Details |
|---|---|---|---|---|---|

|
#1
8th Ave S
Buffalo, MN 55313
|
981 sq. feet
|
1 baths 3 beds |
show details | |

|
#2
Timber Ln
Buffalo, MN 55313
|
2,428 sq. feet
|
3 baths 4 beds |
show details | |

|
#3
Buffalo Ridge Dr
Buffalo, MN 55313
|
- sq. feet
|
3 baths 4 beds |
show details | |

|
#4
Creekside Dr
Buffalo, MN 55313
|
- sq. feet
|
1 baths 2 beds |
show details | |

|
#5
Buffalo Hills St
Buffalo, MN 55313
|
- sq. feet
|
2 baths 3 beds |
show details | |

|
#6
9th St SE
Buffalo, MN 55313
|
- sq. feet
|
2 baths 3 beds |
show details | |

|
#7
Maplewood Pl
Buffalo, MN 55313
|
- sq. feet
|
2 baths 3 beds |
show details | |

|
#8
Halsey Ave SE
Buffalo, MN 55313
|
- sq. feet
|
2 baths 3 beds |
show details | |

|
#9
Central Ave
Buffalo, MN 55313
|
- sq. feet
|
1 baths 2 beds |
show details | |

|
#10
Vendell St
Buffalo, MN 55313
|
- sq. feet
|
2 baths 3 beds |
show details |
| Photo | Address | Area | Beds / Baths | Price | Details |
|---|---|---|---|---|---|

|
#11
Fairhill Dr SE
Buffalo, MN 55313
|
- sq. feet
|
1 baths 3 beds |
show details | |

|
#12
Hall Ave SE
Buffalo, MN 55313
|
- sq. feet
|
2 baths 3 beds |
show details | |

|
#13
Hawthorn Ave
Buffalo, MN 55313
|
- sq. feet
|
3 baths 4 beds |
show details | |

|
#14
Pulaski Rd
Buffalo, MN 55313
|
- sq. feet
|
3 baths 4 beds |
show details | |

|
#15
28th St SE
Buffalo, MN 55313
|
- sq. feet
|
3 baths 4 beds |
show details | |

|
#16
County Road 12 S
Buffalo, MN 55313
|
- sq. feet
|
- baths - beds |
show details | |

|
#17
14th St NE Apt 301
Buffalo, MN 55313
|
- sq. feet
|
- baths - beds |
show details | |

|
#18
3rd Ave NE
Buffalo, MN 55313
|
- sq. feet
|
- baths - beds |
show details | |

|
#19
Catlin St Apt 102
Buffalo, MN 55313
|
- sq. feet
|
- baths - beds |
show details | |

|
#20
Timber Ln
Buffalo, MN 55313
|
- sq. feet
|
- baths - beds |
show details |
| Photo | Address | Area | Beds / Baths | Price | Details |
|---|---|---|---|---|---|

|
#21
Hamlin Ave NE
Buffalo, MN 55313
|
- sq. feet
|
- baths - beds |
show details | |

|
#22
Falcon Trl
Buffalo, MN 55313
|
- sq. feet
|
- baths - beds |
show details | |

|
#23
3rd Ave NE Apt 115
Buffalo, MN 55313
|
- sq. feet
|
- baths - beds |
show details | |

|
#24
2nd St NE Apt 201
Buffalo, MN 55313
|
- sq. feet
|
- baths - beds |
show details | |

|
#25
Wilder Way
Buffalo, MN 55313
|
- sq. feet
|
- baths - beds |
show details | |

|
#26
Anderson Ave Apt 1
Buffalo, MN 55313
|
- sq. feet
|
- baths - beds |
show details | |

|
#27
Willow Glen Dr # 904
Buffalo, MN 55313
|
- sq. feet
|
- baths - beds |
show details | |

|
#28
80th St NW
Buffalo, MN 55313
|
- sq. feet
|
- baths - beds |
show details | |

|
#29
Buffalo Ridge Dr
Buffalo, MN 55313
|
- sq. feet
|
- baths - beds |
show details | |

|
#30
2nd Ave S Apt 8
Buffalo, MN 55313
|
- sq. feet
|
- baths - beds |
show details |
| Photo | Address | Area | Beds / Baths | Price | Details |
|---|---|---|---|---|---|

|
#31
Longhorn Ln
Buffalo, MN 55313
|
- sq. feet
|
- baths - beds |
show details | |

|
#32
Aster Ct
Buffalo, MN 55313
|
- sq. feet
|
- baths - beds |
show details | |

|
#33
Fir St W
Buffalo, MN 55313
|
- sq. feet
|
- baths - beds |
show details | |

|
#34
Coneflower Pt
Buffalo, MN 55313
|
- sq. feet
|
- baths - beds |
show details | |

|
#35
Elm St W
Buffalo, MN 55313
|
- sq. feet
|
- baths - beds |
show details | |

|
#36
Fir St W
Buffalo, MN 55313
|
- sq. feet
|
- baths - beds |
show details | |

|
Check over 1 million property listings on Foreclosure.com!
|
browse all offers | |||

Latest news about housing in Buffalo, MN collected exclusively by city-data.com from local newspapers, TV, and radio stations


Median year apartment built: 1988
Household type by relationship:
Households: 16,911- Male householders: 3,268 (776 living alone), Female householders: 3,193 (874 living alone)
3,510 spouses (3,479 opposite-sex spouses), 504 unmarried partners, (504 opposite-sex unmarried partners), 5,062 children (4,900 natural, 76 adopted, 85 stepchildren), 255 grandchildren, 31 brothers or sisters, 83 parents, 0 foster children, 172 other relatives, 385 non-relatives
- In group quarters: 444
Size of family households: 2,234 2-persons, 897 3-persons, 551 4-persons, 385 5-persons, 176 6-persons, 183 7-or-more-persons.
Size of nonfamily households: 1,933 1-person, 307 2-persons, 35 3-persons.
2,562 married couples with children.
1,107 single-parent households (514 men, 593 women).
94.6% of residents of Buffalo speak English at home.
1.1% of residents speak Spanish at home (51% speak English very well, 10% speak English well, 38% speak English not well).
2.3% of residents speak other Indo-European language at home (41% speak English very well, 29% speak English well, 30% speak English not well).
1.4% of residents speak Asian or Pacific Island language at home (73% speak English very well, 24% speak English well, 3% speak English not well).
0.2% of residents speak other language at home (100% speak English very well).
Foreign born population: 939 (5.6%)
(30.5% of them are naturalized citizens)
| Here: | 7.1 |
| State: | 7.1 |
| Here: | 4.2 |
| State: | 3.8 |

- Bedrooms in owner-occupied houses and condos in Buffalo, Minnesota
- 27no bedroom
- 711 bedroom
- 7402 bedrooms
- 1,9763 bedrooms
- 2,0234 bedrooms
- 2235+ bedrooms

- Bedrooms in renter-occupied apartments in Buffalo, Minnesota
- 74no bedroom
- 3771 bedroom
- 7702 bedrooms
- 2603 bedrooms
- 894 bedrooms
- 05+ bedrooms

- Cars and other vehicles available in Buffalo in owner-occupied houses/condos
- 124no vehicle
- 1,1701 vehicle
- 2,4642 vehicles
- 9323 vehicles
- 3054 vehicles
- 665+ vehicles

- Cars and other vehicles available in Buffalo in renter-occupied apartments
- 117no vehicle
- 8661 vehicle
- 4532 vehicles
- 1343 vehicles
- 04 vehicles
- 05+ vehicles

- Rooms in owner-occupied houses in Buffalo, Minnesota
- 271 room
- 92 rooms
- 473 rooms
- 3484 rooms
- 5645 rooms
- 1,0236 rooms
- 1,1367 rooms
- 7358 rooms
- 1,1739+ rooms

- Rooms in renter-occupied apartments in Buffalo, Minnesota
- 621 room
- 1512 rooms
- 3153 rooms
- 4614 rooms
- 2835 rooms
- 1646 rooms
- 427 rooms
- 658 rooms
- 279+ rooms


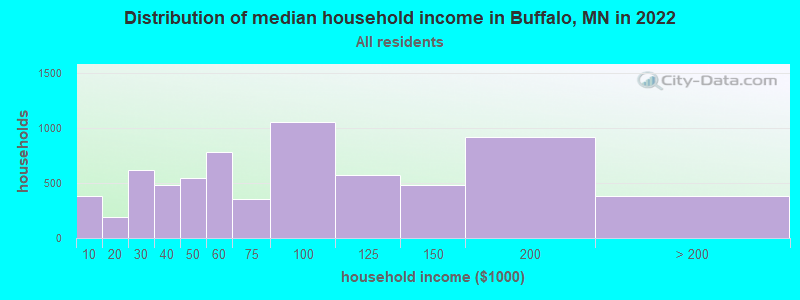
Buffalo, MN household income distribution

- 378Less than $10,000
- 195$10,000 to $19,999
- 617$20,000 to $29,999
- 482$30,000 to $39,999
- 547$40,000 to $49,999
- 785$50,000 to $59,999
- 357$60,000 to $74,999
- 1,056$75,000 to $99,999
- 570$100,000 to $124,999
- 478$125,000 to $149,999
- 921$150,000 to $199,999
- 382$200,000 or more
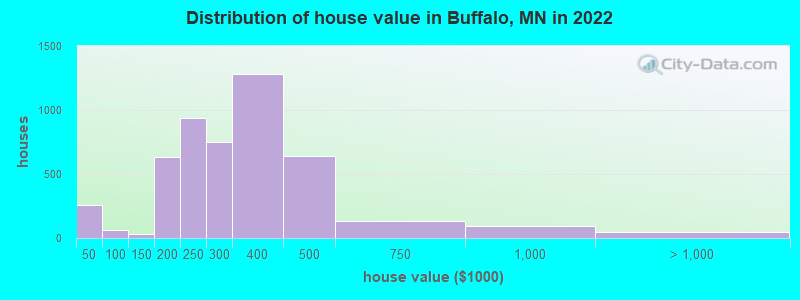
Home value of owner - occupied houses in 2022 in Buffalo, MN
-
- 52Less than $10,000
- 71$15,000 to $19,999
- 48$20,000 to $24,999
- 16$25,000 to $29,999
- 21$30,000 to $34,999
- 11$35,000 to $39,999
- 32$40,000 to $49,999
- 9$50,000 to $59,999
- 19$90,000 to $99,999
- 31$100,000 to $124,999
- 273$150,000 to $174,999
- 359$175,000 to $199,999
- 936$200,000 to $249,999
- 750$250,000 to $299,999
- 1,279$300,000 to $399,999
- 637$400,000 to $499,999
- 134$500,000 to $749,999
- 96$750,000 to $999,999
- 10$1,000,000 to $1,499,999
- 16$1,500,000 to $1,999,999
- 21$2,000,000 or more
Rent paid by renters in 2022 in Buffalo, MN
-
- 20$100 to $149
- 15$200 to $249
- 12$250 to $299
- 13$300 to $349
- 73$350 to $399
- 15$400 to $449
- 31$450 to $499
- 45$500 to $549
- 24$550 to $599
- 76$650 to $699
- 56$700 to $749
- 47$750 to $799
- 168$800 to $899
- 182$900 to $999
- 346$1,000 to $1,249
- 151$1,250 to $1,499
- 121$1,500 to $1,999
- 17$2,000 to $2,499
- 57$3,000 to $3,499
- 41No cash rent


Percentage of workers working in this county: 59.1%
Number of people working at home: 904 (10.8% of all workers)
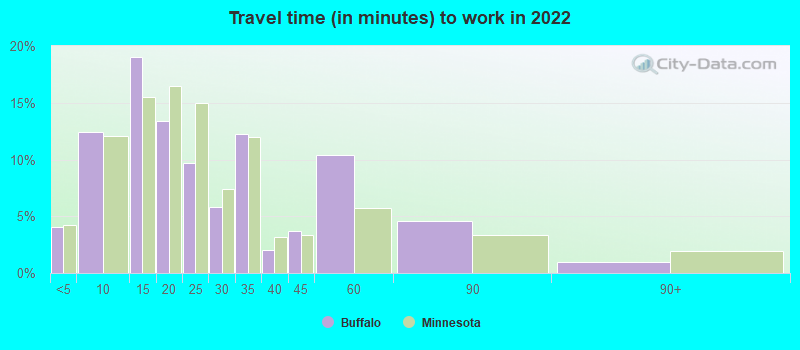
Travel time to work (commute)
- Less than 5 minutes: 305
- 5 to 9 minutes: 1,001
- 10 to 14 minutes: 1,060
- 15 to 19 minutes: 825
- 20 to 24 minutes: 479
- 25 to 29 minutes: 312
- 30 to 34 minutes: 874
- 35 to 39 minutes: 210
- 40 to 44 minutes: 581
- 45 to 59 minutes: 905
- 60 to 89 minutes: 689
- 90 or more minutes: 147
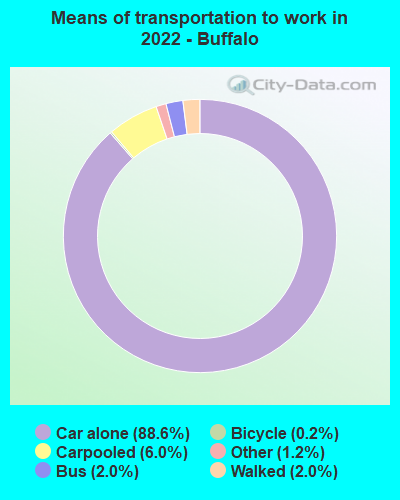
Means of transportation to work:
- Drove a car alone: 6,245 (77.6%)
- Carpooled: 433 (5.4%)
- Bus: 95 (1.2%)
- Taxi: 104 (1.3%)
- Bicycle: 12 (0.1%)
- Walked: 142 (1.8%)
- Worked at home: 904 (11.2%)

- Unemployment by race in 2022
- Unemployment rate for White non-Hispanic residents
- 5.4%Males
- 3.0%Females
- Unemployment rate for two or more race residents
- 10.6%Males

- Year of entry for the foreign-born population in Buffalo, Minnesota
- 4702010 or later
- 1862000 to 2009
- 1001990 to 1999
- 201980 to 1989
- 301970 to 1979
- 21Before 1970

First ancestries reported:
- German: 2,144 (30.6%)
- American: 1,493 (21.3%)
- Norwegian: 610 (8.7%)
- Finnish: 600 (8.6%)
- English: 408 (5.8%)
- European: 308 (4.4%)
- Irish: 217 (3.1%)
- Polish: 164 (2.3%)
- Russian: 135 (1.9%)
- Scandinavian: 113 (1.6%)
- Swedish: 97 (1.4%)
- French Canadian: 84 (1.2%)
- Czech: 47 (0.7%)
- Bulgarian: 36 (0.5%)
- Brazilian: 32 (0.5%)
- Austrian: 26 (0.4%)
- Greek: 19 (0.3%)
- British: 13 (0.2%)
- French: 12 (0.2%)
- Dutch: 10 (0.1%)
- Scotch-Irish: 10 (0.1%)
- Slovak: 4 (0.06%)
- Italian: 2 (0.03%)
Most common places of birth for foreign-born residents (%):
| Buffalo: | 30.1% (232) |
| Minnesota: | 1.4% (6,670) |
| Buffalo: | 18.5% (143) |
| Minnesota: | 1.3% (6,329) |
| Buffalo: | 14.6% (113) |
| Minnesota: | 2.0% (9,850) |
| Buffalo: | 6.3% (49) |
| Minnesota: | 12.1% (58,312) |
| Buffalo: | 4.9% (38) |
| Minnesota: | 2.4% (11,675) |
| Buffalo: | 4.3% (33) |
| Minnesota: | 0.6% (2,981) |
| Buffalo: | 3.2% (25) |
| Minnesota: | 0.2% (946) |
| Buffalo: | 2.2% (17) |
| Minnesota: | 0.1% (416) |
| Buffalo: | 2.2% (17) |
| Minnesota: | 3.3% (15,701) |
| Buffalo: | 2.2% (17) |
| Minnesota: | 2.5% (11,939) |
| Buffalo: | 1.6% (12) |
| Minnesota: | 3.8% (18,442) |
Place of birth for U.S.-born residents:
- This state: 13,651
- Other state: 2,355
- Northeast: 85
- Midwest: 1,465
- South: 512
- West: 313
90.9% of Buffalo residents lived in the same house 1 years ago.
Out of people who lived in different houses, 38.6% lived in this county.
Out of people who lived in different counties, 83.5% lived in Minnesota.
| Buffalo: | 90.9% |
| State average: | 87.4% |
Education attainment for males 25 years and older:
- No schooling: 111
- Nursery to 4th grade: 0
- 5th and 6th grade: 5
- 7th and 8th grade: 68
- 9th grade: 6
- 10th grade: 83
- 11th grade: 36
- 12th grade, no diploma: 1
- High school graduate (or equivalency): 1,727
- Less than 1 year of college: 368
- Some college more than 1 year, no degree: 1,072
- Associate degree: 564
- Bachelor's degree: 1,021
- Master's degree: 331
- Professional school degree: 50
- Doctorate degree: 194

Education attainment for females 25 years and older:
- No schooling: 77
- Nursery to 4th grade: 0
- 5th and 6th grade: 0
- 7th and 8th grade: 42
- 9th grade: 29
- 10th grade: 25
- 11th grade: 156
- 12th grade, no diploma: 16
- High school graduate (or equivalency): 1,321
- Less than 1 year of college: 549
- Some college more than 1 year, no degree: 895
- Associate degree: 840
- Bachelor's degree: 1,144
- Master's degree: 593
- Professional school degree: 75
- Doctorate degree: 0


Housing units in structures:
- One, detached: 4,566
- One, attached: 594
- Two: 169
- 3 or 4: 190
- 5 to 9: 234
- 10 to 19: 202
- 20 to 49: 411
- 50 or more: 78
- Mobile homes: 327
Median worth of mobile homes: $38,986
Housing units lacking complete kitchen facilities in 2022: 1.9%
House/condo owner moved in on average 8 years ago
Renter moved in on average 4 years ago

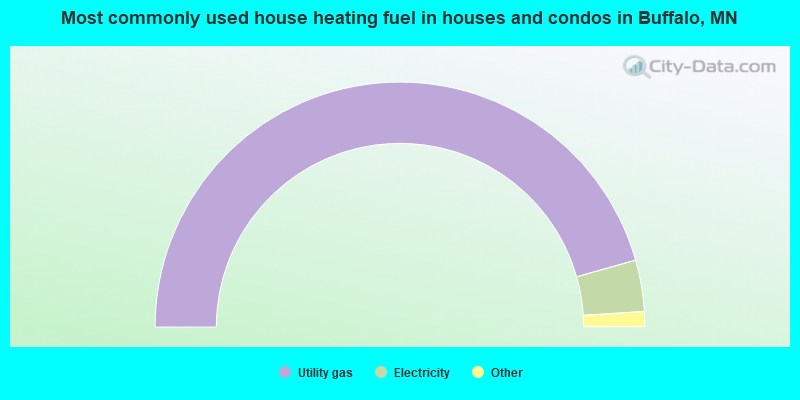
- 91.2%Utility gas
- 6.8%Electricity
- 0.8%Bottled, tank, or LP gas
- 0.5%No fuel used
- 0.5%Fuel oil, kerosene, etc.
- 0.2%Other fuel
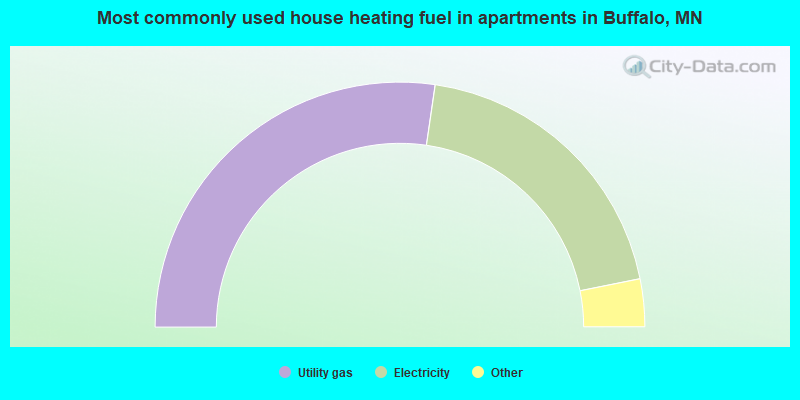
- 54.6%Utility gas
- 39.1%Electricity
- 2.8%Fuel oil, kerosene, etc.
- 2.3%Other fuel
- 1.2%Wood
Private vs. public school enrollment:
| Here: | 30.0% |
| Minnesota: | 12.9% |
| Here: | 0.8% |
| Minnesota: | 8.6% |
| Here: | 39.3% |
| Minnesota: | 26.2% |


