Broomall, PA (Pennsylvania) Houses and Residents
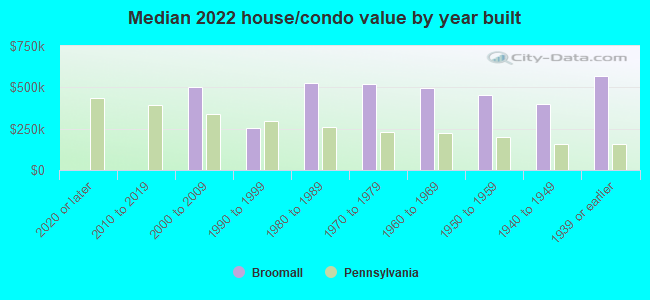
| Broomall: | $463,222 |
| Pennsylvania: | $245,500 |
Mean price in 2022:
Detached houses: $464,908
Here: $464,908 State: $317,202 Townhouses or other attached units: $391,447
Here: $391,447 State: $254,369 In 2-unit structures: $616,241
Here: $616,241 State: $249,182 In 3-to-4-unit structures: $263,120
Here: $263,120 State: $297,446 In 5-or-more-unit structures: $150,740
Here: $150,740 State: $320,068
Total population: 10,789 (All urban)
Houses: 4,053 (3,926 occupied: 3,135 owner occupied, 793 renter occupied)
| % of renters here: | 20% |
| State: | 31% |
Housing density: 1,397 houses/condos per square mile
Median price asked for vacant for-sale houses and condos in 2022 in this county: $246,679.
Median contract rent in 2022: $1,559 (lower quartile is $1,292, upper quartile is over $2,000)
Median rent asked for vacant for-rent units in 2022: $1,325
Median gross rent in Broomall, PA in 2022: $1,717
Housing units in Broomall with a mortgage: 1,950 (278 second mortgage, 0 home equity loan, 275 both second mortgage and home equity loan)
Houses without a mortgage: 121
Median household income for houses/condos with a mortgage: $149,735
Median household income for apartments without a mortgage: $92,678
Median monthly housing costs: $1,689
Compare current foreclosures near Broomall, PA:
| Photo | Address | Area | Beds / Baths | Price | Details |
|---|---|---|---|---|---|

|
#1
Cedar Grove Rd
Broomall, PA 19008
|
4,672 sq. feet
|
6 baths 5 beds |
show details | |

|
#2
2nd Ave
Broomall, PA 19008
|
1,188 sq. feet
|
2 baths 3 beds |
show details | |

|
#3
S Sproul Rd
Broomall, PA 19008
|
1,490 sq. feet
|
3 baths 4 beds |
show details | |

|
#4
Hillside Rd
Broomall, PA 19008
|
1,512 sq. feet
|
1 baths 3 beds |
show details | |

|
#5
Yale Ave
Broomall, PA 19008
|
1,234 sq. feet
|
2 baths 3 beds |
show details | |

|
#6
Lyndhurst Dr
Broomall, PA 19008
|
1,520 sq. feet
|
3 baths 3 beds |
show details | |

|
#7
Gabrielle Ct
Broomall, PA 19008
|
3,016 sq. feet
|
3 baths 4 beds |
show details | |

|
#8
N Central Blvd
Broomall, PA 19008
|
1,320 sq. feet
|
2 baths 3 beds |
show details | |

|
#9
Kerwood Dr
Broomall, PA 19008
|
2,825 sq. feet
|
3 baths 4 beds |
show details | |

|
#10
Pleasant Rd
Broomall, PA 19008
|
1,120 sq. feet
|
1 baths 2 beds |
show details |
| Photo | Address | Area | Beds / Baths | Price | Details |
|---|---|---|---|---|---|

|
#11
Warren Blvd
Broomall, PA 19008
|
- sq. feet
|
1 baths 3 beds |
show details | |

|
#12
Pennview Ave
Broomall, PA 19008
|
- sq. feet
|
1 baths 3 beds |
show details | |

|
#13
Eldon Dr
Broomall, PA 19008
|
- sq. feet
|
2 baths 3 beds |
show details | |

|
#14
Rutgers Dr
Broomall, PA 19008
|
- sq. feet
|
2 baths 4 beds |
show details | |

|
#15
1st Ave
Broomall, PA 19008
|
- sq. feet
|
1 baths 3 beds |
show details | |

|
#16
Summit Ave
Broomall, PA 19008
|
- sq. feet
|
1 baths 3 beds |
show details | |

|
#17
Ceton Ct
Broomall, PA 19008
|
- sq. feet
|
2 baths 3 beds |
show details | |

|
#18
S Park Way Apt 106l
Broomall, PA 19008
|
- sq. feet
|
- baths - beds |
show details | |

|
#19
Sproul Rd
Broomall, PA 19008
|
- sq. feet
|
- baths - beds |
show details | |

|
#20
N 59th St
Philadelphia, PA 19151
|
1,244 sq. feet
|
1 baths 3 beds |
$241,500
|
show details |
| Photo | Address | Area | Beds / Baths | Price | Details |
|---|---|---|---|---|---|

|
#21
N 5th St
Philadelphia, PA 19126
|
1,420 sq. feet
|
2 baths 3 beds |
$313,900
|
show details |

|
#22
Ashbourne Rd
Elkins Park, PA 19027
|
3,104 sq. feet
|
3 baths 6 beds |
$154,500
|
show details |

|
#23
W Oakdale Street
Philadelphia, PA 19132
|
1,152 sq. feet
|
2 baths 3 beds |
$108,900
|
show details |

|
#24
Yeadon Ave
Lansdowne, PA 19050
|
1,388 sq. feet
|
1 baths 3 beds |
$268,500
|
show details |

|
#25
Jessamine Ave
Oaklyn, NJ 08107
|
864 sq. feet
|
2 baths 5 beds |
$389,900
|
show details |

|
#26
S 8th St
Philadelphia, PA 19148
|
1,170 sq. feet
|
1 baths 3 beds |
$168,500
|
show details |

|
#27
Pershing Ave
Darby, PA 19023
|
1,179 sq. feet
|
1 baths 3 beds |
$309,900
|
show details |

|
#28
Christian St
Philadelphia, PA 19146
|
1,612 sq. feet
|
2 baths 5 beds |
$449,900
|
show details |

|
#29
Kershaw St
Philadelphia, PA 19131
|
1,284 sq. feet
|
1 baths 3 beds |
$134,500
|
show details |

|
#30
Browning Rd
Merchantville, NJ 08109
|
2,376 sq. feet
|
3 baths 5 beds |
$469,900
|
show details |
| Photo | Address | Area | Beds / Baths | Price | Details |
|---|---|---|---|---|---|

|
#31
Edgewood Ave
Audubon, NJ 08106
|
1,250 sq. feet
|
1 baths 4 beds |
$375,000
|
show details |

|
#32
Cooper St
Woodbury, NJ 08096
|
936 sq. feet
|
1 baths 3 beds |
$255,000
|
show details |

|
#33
N Front St Apt B
Philadelphia, PA 19123
|
2,491 sq. feet
|
2 baths 3 beds |
$659,500
|
show details |

|
#34
Manchester Rd
Elkins Park, PA 19027
|
3,444 sq. feet
|
2 baths 3 beds |
$548,900
|
show details |

|
#35
E Wishart St
Philadelphia, PA 19134
|
1,064 sq. feet
|
1 baths 3 beds |
$1,290,613
|
show details |

|
#36
Hopkinson Ct # 160
Wayne, PA 19087
|
1,656 sq. feet
|
2 baths 2 beds |
$214,896
|
show details |

|
#37
Stirling Ct
West Chester, PA 19380
|
1,050 sq. feet
|
1 baths 2 beds |
$30,983
|
show details |

|
#38
N Bambrey St
Philadelphia, PA 19121
|
964 sq. feet
|
1 baths 3 beds |
$107,333
|
show details |

|
#39
Windermere Ave
Drexel Hill, PA 19026
|
- sq. feet
|
2 baths 3 beds |
$218,400
|
show details |

|
#40
Richmond Rd
Paoli, PA 19301
|
1,706 sq. feet
|
2 baths 2 beds |
$179,198
|
show details |
| Photo | Address | Area | Beds / Baths | Price | Details |
|---|---|---|---|---|---|

|
#41
Richmond Rd
Paoli, PA 19301
|
1,215 sq. feet
|
1 baths 2 beds |
$263,438
|
show details |

|
#42
Gwynedd Ct
Exton, PA 19341
|
1,760 sq. feet
|
2 baths 3 beds |
$296,451
|
show details |

|
#43
New Market Ct
Wayne, PA 19087
|
1,080 sq. feet
|
1 baths 2 beds |
$98,656
|
show details |

|
#44
Pickering St
Philadelphia, PA 19150
|
1,170 sq. feet
|
1 baths 3 beds |
$169,900
|
show details |

|
#45
W Central Ave
Paoli, PA 19301
|
1,939 sq. feet
|
2 baths 4 beds |
$438,947
|
show details |

|
#46
Keenan St
Elkins Park, PA 19027
|
1,234 sq. feet
|
2 baths 2 beds |
$217,220
|
show details |

|
#47
Woodside Ave
Berwyn, PA 19312
|
2,080 sq. feet
|
2 baths 5 beds |
$525,082
|
show details |

|
#48
L Fleur
Devon, PA 19333
|
1,412 sq. feet
|
1 baths 2 beds |
$50,690
|
show details |

|
#49
Westtown Cir
West Chester, PA 19382
|
1,437 sq. feet
|
1 baths 1 beds |
$116,753
|
show details |

|
Check over 1 million property listings on Foreclosure.com!
|
browse all offers | |||

Latest news about housing in Broomall, PA collected exclusively by city-data.com from local newspapers, TV, and radio stations

 | Income-Based, 55+, Affordable Housing in/near Broomall? (0 replies) |
| Affordable apartments outside Philly, any suggestions? (0 replies) |
| Delaware County by Median Household Income... Interesting (17 replies) |
| Buying a house around the Philadelphia or King of Prussia area NEED HELP (25 replies) |
| My turn! Let the house hunt begin! (17 replies) |
| Culture of Delco (63 replies) |
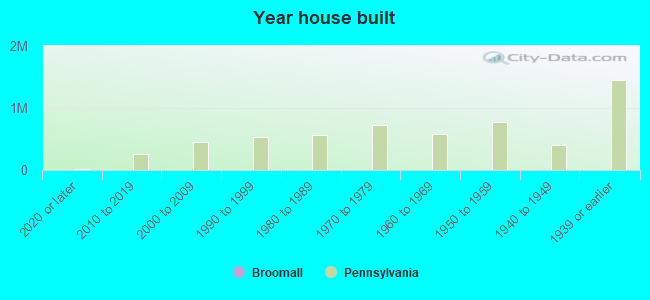
Median year apartment built: 1966
Household type by relationship:
Households: 10,660- Male householders: 2,025 (238 living alone), Female householders: 1,886 (547 living alone)
2,422 spouses (2,409 opposite-sex spouses), 186 unmarried partners, (186 opposite-sex unmarried partners), 3,413 children (3,287 natural, 31 adopted, 93 stepchildren), 314 grandchildren, 17 brothers or sisters, 134 parents, 0 foster children, 85 other relatives, 143 non-relatives
- In group quarters: 27
Size of family households: 1,252 2-persons, 730 3-persons, 524 4-persons, 312 5-persons, 63 6-persons, 24 7-or-more-persons.
Size of nonfamily households: 826 1-person, 178 2-persons.
1,683 married couples with children.
233 single-parent households (77 men, 156 women).
87.1% of residents of Broomall speak English at home.
0.2% of residents speak Spanish at home (45% speak English very well, 55% speak English well).
6.0% of residents speak other Indo-European language at home (78% speak English very well, 18% speak English well, 3% speak English not well).
7.2% of residents speak Asian or Pacific Island language at home (63% speak English very well, 11% speak English well, 23% speak English not well, 2% don't speak English at all).
0.4% of residents speak other language at home (53% speak English very well, 38% speak English well, 9% speak English not well).
Foreign born population: 943 (8.8%)
(77.2% of them are naturalized citizens)
| Here: | 7.3 |
| State: | 6.8 |
| Here: | 4.2 |
| State: | 4.3 |
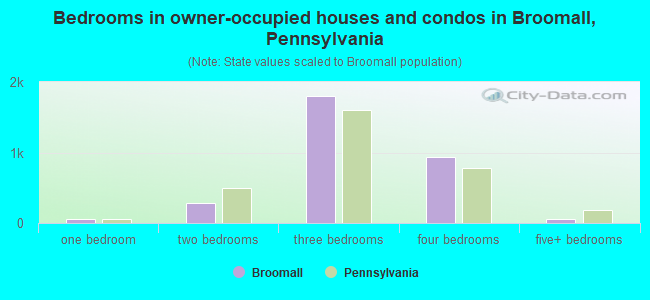
- Bedrooms in owner-occupied houses and condos in Broomall, Pennsylvania
- 0no bedroom
- 511 bedroom
- 2882 bedrooms
- 1,8013 bedrooms
- 9344 bedrooms
- 615+ bedrooms
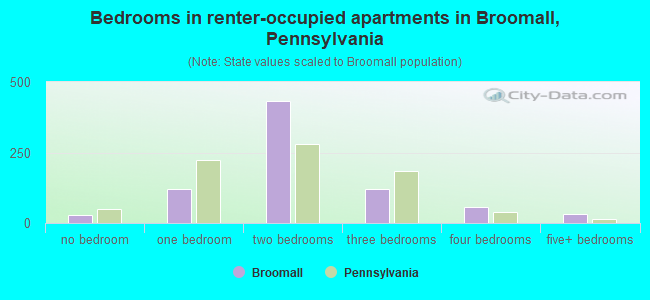
- Bedrooms in renter-occupied apartments in Broomall, Pennsylvania
- 30no bedroom
- 1211 bedroom
- 4312 bedrooms
- 1213 bedrooms
- 574 bedrooms
- 325+ bedrooms
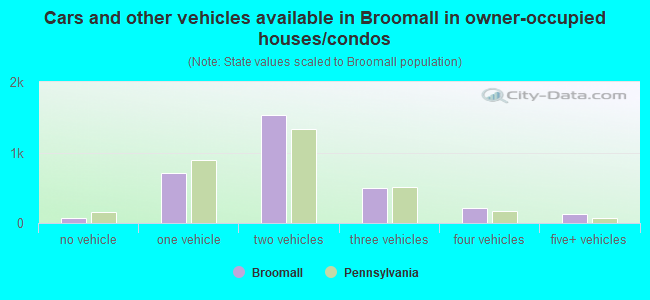
- Cars and other vehicles available in Broomall in owner-occupied houses/condos
- 71no vehicle
- 7151 vehicle
- 1,5252 vehicles
- 4943 vehicles
- 2064 vehicles
- 1245+ vehicles
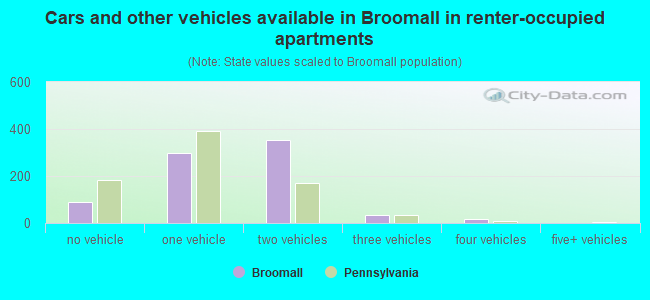
- Cars and other vehicles available in Broomall in renter-occupied apartments
- 89no vehicle
- 2971 vehicle
- 3552 vehicles
- 343 vehicles
- 174 vehicles
- 05+ vehicles
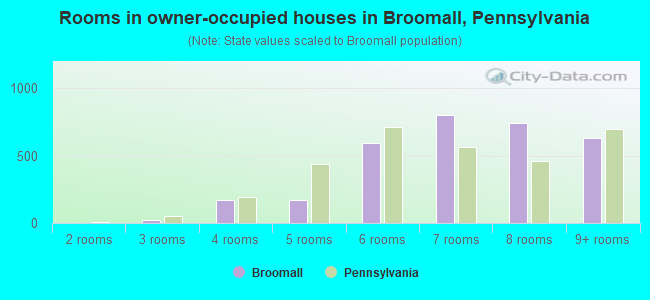
- Rooms in owner-occupied houses in Broomall, Pennsylvania
- 01 room
- 02 rooms
- 243 rooms
- 1694 rooms
- 1735 rooms
- 5966 rooms
- 8017 rooms
- 7448 rooms
- 6289+ rooms
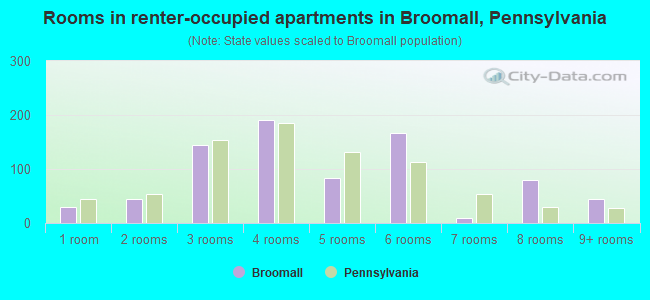
- Rooms in renter-occupied apartments in Broomall, Pennsylvania
- 301 room
- 442 rooms
- 1443 rooms
- 1914 rooms
- 835 rooms
- 1666 rooms
- 107 rooms
- 808 rooms
- 459+ rooms
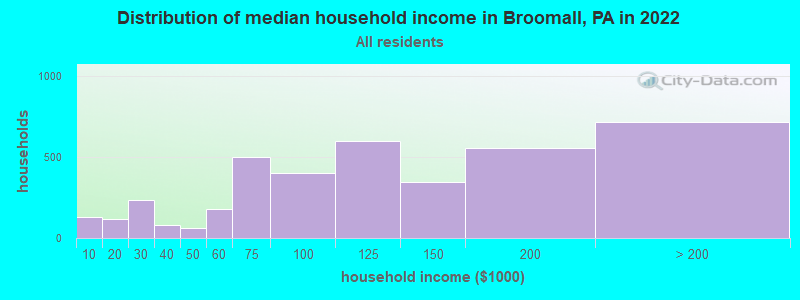
Broomall, PA household income distribution

- 132Less than $10,000
- 119$10,000 to $19,999
- 237$20,000 to $29,999
- 81$30,000 to $39,999
- 62$40,000 to $49,999
- 180$50,000 to $59,999
- 501$60,000 to $74,999
- 401$75,000 to $99,999
- 598$100,000 to $124,999
- 344$125,000 to $149,999
- 555$150,000 to $199,999
- 718$200,000 or more
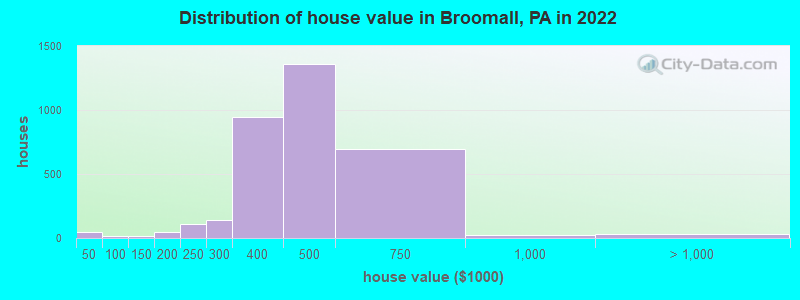
Home value of owner - occupied houses in 2022 in Broomall, PA
-
- 8Less than $10,000
- 28$25,000 to $29,999
- 13$40,000 to $49,999
- 12$100,000 to $124,999
- 4$125,000 to $149,999
- 10$150,000 to $174,999
- 37$175,000 to $199,999
- 108$200,000 to $249,999
- 138$250,000 to $299,999
- 944$300,000 to $399,999
- 1,361$400,000 to $499,999
- 696$500,000 to $749,999
- 21$750,000 to $999,999
- 33$2,000,000 or more
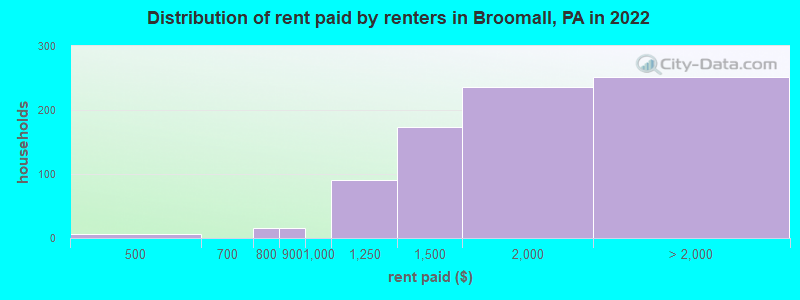
Rent paid by renters in 2022 in Broomall, PA
-
- 6$450 to $499
- 16$700 to $749
- 16$800 to $899
- 90$1,000 to $1,249
- 174$1,250 to $1,499
- 236$1,500 to $1,999
- 214$2,000 to $2,499
- 7$2,500 to $2,999
- 29No cash rent
Percentage of workers working in this county: 55.9%
Number of people working at home: 853 (15.1% of all workers)
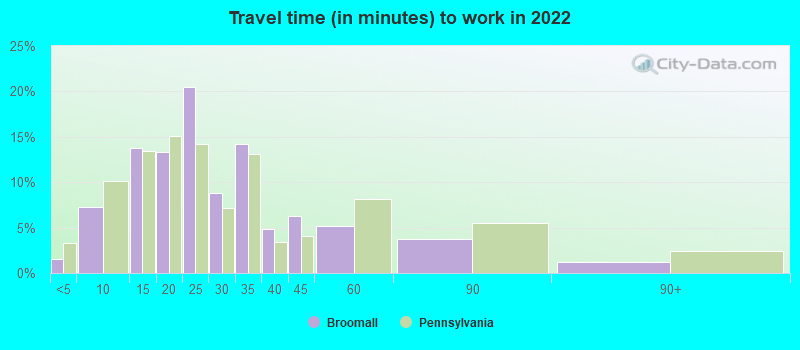
Travel time to work (commute)
- Less than 5 minutes: 54
- 5 to 9 minutes: 390
- 10 to 14 minutes: 600
- 15 to 19 minutes: 727
- 20 to 24 minutes: 650
- 25 to 29 minutes: 410
- 30 to 34 minutes: 842
- 35 to 39 minutes: 131
- 40 to 44 minutes: 234
- 45 to 59 minutes: 341
- 60 to 89 minutes: 343
- 90 or more minutes: 110
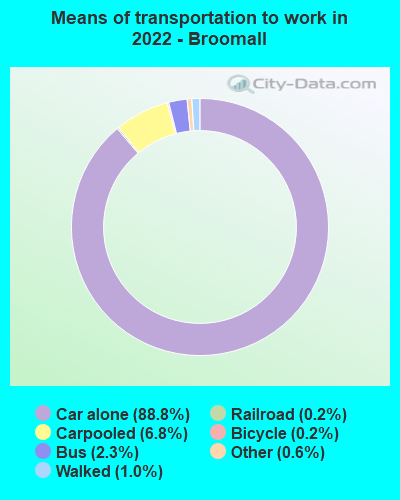
Means of transportation to work:
- Drove a car alone: 5,006 (76.1%)
- Carpooled: 357 (5.4%)
- Bus: 77 (1.2%)
- Light rail, streetcar or trolley: 14 (0.2%)
- Taxi: 59 (0.9%)
- Bicycle: 13 (0.2%)
- Walked: 67 (1.0%)
- Worked at home: 853 (13.0%)
- Unemployment by race in 2022
- Unemployment rate for White non-Hispanic residents
- 1.9%Males
- 1.3%Females
- Unemployment rate for Black residents
- 15.6%Males
- 17.7%Females
- Unemployment rate for Asian residents
- 1.8%Males
- 2.7%Females
- Unemployment rate for other race residents
- 10.1%Males
- Unemployment rate for two or more race residents
- 28.2%Males
- 39.8%Females
- Unemployment rate for Hispanic or Latino residents
- 4.0%Males
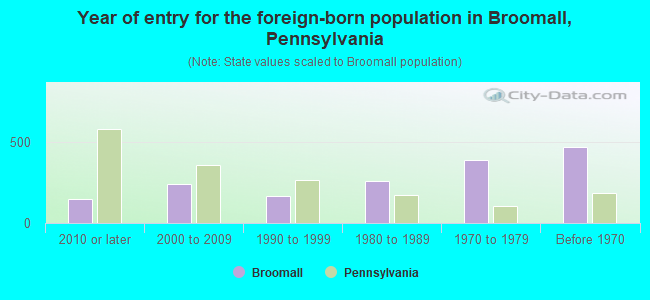
- Year of entry for the foreign-born population in Broomall, Pennsylvania
- 1482010 or later
- 2392000 to 2009
- 1641990 to 1999
- 2611980 to 1989
- 3881970 to 1979
- 468Before 1970
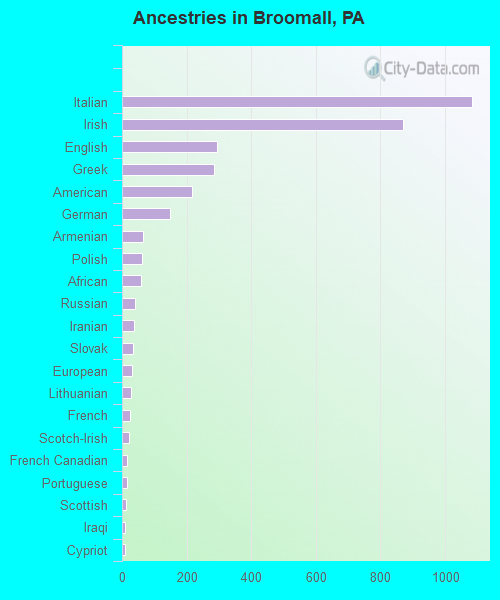
First ancestries reported:
- Italian: 1,082 (25.5%)
- Irish: 871 (20.5%)
- English: 294 (6.9%)
- Greek: 286 (6.7%)
- American: 216 (5.1%)
- German: 149 (3.5%)
- Armenian: 64 (1.5%)
- Polish: 63 (1.5%)
- African: 59 (1.4%)
- Russian: 41 (1.0%)
- Iranian: 37 (0.9%)
- Slovak: 35 (0.8%)
- European: 30 (0.7%)
- Lithuanian: 28 (0.7%)
- French: 26 (0.6%)
- Scotch-Irish: 22 (0.5%)
- French Canadian: 14 (0.3%)
- Portuguese: 14 (0.3%)
- Scottish: 11 (0.3%)
- Iraqi: 10 (0.2%)
- Cypriot: 10 (0.2%)
- Welsh: 9 (0.2%)
- Northern European: 8 (0.2%)
- Ukrainian: 8 (0.2%)
- Croatian: 7 (0.2%)
- Dutch: 6 (0.1%)
- Swedish: 3 (0.07%)
- Lebanese: 1 (0.02%)
Most common places of birth for foreign-born residents (%):
| Broomall: | 20.4% (215) |
| Pennsylvania: | 2.9% (27,433) |
| Broomall: | 15.7% (165) |
| Pennsylvania: | 7.2% (67,704) |
| Broomall: | 11.8% (124) |
| Pennsylvania: | 10.7% (100,596) |
| Broomall: | 9.6% (101) |
| Pennsylvania: | 3.3% (31,542) |
| Broomall: | 6.7% (70) |
| Pennsylvania: | 0.4% (4,198) |
| Broomall: | 4.0% (42) |
| Pennsylvania: | 0.4% (4,204) |
| Broomall: | 4.0% (42) |
| Pennsylvania: | 1.8% (16,884) |
| Broomall: | 3.4% (36) |
| Pennsylvania: | 0.6% (5,438) |
| Broomall: | 3.1% (33) |
| Pennsylvania: | 1.1% (10,331) |
| Broomall: | 2.7% (28) |
| Pennsylvania: | 1.4% (13,077) |
| Broomall: | 2.5% (26) |
| Pennsylvania: | 0.3% (2,395) |
| Broomall: | 1.8% (19) |
| Pennsylvania: | 0.0% (167) |
| Broomall: | 1.8% (19) |
| Pennsylvania: | 0.1% (826) |
Place of birth for U.S.-born residents:
- This state: 8,326
- Other state: 1,264
- Northeast: 548
- Midwest: 221
- South: 340
- West: 154
91.0% of Broomall residents lived in the same house 1 years ago.
Out of people who lived in different houses, 39.0% lived in this county.
Out of people who lived in different counties, 75.3% lived in Pennsylvania.
| Broomall: | 91.0% |
| State average: | 89.3% |
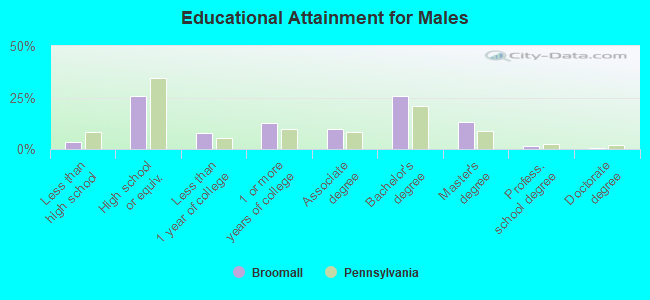
Education attainment for males 25 years and older:
- No schooling: 37
- Nursery to 4th grade: 8
- 5th and 6th grade: 1
- 7th and 8th grade: 0
- 9th grade: 53
- 10th grade: 10
- 11th grade: 0
- 12th grade, no diploma: 6
- High school graduate (or equivalency): 917
- Less than 1 year of college: 286
- Some college more than 1 year, no degree: 457
- Associate degree: 348
- Bachelor's degree: 926
- Master's degree: 473
- Professional school degree: 56
- Doctorate degree: 20
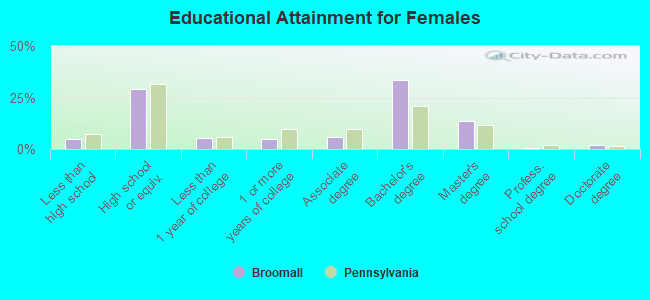
Education attainment for females 25 years and older:
- No schooling: 9
- Nursery to 4th grade: 13
- 5th and 6th grade: 41
- 7th and 8th grade: 24
- 9th grade: 17
- 10th grade: 39
- 11th grade: 7
- 12th grade, no diploma: 51
- High school graduate (or equivalency): 1,168
- Less than 1 year of college: 214
- Some college more than 1 year, no degree: 199
- Associate degree: 236
- Bachelor's degree: 1,359
- Master's degree: 550
- Professional school degree: 28
- Doctorate degree: 88
Housing units in structures:
- One, detached: 3,208
- One, attached: 71
- Two: 138
- 3 or 4: 218
- 10 to 19: 56
- 20 to 49: 205
- 50 or more: 114
- Mobile homes: 40
Housing units lacking complete kitchen facilities in 2022: 1.8%
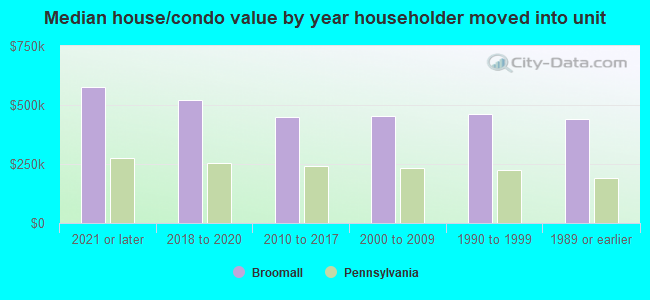
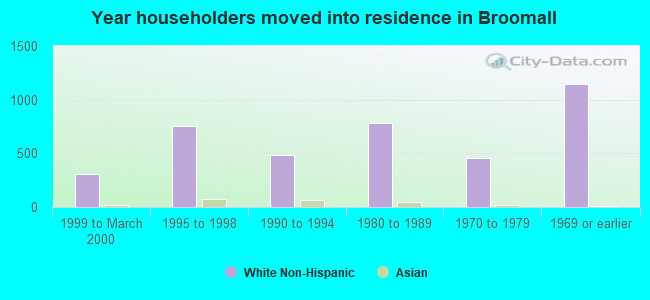
House/condo owner moved in on average 19 years ago
Renter moved in on average 3 years ago
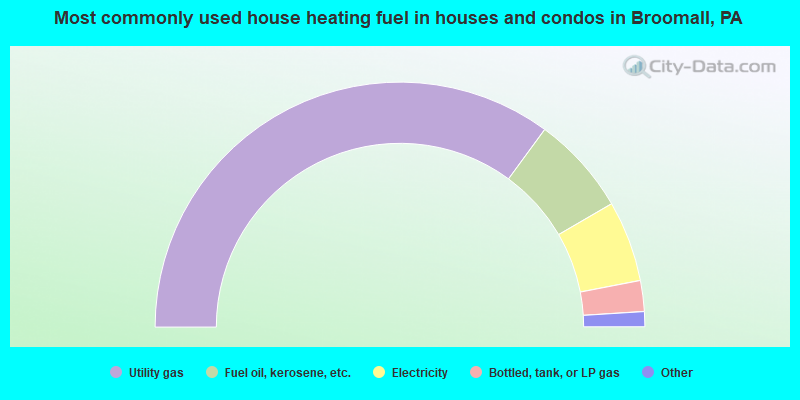
- 70.2%Utility gas
- 13.1%Fuel oil, kerosene, etc.
- 10.7%Electricity
- 4.1%Bottled, tank, or LP gas
- 1.3%No fuel used
- 0.4%Wood
- 0.3%Other fuel
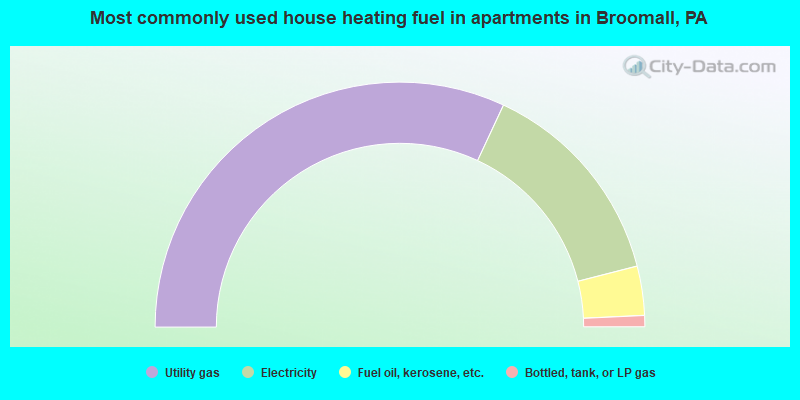
- 63.9%Utility gas
- 28.1%Electricity
- 6.5%Fuel oil, kerosene, etc.
- 1.5%Bottled, tank, or LP gas
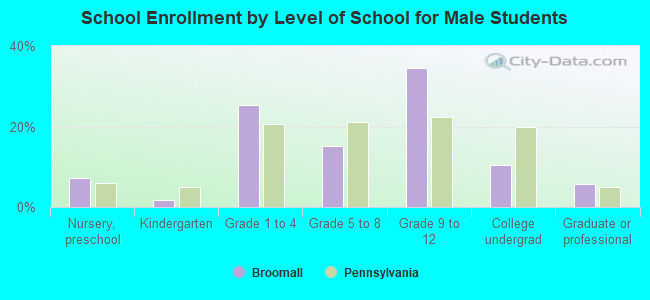
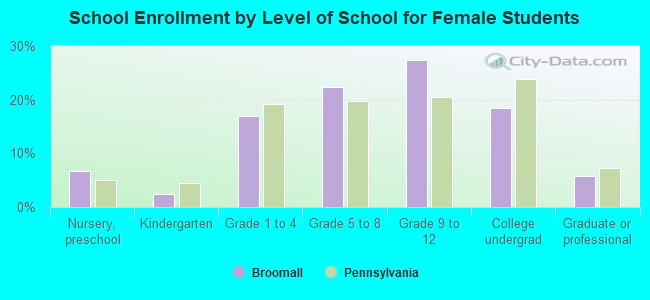
Private vs. public school enrollment:
| Here: | 17.3% |
| Pennsylvania: | 15.7% |
| Here: | 10.1% |
| Pennsylvania: | 13.4% |
| Here: | 26.3% |
| Pennsylvania: | 39.8% |