Blue Ash, OH (Ohio) Houses and Residents
Estimated median house or condo value in 2022: $396,850 (it was $149,000 in 2000 )
Blue Ash:
$396,850Ohio:
$204,100
Lower value quartile - upper value quartile: $278,156 - $545,731Mean price in 2022: Detached houses: $390,873 Here:
$390,873State:
$254,366
Townhouses or other attached units: $295,536 Here:
$295,536State:
$225,733
In 5-or-more-unit structures: $236,649 Here:
$236,649State:
$211,593
Total population: 12,149 (All urban)
Houses: 6,184 (5,777 occupied: 3,897 owner occupied, 1,968 renter occupied )
% of renters here:
34%State:
33%
Housing density: 808 houses/condos per square mile
Median price asked for vacant for-sale houses and condos in 2022: $133,332.
Median contract rent in 2022: $1,419 (lower quartile is $1,210, upper quartile is $1,829)
Median rent asked for vacant for-rent units in 2022: $1,403
Median gross rent in Blue Ash, OH in 2022: $1,505
Housing units in Blue Ash with a mortgage: 2,354 (181 second mortgage, 0 home equity loan, 183 both second mortgage and home equity loan )Houses without a mortgage: 119
Median household income for houses/condos with a mortgage: $138,439
Median household income for apartments without a mortgage: $96,086
Median monthly housing costs: $1,455
Data:
Median house or condo value ($)
Median house or condo value ($ change since 2000)
Median house or condo value ($) - White
Median house or condo value ($) - Black or African American
Median house or condo value ($) - Asian
Median house or condo value ($) - Hispanic or Latino
Median house or condo value ($) - American Indian and Alaska Native
Median house or condo value ($) - Multirace
Median house or condo value ($) - Other Race
Median price asked for mobile homes ($)
Household density (households per square mile)
Mean house or condo value by units in structure - 1, detached ($)
Mean house or condo value by units in structure - 1, attached ($)
Mean house or condo value by units in structure - 2 ($)
Mean house or condo value by units in structure by units in structure - 3 or 4 ($)
Mean house or condo value by units in structure - 5 or more ($)
Mean house or condo value by units in structure - Boat, RV, van, etc. ($)
Mean house or condo value by units in structure - Mobile home ($)
Median contract rent ($)
Median contract rent - Lower quartile ($)
Median contract rent - Upper quartile ($)
Median gross rent ($)
Urban houses (%)
Rural houses (%)
Houses occupied (%)
Houses occupied (% change since 2000)
Houses owner occupied (%)
Houses owner occupied (% change since 2000)
Houses renter occupied (%)
Houses renter occupied (% change since 2000)
Vacant housing units - For rent (%)
Vacant housing units - For rent (% change since 2000)
Vacant housing units - For sale only (%)
Vacant housing units - For sale only (% change since 2000)
Vacant housing units - Rented or sold, not occupied (%)
Vacant housing units - Rented or sold, not occupied (% change since 2000)
Vacant housing units - For seasonal, recreational, or occasional use (%)
Vacant housing units - For seasonal, recreational, or occasional use (% change since 2000)
Vacant housing units - For migrant workers (%)
Vacant housing units - For migrant workers (% change since 2000)
Vacant housing units - Other vacant (%)
Vacant housing units - Other vacant (% change since 2000)
Median monthly housing costs ($)
Median household income for houses/condos with a mortgage ($)
Median household income for houses/condos without a mortgage ($)
Median household income ($)
Median household income ($) - White
Median household income ($) - Black or African American
Median household income ($) - Asian
Median household income ($) - Hispanic or Latino
Median household income ($) - American Indian and Alaska Native
Median household income ($) - Multirace
Median household income ($) - Other Race
Mortgage status - with mortgage (%)
Mortgage status - with second mortgage (%)
Mortgage status - with home equity loan (%)
Mortgage status - with both second mortgage and home equity loan (%)
Mortgage status - without a mortgage (%)
Median year house/condo built
Median year apartment built
Household type by relationship - Male householder living alone (%)
Household type by relationship - Male householder not living alone (%)
Household type by relationship - Female householder living alone (%)
Household type by relationship - Female householder not living alone (%)
Household type by relationship - Opposite-Sex spouse (%)
Household type by relationship - Same-Sex spouse (%)
Household type by relationship - Opposite-Sex unmarried partner (%)
Household type by relationship - Same-Sex unmarried partner (%)
Household type by relationship - In group quarters (%)
Size of family households - 2-person household (%)
Size of family households - 3-person household (%)
Size of family households - 4-person household (%)
Size of family households - 5-person household (%)
Size of family households - 6-person household (%)
Size of family households - 7-or-more-person household (%)
Size of nonfamily households - 1-person household (%)
Size of nonfamily households - 2-person household (%)
Size of nonfamily households - 3-person household (%)
Size of nonfamily households - 4-person household (%)
Size of nonfamily households - 5-person household (%)
Size of nonfamily households - 6-person household (%)
Size of nonfamily households - 7-or-moreperson household (%)
Year house built - Built 2010 or later (%)
Year house built - Built 2000 to 2009 (%)
Year house built - Built 1990 to 1999 (%)
Year house built - Built 1980 to 1989 (%)
Year house built - Built 1970 to 1979 (%)
Year house built - Built 1960 to 1969 (%)
Year house built - Built 1950 to 1959 (%)
Year house built - Built 1940 to 1949 (%)
Year house built - Built 1939 or earlier (%)
Median number of rooms in houses and condos
Median number of rooms in apartments
Median number of bedrooms in owner occupied houses
Mean number of bedrooms in owner occupied houses
Median number of bedrooms in renter occupied houses
Mean number of bedrooms in renter occupied houses
Median number of vehichles in owner occupied houses
Mean number of vehichles in owner occupied houses
Median number of vehichles in renter occupied houses
Mean number of vehichles in renter occupied houses
Rooms in owner-occupied houses - 1 room (%)
Rooms in owner-occupied houses - 2 rooms (%)
Rooms in owner-occupied houses - 3 rooms (%)
Rooms in owner-occupied houses - 4 rooms (%)
Rooms in owner-occupied houses - 5 rooms (%)
Rooms in owner-occupied houses - 6 rooms (%)
Rooms in owner-occupied houses - 7 rooms (%)
Rooms in owner-occupied houses - 8 rooms (%)
Rooms in owner-occupied houses - 9+ rooms (%)
Rooms in renter-occupied houses - 1 room (%)
Rooms in renter-occupied houses - 2 rooms (%)
Rooms in renter-occupied houses - 3 rooms (%)
Rooms in renter-occupied houses - 4 rooms (%)
Rooms in renter-occupied houses - 5 rooms (%)
Rooms in renter-occupied houses - 6 rooms (%)
Rooms in renter-occupied houses - 7 rooms (%)
Rooms in renter-occupied houses - 8 rooms (%)
Rooms in renter-occupied houses - 9+ rooms (%)
Bedrooms in owner-occupied houses - no bedrooms (%)
Bedrooms in owner-occupied houses - 1 bedroom (%)
Bedrooms in owner-occupied houses - 2 bedrooms (%)
Bedrooms in owner-occupied houses - 3 bedrooms (%)
Bedrooms in owner-occupied houses - 4 bedrooms (%)
Bedrooms in owner-occupied houses - 5+ bedrooms (%)
Bedrooms in renter-occupied houses - no bedrooms (%)
Bedrooms in renter-occupied houses - 1 bedroom (%)
Bedrooms in renter-occupied houses - 2 bedrooms (%)
Bedrooms in renter-occupied houses - 3 bedrooms (%)
Bedrooms in renter-occupied houses - 4 bedrooms (%)
Bedrooms in renter-occupied houses - 5+ bedrooms (%)
Vehicles available in owner-occupied houses - no vehicle available (%)
Vehicles available in owner-occupied houses - 1 vehicle available(%)
Vehicles available in owner-occupied houses - 2 Vehicles available (%)
Vehicles available in owner-occupied houses - 3 Vehicles available (%)
Vehicles available in owner-occupied houses - 4 Vehicles available (%)
Vehicles available in owner-occupied houses - 5+ Vehicles available (%)
Vehicles available in renter-occupied houses - no vehicle available (%)
Vehicles available in renter-occupied houses - 1 vehicle available (%)
Vehicles available in renter-occupied houses - 2 Vehicles available (%)
Vehicles available in renter-occupied houses - 3 Vehicles available (%)
Vehicles available in renter-occupied houses - 4 Vehicles available (%)
Vehicles available in renter-occupied houses - 5+ Vehicles available (%)
Housing units in structures - 1, detached (%)
Housing units in structures - 1, attached (%)
Housing units in structures - 2 (%)
Housing units in structures - 3 or 4 (%)
Housing units in structures - 5 to 9 (%)
Housing units in structures - 10 to 19 (%)
Housing units in structures - 20 to 49 (%)
Housing units in structures - 50 or more (%)
Housing units in structures - Mobile home (%)
Housing units in structures - Boat, RV, van, etc. (%)
Housing units in structures - Owners - 1, detached (%)
Housing units in structures - Owners - 1, attached (%)
Housing units in structures - Owners - 2 (%)
Housing units in structures - Owners - 3 or 4 (%)
Housing units in structures - Owners - 5 to 9 (%)
Housing units in structures - Owners - 10 to 19 (%)
Housing units in structures - Owners - 20 to 49 (%)
Housing units in structures - Owners - 50 or more (%)
Housing units in structures - Owners - Mobile home (%)
Housing units in structures - Owners - Boat, RV, van, etc. (%)
Housing units in structures - Renters - 1, detached (%)
Housing units in structures - Renters - 1, attached (%)
Housing units in structures - Renters - 2 (%)
Housing units in structures - Renters - 3 or 4 (%)
Housing units in structures - Renters - 5 to 9 (%)
Housing units in structures - Renters - 10 to 19 (%)
Housing units in structures - Renters - 20 to 49 (%)
Housing units in structures - Renters - 50 or more (%)
Housing units in structures - Renters - Mobile home (%)
Housing units in structures - Renters - Boat, RV, van, etc. (%)
House/condo owner moved in on average (years ago)
Renter moved in on average (years ago)
Year householder moved into unit - Moved in 1999 to March 2000 (%)
Year householder moved into unit - Moved in 1999 to March 2000 (%) - White
Year householder moved into unit - Moved in 1999 to March 2000 (%) - Black or African American
Year householder moved into unit - Moved in 1999 to March 2000 (%) - Asian
Year householder moved into unit - Moved in 1999 to March 2000 (%) - Hispanic or Latino
Year householder moved into unit - Moved in 1999 to March 2000 (%) - American Indian and Alaska Native
Year householder moved into unit - Moved in 1999 to March 2000 (%) - Multirace
Year householder moved into unit - Moved in 1999 to March 2000 (%) - Other Race
Year householder moved into unit - Moved in 1995 to 1998 (%)
Year householder moved into unit - Moved in 1995 to 1998 (%) - White
Year householder moved into unit - Moved in 1995 to 1998 (%) - Black or African American
Year householder moved into unit - Moved in 1995 to 1998 (%) - Asian
Year householder moved into unit - Moved in 1995 to 1998 (%) - Hispanic or Latino
Year householder moved into unit - Moved in 1995 to 1998 (%) - American Indian and Alaska Native
Year householder moved into unit - Moved in 1995 to 1998 (%) - Multirace
Year householder moved into unit - Moved in 1995 to 1998 (%) - Other Race
Year householder moved into unit - Moved in 1990 to 1994 (%)
Year householder moved into unit - Moved in 1990 to 1994 (%) - White
Year householder moved into unit - Moved in 1990 to 1994 (%) - Black or African American
Year householder moved into unit - Moved in 1990 to 1994 (%) - Asian
Year householder moved into unit - Moved in 1990 to 1994 (%) - Hispanic or Latino
Year householder moved into unit - Moved in 1990 to 1994 (%) - American Indian and Alaska Native
Year householder moved into unit - Moved in 1990 to 1994 (%) - Multirace
Year householder moved into unit - Moved in 1990 to 1994 (%) - Other Race
Year householder moved into unit - Moved in 1980 to 1989 (%)
Year householder moved into unit - Moved in 1980 to 1989 (%) - White
Year householder moved into unit - Moved in 1980 to 1989 (%) - Black or African American
Year householder moved into unit - Moved in 1980 to 1989 (%) - Asian
Year householder moved into unit - Moved in 1980 to 1989 (%) - Hispanic or Latino
Year householder moved into unit - Moved in 1980 to 1989 (%) - American Indian and Alaska Native
Year householder moved into unit - Moved in 1980 to 1989 (%) - Multirace
Year householder moved into unit - Moved in 1980 to 1989 (%) - Other Race
Year householder moved into unit - Moved in 1970 to 1979 (%)
Year householder moved into unit - Moved in 1970 to 1979 (%) - White
Year householder moved into unit - Moved in 1970 to 1979 (%) - Black or African American
Year householder moved into unit - Moved in 1970 to 1979 (%) - Asian
Year householder moved into unit - Moved in 1970 to 1979 (%) - Hispanic or Latino
Year householder moved into unit - Moved in 1970 to 1979 (%) - American Indian and Alaska Native
Year householder moved into unit - Moved in 1970 to 1979 (%) - Multirace
Year householder moved into unit - Moved in 1970 to 1979 (%) - Other Race
Year householder moved into unit - Moved in 1969 or earlier (%)
Year householder moved into unit - Moved in 1969 or earlier (%) - White
Year householder moved into unit - Moved in 1969 or earlier (%) - Black or African American
Year householder moved into unit - Moved in 1969 or earlier (%) - Asian
Year householder moved into unit - Moved in 1969 or earlier (%) - Hispanic or Latino
Year householder moved into unit - Moved in 1969 or earlier (%) - American Indian and Alaska Native
Year householder moved into unit - Moved in 1969 or earlier (%) - Multirace
Year householder moved into unit - Moved in 1969 or earlier (%) - Other Race
Housing units lacking complete plumbing facilities (%)
Housing units lacking complete kitchen facilities (%)
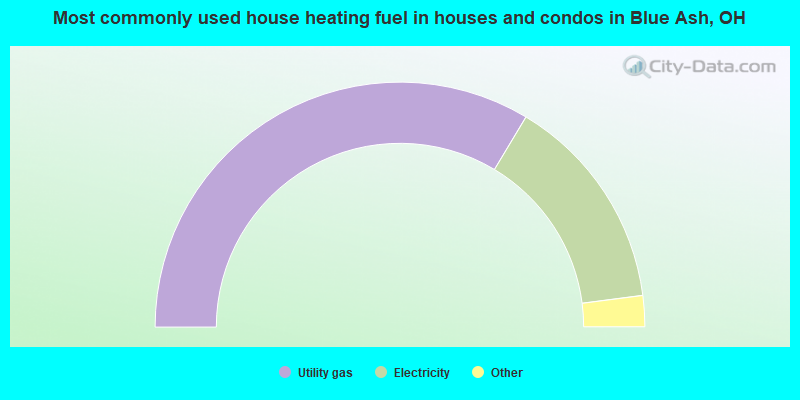
House heating fuel used in houses and condos - Utility gas (%)
House heating fuel used in houses and condos - Bottled, tank, or LP gas (%)
House heating fuel used in houses and condos - Electricity (%)
House heating fuel used in houses and condos - Fuel oil, kerosene, etc. (%)
House heating fuel used in houses and condos - Coal or coke (%)
House heating fuel used in houses and condos - Wood (%)
House heating fuel used in houses and condos - Solar energy (%)
House heating fuel used in houses and condos - Other fuel (%)
House heating fuel used in houses and condos - No fuel used (%)
House heating fuel used in apartments - Utility gas (%)
House heating fuel used in apartments - Bottled, tank, or LP gas (%)
House heating fuel used in apartments - Electricity (%)
House heating fuel used in apartments - Fuel oil, kerosene, etc. (%)
House heating fuel used in apartments - Coal or coke (%)
House heating fuel used in apartments - Wood (%)
House heating fuel used in apartments - Solar energy (%)
House heating fuel used in apartments - Other fuel (%)
House heating fuel used in apartments - No fuel used (%)
Median year house/condo built: 1980Median year apartment built: 1988Household type by relationship:
Households: 13,282
Male householders: 3,178 (431 living alone ), Female householders: 2,548 (921 living alone )2,963 spouses (2,953 opposite-sex spouses ), 431 unmarried partners , (405 opposite-sex unmarried partners ), 3,511 children (3,356 natural , 73 adopted , 81 stepchildren ), 17 grandchildren , 11 brothers or sisters , 221 parents , 1 foster children , 64 other relatives , 232 non-relatives In group quarters: 97
Size of family households: 1,958 2-persons , 943 3-persons , 724 4-persons , 226 5-persons , 80 6-persons .
Size of nonfamily households: 1,346 1-person , 599 2-persons , 20 3-persons , 8 4-persons .
2,404 married couples with children. single-parent households (225 men , 320 women ).
86.1% of residents of Blue Ash speak English at home. of residents speak Spanish at home (100% speak English very well ).of residents speak other Indo-European language at home (65% speak English very well , 34% speak English well , 1% speak English not well ).of residents speak Asian or Pacific Island language at home (72% speak English very well , 9% speak English well , 10% speak English not well , 9% don't speak English at all ).of residents speak other language at home (93% speak English very well , 7% speak English well ).
Foreign born population: 1,840 (13.9%)of them are naturalized citizens )
Median number of rooms in houses and condos:
Median number of rooms in apartments
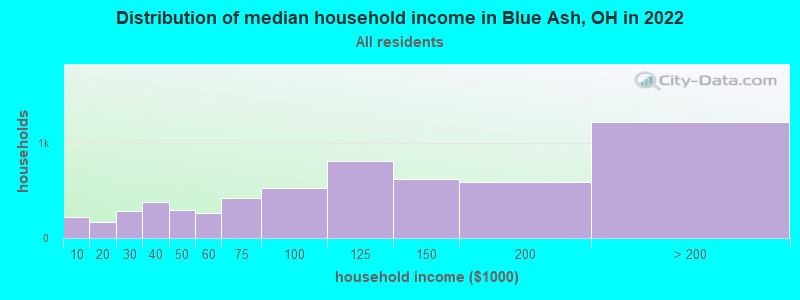
Blue Ash, OH household income distribution 216 Less than $10,000166 $10,000 to $19,999280 $20,000 to $29,999383 $30,000 to $39,999293 $40,000 to $49,999266 $50,000 to $59,999416 $60,000 to $74,999530 $75,000 to $99,999812 $100,000 to $124,999615 $125,000 to $149,999591 $150,000 to $199,9991,219 $200,000 or more
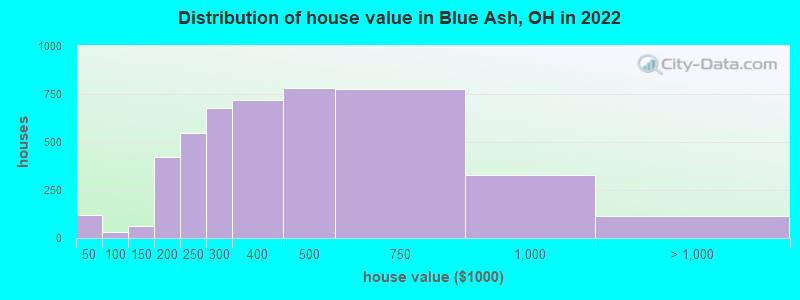
Home value of owner - occupied houses in 2022 in Blue Ash, OH 110 Less than $10,0007 $20,000 to $24,99919 $50,000 to $59,99910 $90,000 to $99,99911 $100,000 to $124,99949 $125,000 to $149,999202 $150,000 to $174,999217 $175,000 to $199,999548 $200,000 to $249,999679 $250,000 to $299,999717 $300,000 to $399,999781 $400,000 to $499,999778 $500,000 to $749,999326 $750,000 to $999,99936 $1,000,000 to $1,499,99970 $1,500,000 to $1,999,9999 $2,000,000 or moreRent paid by renters in 2022 in Blue Ash, OH 22 $200 to $24924 $300 to $3497 $600 to $64917 $650 to $69920 $750 to $79910 $800 to $899109 $900 to $999397 $1,000 to $1,249671 $1,250 to $1,499622 $1,500 to $1,999129 $2,000 to $2,499103 $2,500 to $2,9991 No cash rent
Percentage of workers working in this county: 80.9%Number of people working at home: 1,786 (25.5% of all workers )
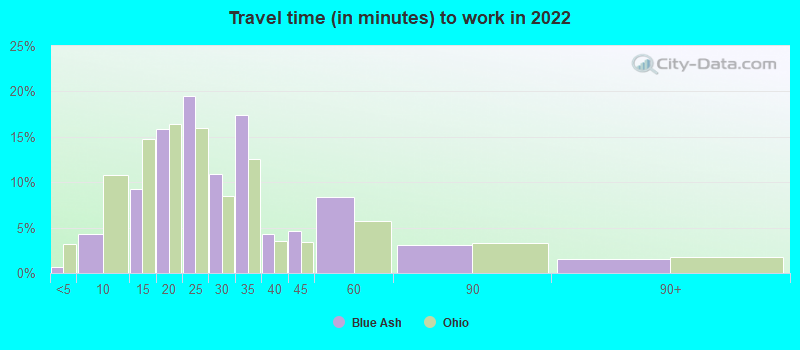
Travel time to work (commute)
Less than 5 minutes: 435 to 9 minutes: 64610 to 14 minutes: 79615 to 19 minutes: 95520 to 24 minutes: 1,16525 to 29 minutes: 57030 to 34 minutes: 77635 to 39 minutes: 14440 to 44 minutes: 11645 to 59 minutes: 11960 to 89 minutes: 3790 or more minutes: 21
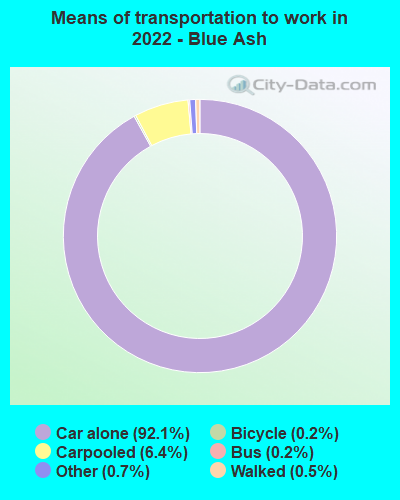
Means of transportation to work:
Drove a car alone: 22,718 (83.6%)Carpooled: 1,649 (6.1%)Bus : 58 (0.2%)Taxi: 225 (0.8%)Bicycle: 26 (0.1%)Walked: 129 (0.5%)Worked at home: 1,786 (6.6%)
Unemployment by race in 2022
Unemployment rate for White non-Hispanic residents 0.9% Males1.3% FemalesUnemployment rate for Black residents 0.2% Males1.4% FemalesUnemployment rate for Asian residents 1.2% Males
Year of entry for the foreign-born population in Blue Ash, Ohio
793 2010 or later 483 2000 to 2009 302 1990 to 1999 265 1980 to 1989 102 1970 to 1979 106 Before 1970
First ancestries reported:
German: 1,419 (20.8%)
English: 622 (9.1%)
American: 467 (6.8%)
Irish: 327 (4.8%)
European: 245 (3.6%)
Italian: 122 (1.8%)
Russian: 103 (1.5%)
Eastern European: 87 (1.3%)
Scotch-Irish: 83 (1.2%)
Polish: 70 (1.0%)
Israeli: 64 (0.9%)
Nigerian: 55 (0.8%)
Romanian: 44 (0.6%)
Jamaican: 42 (0.6%)
Greek: 34 (0.5%)
Ghanaian: 32 (0.5%)
Scottish: 30 (0.4%)
Czech: 28 (0.4%)
Ukrainian: 24 (0.4%)
French: 23 (0.3%)
Northern European: 20 (0.3%)
Croatian: 19 (0.3%)
Ugandan: 17 (0.2%)
Slovene: 14 (0.2%)
Swiss: 11 (0.2%)
Swedish: 10 (0.1%)
Egyptian: 9 (0.1%)
African: 9 (0.1%)
Dutch: 5 (0.07%)
Lithuanian: 5 (0.07%)
Austrian: 4 (0.06%) Most common places of birth for foreign-born residents (%): India Blue Ash:
36.9% (693)Ohio:
11.6% (66,525)
Korea Blue Ash:
7.1% (134)Ohio:
2.0% (11,398)
China, excluding Hong Kong and Taiwan Blue Ash:
5.6% (105)Ohio:
6.2% (35,703)
Russia Blue Ash:
4.7% (89)Ohio:
1.5% (8,452)
Nepal Blue Ash:
4.5% (85)Ohio:
1.9% (10,777)
Israel Blue Ash:
4.4% (82)Ohio:
0.5% (2,631)
Ghana Blue Ash:
4.0% (75)Ohio:
1.8% (10,561)
Mexico Blue Ash:
3.8% (71)Ohio:
7.8% (44,796)
Jamaica Blue Ash:
2.8% (52)Ohio:
0.7% (4,187)
Canada Blue Ash:
2.2% (41)Ohio:
2.6% (14,988)
Hong Kong Blue Ash:
2.0% (37)Ohio:
0.4% (2,094)
Colombia Blue Ash:
1.9% (35)Ohio:
0.8% (4,549)
Vietnam Blue Ash:
1.8% (33)Ohio:
1.9% (10,960)
Place of birth for U.S.-born residents:
This state: 8,188Other state: 3,115Northeast: 761Midwest: 702South: 1,288West: 372 82.6% of Blue Ash residents lived in the same house 1 years ago.
Out of people who lived in different houses, 40.6% lived in this county.
Out of people who lived in different counties, 60.5% lived in Ohio.
Blue Ash:
82.6%State average:
87.8%
Education attainment for males 25 years and older:
No schooling: 32Nursery to 4th grade: 35th and 6th grade: 27th and 8th grade: 169th grade: 910th grade: 011th grade: 012th grade, no diploma: 10High school graduate (or equivalency): 378Less than 1 year of college: 185Some college more than 1 year, no degree: 354Associate degree: 134Bachelor's degree: 2,140Master's degree: 860Professional school degree: 420Doctorate degree: 210
Education attainment for females 25 years and older:
No schooling: 22Nursery to 4th grade: 35th and 6th grade: 07th and 8th grade: 329th grade: 1810th grade: 1411th grade: 1112th grade, no diploma: 20High school graduate (or equivalency): 728Less than 1 year of college: 284Some college more than 1 year, no degree: 540Associate degree: 245Bachelor's degree: 1,586Master's degree: 1,033Professional school degree: 251Doctorate degree: 163
Housing units in structures:
One, detached: 4,085One, attached: 4973 or 4: 235 to 9: 32910 to 19: 61220 to 49: 2150 or more: 605Mobile homes: 9Housing units lacking complete plumbing facilities in 2022: 0.0%Housing units lacking complete kitchen facilities in 2022: 0.2%Private vs. public school enrollment:
Students in private schools in grades 1 to 8 (elementary and middle school): 226 Students in private schools in grades 9 to 12 (high school): 80 Students in private undergraduate colleges: 97