Birmingham, MI (Michigan) Houses and Residents
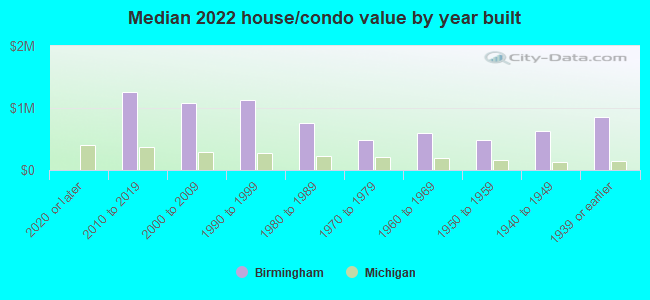
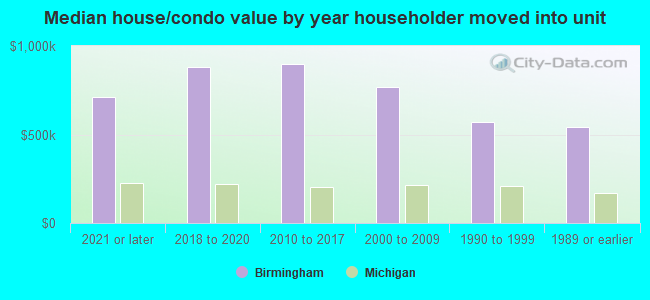
Estimated median house or condo value in 2022: $742,552 (it was $300,700 in 2000 )
Birmingham:
$742,552Michigan:
$224,400
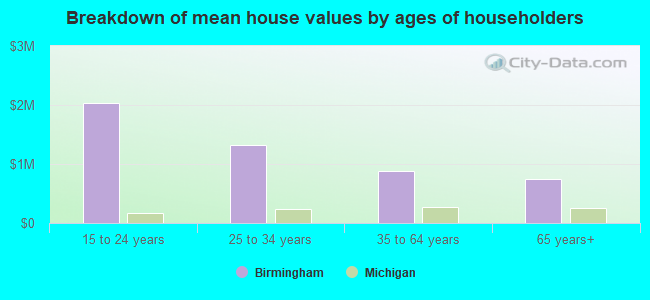
Lower value quartile - upper value quartile: $435,172 - $1,045,425Mean price in 2022: Detached houses: $942,628 Here:
$942,628State:
$280,038
Townhouses or other attached units: $567,362 Here:
$567,362State:
$239,520
In 2-unit structures: $374,563 Here:
$374,563State:
$219,481
In 3-to-4-unit structures: $238,482 Here:
$238,482State:
$207,067
In 5-or-more-unit structures: $492,765 Here:
$492,765State:
$192,733
Total population: 20,757 (Urban population: 19,373, Rural population: 0)
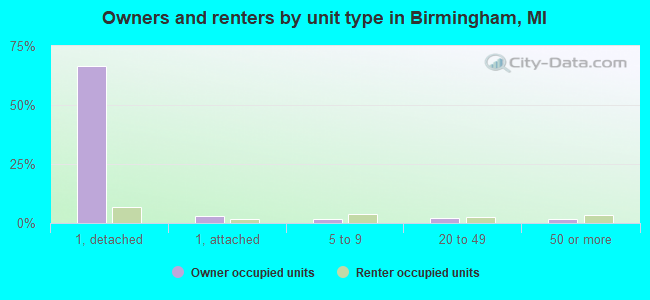
Houses: 10,548 (9,485 occupied: 7,242 owner occupied, 2,245 renter occupied )
% of renters here:
24%State:
27%
Housing density: 2,208 houses/condos per square mile
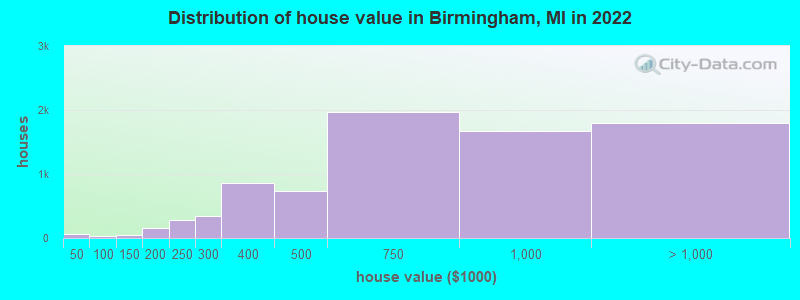
Median price asked for vacant for-sale houses and condos in 2022: $763,003.
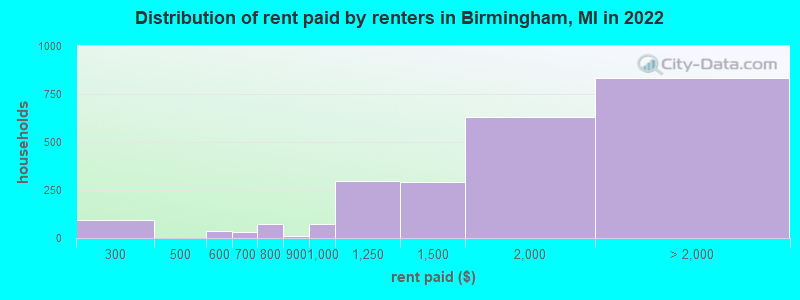
Median contract rent in 2022: $1,665 (lower quartile is $1,224, upper quartile is over $2,000)
Median rent asked for vacant for-rent units in 2022: $1,689
Median gross rent in Birmingham, MI in 2022: $1,814
Housing units in Birmingham with a mortgage: 4,928 (559 second mortgage, 0 home equity loan, 499 both second mortgage and home equity loan )Houses without a mortgage: 251
Median household income for houses/condos with a mortgage: $201,810
Median household income for apartments without a mortgage: $135,316
Median monthly housing costs: $2,257
Data:
Median house or condo value ($)
Median house or condo value ($ change since 2000)
Median house or condo value ($) - White
Median house or condo value ($) - Black or African American
Median house or condo value ($) - Asian
Median house or condo value ($) - Hispanic or Latino
Median house or condo value ($) - American Indian and Alaska Native
Median house or condo value ($) - Multirace
Median house or condo value ($) - Other Race
Median price asked for mobile homes ($)
Household density (households per square mile)
Mean house or condo value by units in structure - 1, detached ($)
Mean house or condo value by units in structure - 1, attached ($)
Mean house or condo value by units in structure - 2 ($)
Mean house or condo value by units in structure by units in structure - 3 or 4 ($)
Mean house or condo value by units in structure - 5 or more ($)
Mean house or condo value by units in structure - Boat, RV, van, etc. ($)
Mean house or condo value by units in structure - Mobile home ($)
Median contract rent ($)
Median contract rent - Lower quartile ($)
Median contract rent - Upper quartile ($)
Median gross rent ($)
Urban houses (%)
Rural houses (%)
Houses occupied (%)
Houses occupied (% change since 2000)
Houses owner occupied (%)
Houses owner occupied (% change since 2000)
Houses renter occupied (%)
Houses renter occupied (% change since 2000)
Vacant housing units - For rent (%)
Vacant housing units - For rent (% change since 2000)
Vacant housing units - For sale only (%)
Vacant housing units - For sale only (% change since 2000)
Vacant housing units - Rented or sold, not occupied (%)
Vacant housing units - Rented or sold, not occupied (% change since 2000)
Vacant housing units - For seasonal, recreational, or occasional use (%)
Vacant housing units - For seasonal, recreational, or occasional use (% change since 2000)
Vacant housing units - For migrant workers (%)
Vacant housing units - For migrant workers (% change since 2000)
Vacant housing units - Other vacant (%)
Vacant housing units - Other vacant (% change since 2000)
Median monthly housing costs ($)
Median household income for houses/condos with a mortgage ($)
Median household income for houses/condos without a mortgage ($)
Median household income ($)
Median household income ($) - White
Median household income ($) - Black or African American
Median household income ($) - Asian
Median household income ($) - Hispanic or Latino
Median household income ($) - American Indian and Alaska Native
Median household income ($) - Multirace
Median household income ($) - Other Race
Mortgage status - with mortgage (%)
Mortgage status - with second mortgage (%)
Mortgage status - with home equity loan (%)
Mortgage status - with both second mortgage and home equity loan (%)
Mortgage status - without a mortgage (%)
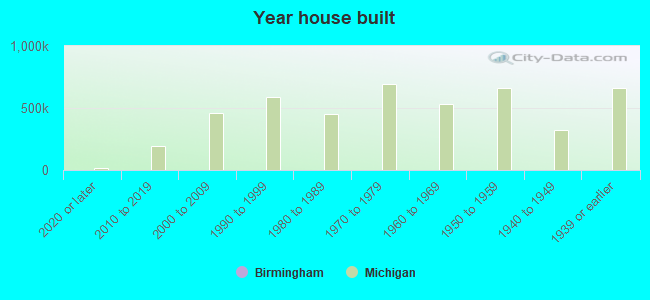
Median year house/condo built
Median year apartment built
Household type by relationship - Male householder living alone (%)
Household type by relationship - Male householder not living alone (%)
Household type by relationship - Female householder living alone (%)
Household type by relationship - Female householder not living alone (%)
Household type by relationship - Opposite-Sex spouse (%)
Household type by relationship - Same-Sex spouse (%)
Household type by relationship - Opposite-Sex unmarried partner (%)
Household type by relationship - Same-Sex unmarried partner (%)
Household type by relationship - In group quarters (%)
Size of family households - 2-person household (%)
Size of family households - 3-person household (%)
Size of family households - 4-person household (%)
Size of family households - 5-person household (%)
Size of family households - 6-person household (%)
Size of family households - 7-or-more-person household (%)
Size of nonfamily households - 1-person household (%)
Size of nonfamily households - 2-person household (%)
Size of nonfamily households - 3-person household (%)
Size of nonfamily households - 4-person household (%)
Size of nonfamily households - 5-person household (%)
Size of nonfamily households - 6-person household (%)
Size of nonfamily households - 7-or-moreperson household (%)
Year house built - Built 2010 or later (%)
Year house built - Built 2000 to 2009 (%)
Year house built - Built 1990 to 1999 (%)
Year house built - Built 1980 to 1989 (%)
Year house built - Built 1970 to 1979 (%)
Year house built - Built 1960 to 1969 (%)
Year house built - Built 1950 to 1959 (%)
Year house built - Built 1940 to 1949 (%)
Year house built - Built 1939 or earlier (%)
Median number of rooms in houses and condos
Median number of rooms in apartments
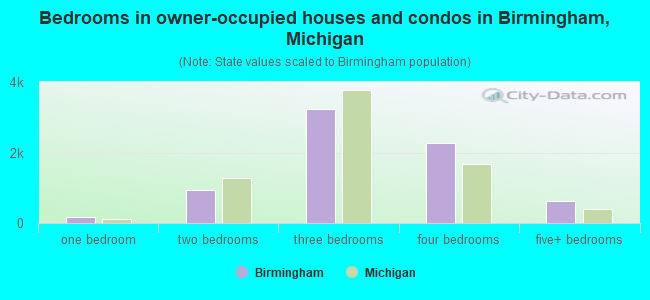
Median number of bedrooms in owner occupied houses
Mean number of bedrooms in owner occupied houses
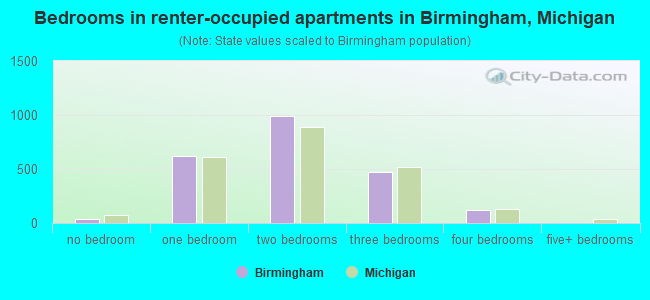
Median number of bedrooms in renter occupied houses
Mean number of bedrooms in renter occupied houses
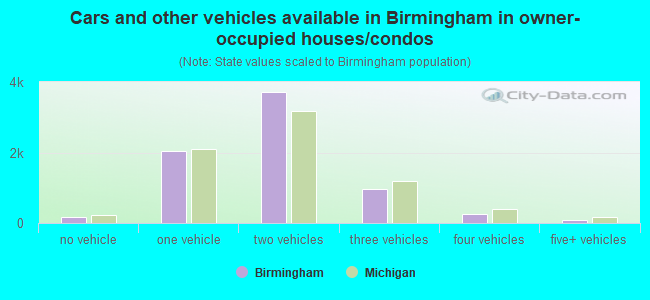
Median number of vehichles in owner occupied houses
Mean number of vehichles in owner occupied houses
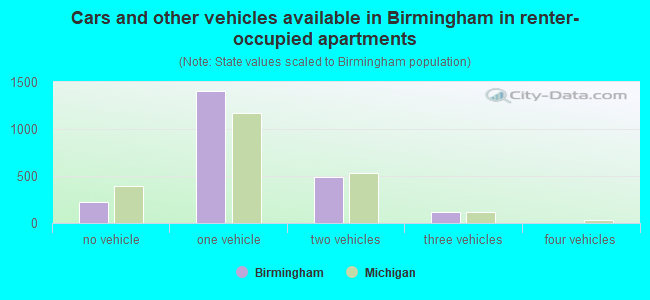
Median number of vehichles in renter occupied houses
Mean number of vehichles in renter occupied houses
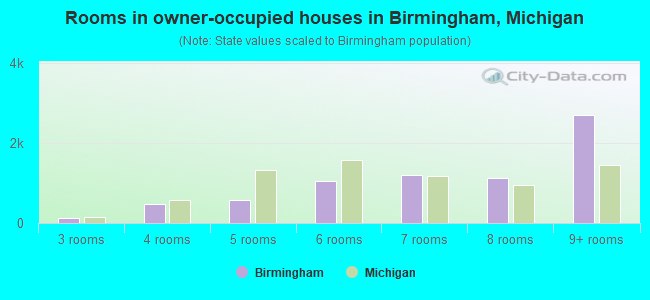
Rooms in owner-occupied houses - 1 room (%)
Rooms in owner-occupied houses - 2 rooms (%)
Rooms in owner-occupied houses - 3 rooms (%)
Rooms in owner-occupied houses - 4 rooms (%)
Rooms in owner-occupied houses - 5 rooms (%)
Rooms in owner-occupied houses - 6 rooms (%)
Rooms in owner-occupied houses - 7 rooms (%)
Rooms in owner-occupied houses - 8 rooms (%)
Rooms in owner-occupied houses - 9+ rooms (%)
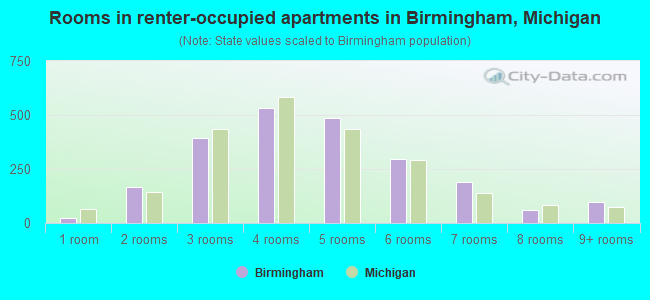
Rooms in renter-occupied houses - 1 room (%)
Rooms in renter-occupied houses - 2 rooms (%)
Rooms in renter-occupied houses - 3 rooms (%)
Rooms in renter-occupied houses - 4 rooms (%)
Rooms in renter-occupied houses - 5 rooms (%)
Rooms in renter-occupied houses - 6 rooms (%)
Rooms in renter-occupied houses - 7 rooms (%)
Rooms in renter-occupied houses - 8 rooms (%)
Rooms in renter-occupied houses - 9+ rooms (%)
Bedrooms in owner-occupied houses - no bedrooms (%)
Bedrooms in owner-occupied houses - 1 bedroom (%)
Bedrooms in owner-occupied houses - 2 bedrooms (%)
Bedrooms in owner-occupied houses - 3 bedrooms (%)
Bedrooms in owner-occupied houses - 4 bedrooms (%)
Bedrooms in owner-occupied houses - 5+ bedrooms (%)
Bedrooms in renter-occupied houses - no bedrooms (%)
Bedrooms in renter-occupied houses - 1 bedroom (%)
Bedrooms in renter-occupied houses - 2 bedrooms (%)
Bedrooms in renter-occupied houses - 3 bedrooms (%)
Bedrooms in renter-occupied houses - 4 bedrooms (%)
Bedrooms in renter-occupied houses - 5+ bedrooms (%)
Vehicles available in owner-occupied houses - no vehicle available (%)
Vehicles available in owner-occupied houses - 1 vehicle available(%)
Vehicles available in owner-occupied houses - 2 Vehicles available (%)
Vehicles available in owner-occupied houses - 3 Vehicles available (%)
Vehicles available in owner-occupied houses - 4 Vehicles available (%)
Vehicles available in owner-occupied houses - 5+ Vehicles available (%)
Vehicles available in renter-occupied houses - no vehicle available (%)
Vehicles available in renter-occupied houses - 1 vehicle available (%)
Vehicles available in renter-occupied houses - 2 Vehicles available (%)
Vehicles available in renter-occupied houses - 3 Vehicles available (%)
Vehicles available in renter-occupied houses - 4 Vehicles available (%)
Vehicles available in renter-occupied houses - 5+ Vehicles available (%)
Housing units in structures - 1, detached (%)
Housing units in structures - 1, attached (%)
Housing units in structures - 2 (%)
Housing units in structures - 3 or 4 (%)
Housing units in structures - 5 to 9 (%)
Housing units in structures - 10 to 19 (%)
Housing units in structures - 20 to 49 (%)
Housing units in structures - 50 or more (%)
Housing units in structures - Mobile home (%)
Housing units in structures - Boat, RV, van, etc. (%)
Housing units in structures - Owners - 1, detached (%)
Housing units in structures - Owners - 1, attached (%)
Housing units in structures - Owners - 2 (%)
Housing units in structures - Owners - 3 or 4 (%)
Housing units in structures - Owners - 5 to 9 (%)
Housing units in structures - Owners - 10 to 19 (%)
Housing units in structures - Owners - 20 to 49 (%)
Housing units in structures - Owners - 50 or more (%)
Housing units in structures - Owners - Mobile home (%)
Housing units in structures - Owners - Boat, RV, van, etc. (%)
Housing units in structures - Renters - 1, detached (%)
Housing units in structures - Renters - 1, attached (%)
Housing units in structures - Renters - 2 (%)
Housing units in structures - Renters - 3 or 4 (%)
Housing units in structures - Renters - 5 to 9 (%)
Housing units in structures - Renters - 10 to 19 (%)
Housing units in structures - Renters - 20 to 49 (%)
Housing units in structures - Renters - 50 or more (%)
Housing units in structures - Renters - Mobile home (%)
Housing units in structures - Renters - Boat, RV, van, etc. (%)
House/condo owner moved in on average (years ago)
Renter moved in on average (years ago)
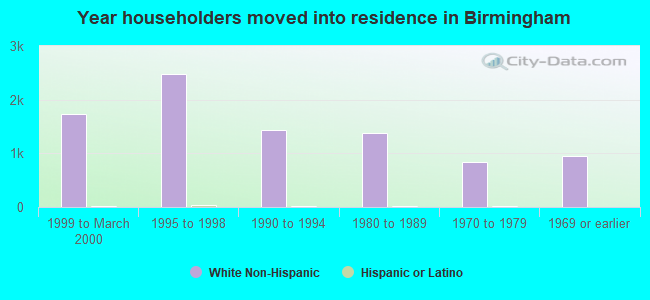
Year householder moved into unit - Moved in 1999 to March 2000 (%)
Year householder moved into unit - Moved in 1999 to March 2000 (%) - White
Year householder moved into unit - Moved in 1999 to March 2000 (%) - Black or African American
Year householder moved into unit - Moved in 1999 to March 2000 (%) - Asian
Year householder moved into unit - Moved in 1999 to March 2000 (%) - Hispanic or Latino
Year householder moved into unit - Moved in 1999 to March 2000 (%) - American Indian and Alaska Native
Year householder moved into unit - Moved in 1999 to March 2000 (%) - Multirace
Year householder moved into unit - Moved in 1999 to March 2000 (%) - Other Race
Year householder moved into unit - Moved in 1995 to 1998 (%)
Year householder moved into unit - Moved in 1995 to 1998 (%) - White
Year householder moved into unit - Moved in 1995 to 1998 (%) - Black or African American
Year householder moved into unit - Moved in 1995 to 1998 (%) - Asian
Year householder moved into unit - Moved in 1995 to 1998 (%) - Hispanic or Latino
Year householder moved into unit - Moved in 1995 to 1998 (%) - American Indian and Alaska Native
Year householder moved into unit - Moved in 1995 to 1998 (%) - Multirace
Year householder moved into unit - Moved in 1995 to 1998 (%) - Other Race
Year householder moved into unit - Moved in 1990 to 1994 (%)
Year householder moved into unit - Moved in 1990 to 1994 (%) - White
Year householder moved into unit - Moved in 1990 to 1994 (%) - Black or African American
Year householder moved into unit - Moved in 1990 to 1994 (%) - Asian
Year householder moved into unit - Moved in 1990 to 1994 (%) - Hispanic or Latino
Year householder moved into unit - Moved in 1990 to 1994 (%) - American Indian and Alaska Native
Year householder moved into unit - Moved in 1990 to 1994 (%) - Multirace
Year householder moved into unit - Moved in 1990 to 1994 (%) - Other Race
Year householder moved into unit - Moved in 1980 to 1989 (%)
Year householder moved into unit - Moved in 1980 to 1989 (%) - White
Year householder moved into unit - Moved in 1980 to 1989 (%) - Black or African American
Year householder moved into unit - Moved in 1980 to 1989 (%) - Asian
Year householder moved into unit - Moved in 1980 to 1989 (%) - Hispanic or Latino
Year householder moved into unit - Moved in 1980 to 1989 (%) - American Indian and Alaska Native
Year householder moved into unit - Moved in 1980 to 1989 (%) - Multirace
Year householder moved into unit - Moved in 1980 to 1989 (%) - Other Race
Year householder moved into unit - Moved in 1970 to 1979 (%)
Year householder moved into unit - Moved in 1970 to 1979 (%) - White
Year householder moved into unit - Moved in 1970 to 1979 (%) - Black or African American
Year householder moved into unit - Moved in 1970 to 1979 (%) - Asian
Year householder moved into unit - Moved in 1970 to 1979 (%) - Hispanic or Latino
Year householder moved into unit - Moved in 1970 to 1979 (%) - American Indian and Alaska Native
Year householder moved into unit - Moved in 1970 to 1979 (%) - Multirace
Year householder moved into unit - Moved in 1970 to 1979 (%) - Other Race
Year householder moved into unit - Moved in 1969 or earlier (%)
Year householder moved into unit - Moved in 1969 or earlier (%) - White
Year householder moved into unit - Moved in 1969 or earlier (%) - Black or African American
Year householder moved into unit - Moved in 1969 or earlier (%) - Asian
Year householder moved into unit - Moved in 1969 or earlier (%) - Hispanic or Latino
Year householder moved into unit - Moved in 1969 or earlier (%) - American Indian and Alaska Native
Year householder moved into unit - Moved in 1969 or earlier (%) - Multirace
Year householder moved into unit - Moved in 1969 or earlier (%) - Other Race
Housing units lacking complete plumbing facilities (%)
Housing units lacking complete kitchen facilities (%)
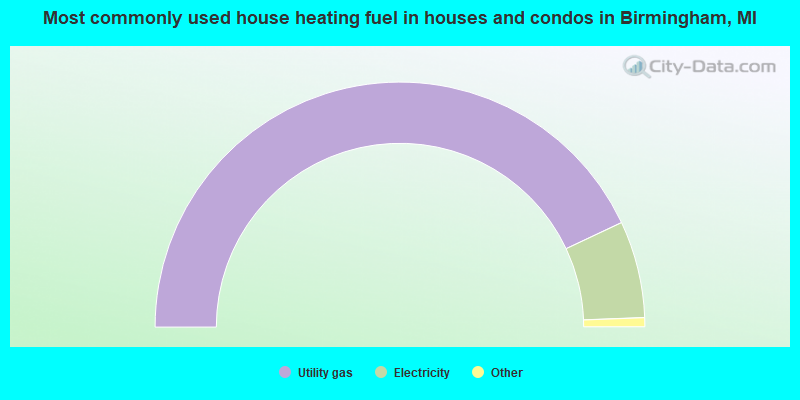
House heating fuel used in houses and condos - Utility gas (%)
House heating fuel used in houses and condos - Bottled, tank, or LP gas (%)
House heating fuel used in houses and condos - Electricity (%)
House heating fuel used in houses and condos - Fuel oil, kerosene, etc. (%)
House heating fuel used in houses and condos - Coal or coke (%)
House heating fuel used in houses and condos - Wood (%)
House heating fuel used in houses and condos - Solar energy (%)
House heating fuel used in houses and condos - Other fuel (%)
House heating fuel used in houses and condos - No fuel used (%)
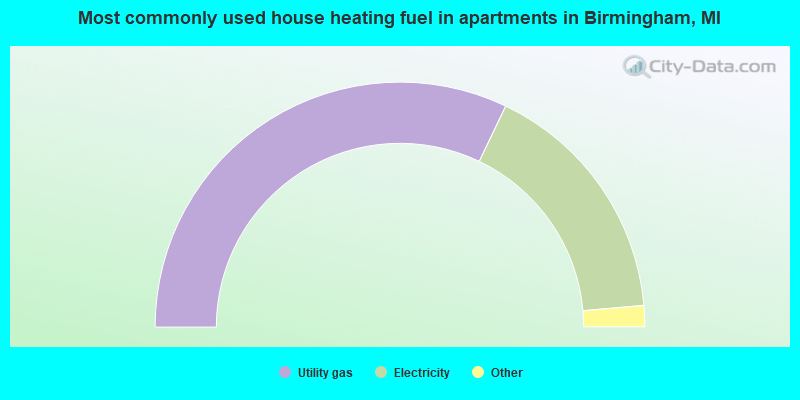
House heating fuel used in apartments - Utility gas (%)
House heating fuel used in apartments - Bottled, tank, or LP gas (%)
House heating fuel used in apartments - Electricity (%)
House heating fuel used in apartments - Fuel oil, kerosene, etc. (%)
House heating fuel used in apartments - Coal or coke (%)
House heating fuel used in apartments - Wood (%)
House heating fuel used in apartments - Solar energy (%)
House heating fuel used in apartments - Other fuel (%)
House heating fuel used in apartments - No fuel used (%)
Latest news about housing in Birmingham, MI collected exclusively by city-data.com from local newspapers, TV, and radio stations
Median year house/condo built: 1957Median year apartment built: 1964Household type by relationship:
Households: 21,689
Male householders: 4,883 (1,308 living alone ), Female householders: 4,479 (2,137 living alone )4,837 spouses (4,805 opposite-sex spouses ), 312 unmarried partners , (293 opposite-sex unmarried partners ), 6,651 children (6,455 natural , 113 adopted , 81 stepchildren ), 37 grandchildren , 18 brothers or sisters , 105 parents , 0 foster children , 217 other relatives , 146 non-relatives
Size of family households: 2,430 2-persons , 942 3-persons , 1,443 4-persons , 423 5-persons , 244 6-persons .
Size of nonfamily households: 3,625 1-person , 424 2-persons .
4,438 married couples with children. single-parent households (292 men , 737 women ).
89.2% of residents of Birmingham speak English at home. of residents speak Spanish at home (87% speak English very well , 13% speak English well ).of residents speak other Indo-European language at home (88% speak English very well , 10% speak English well , 2% speak English not well ).of residents speak Asian or Pacific Island language at home (80% speak English very well , 9% speak English well , 11% speak English not well ).of residents speak other language at home (94% speak English very well , 6% speak English well ).
Foreign born population: 2,356 (10.9%)of them are naturalized citizens )
Median number of rooms in houses and condos:
Median number of rooms in apartments
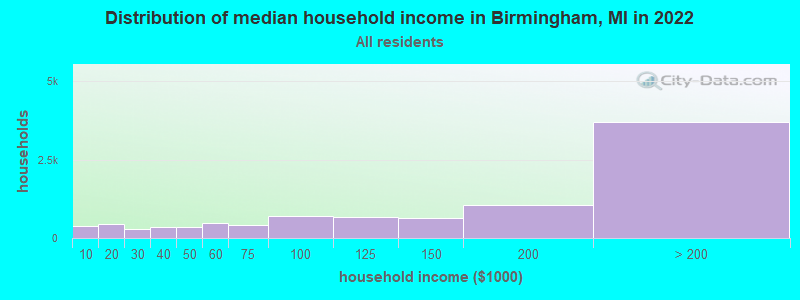
Birmingham, MI household income distribution 375 Less than $10,000459 $10,000 to $19,999292 $20,000 to $29,999352 $30,000 to $39,999341 $40,000 to $49,999469 $50,000 to $59,999429 $60,000 to $74,999703 $75,000 to $99,999662 $100,000 to $124,999653 $125,000 to $149,9991,062 $150,000 to $199,9993,700 $200,000 or more
Home value of owner - occupied houses in 2022 in Birmingham, MI 15 Less than $10,00012 $10,000 to $14,99911 $20,000 to $24,99912 $25,000 to $29,9994 $30,000 to $34,99913 $60,000 to $69,9996 $70,000 to $79,9995 $80,000 to $89,99929 $100,000 to $124,99910 $125,000 to $149,99964 $150,000 to $174,99991 $175,000 to $199,999280 $200,000 to $249,999340 $250,000 to $299,999865 $300,000 to $399,999734 $400,000 to $499,9991,965 $500,000 to $749,9991,665 $750,000 to $999,9991,166 $1,000,000 to $1,499,999319 $1,500,000 to $1,999,999304 $2,000,000 or moreRent paid by renters in 2022 in Birmingham, MI 95 $200 to $24935 $500 to $54928 $600 to $64911 $700 to $74960 $750 to $7999 $800 to $89970 $900 to $999297 $1,000 to $1,249291 $1,250 to $1,499629 $1,500 to $1,999330 $2,000 to $2,499139 $2,500 to $2,999107 $3,000 to $3,499174 $3,500 or more79 No cash rent
Percentage of workers working in this county: 83.6%Number of people working at home: 3,598 (31.5% of all workers )
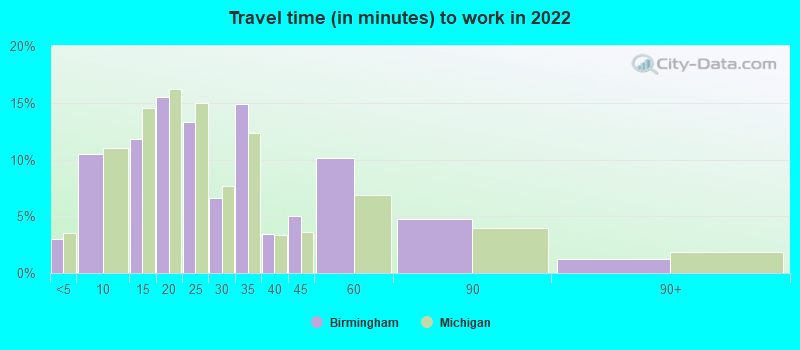
Travel time to work (commute)
Less than 5 minutes: 5025 to 9 minutes: 1,21310 to 14 minutes: 1,04915 to 19 minutes: 1,42320 to 24 minutes: 1,25325 to 29 minutes: 67930 to 34 minutes: 87735 to 39 minutes: 36740 to 44 minutes: 38545 to 59 minutes: 40660 to 89 minutes: 13490 or more minutes: 17
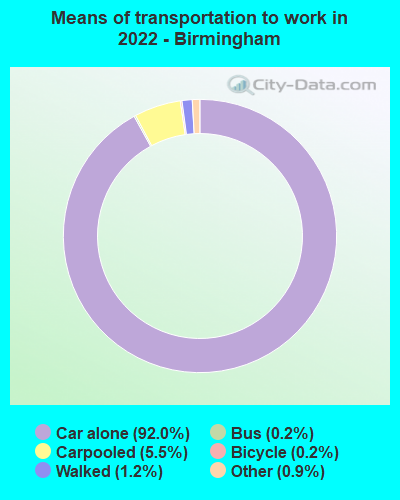
Means of transportation to work:
Drove a car alone: 12,581 (73.2%)Carpooled: 730 (4.2%)Bus : 13 (0.1%)Taxi: 157 (0.9%)Bicycle: 45 (0.3%)Walked: 193 (1.1%)Worked at home: 3,598 (20.9%)
Unemployment by race in 2022
Unemployment rate for White non-Hispanic residents 1.7% Males4.0% FemalesUnemployment rate for Black residents 14.8% MalesUnemployment rate for two or more race residents 1.2% Males7.4% Females
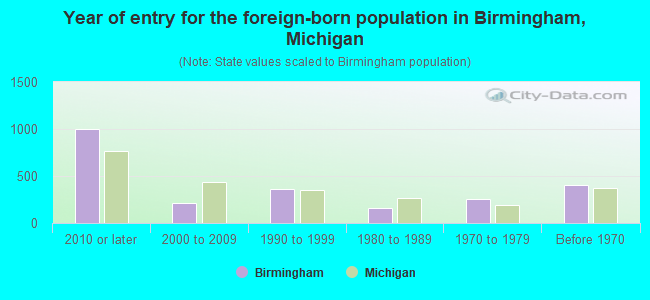
Year of entry for the foreign-born population in Birmingham, Michigan
998 2010 or later 217 2000 to 2009 357 1990 to 1999 157 1980 to 1989 256 1970 to 1979 400 Before 1970
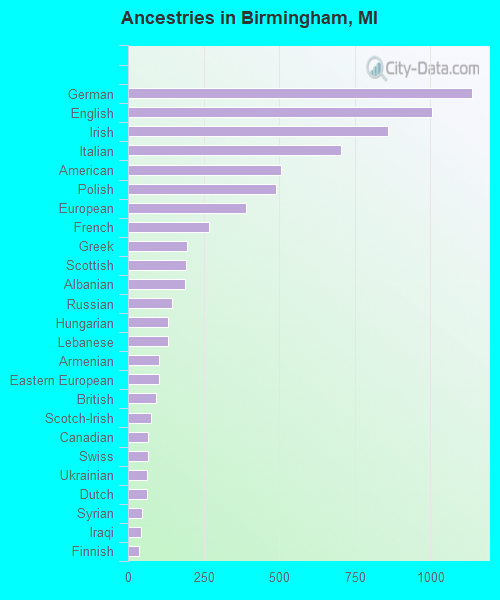
First ancestries reported:
German: 1,137 (11.5%)
English: 1,005 (10.2%)
Irish: 860 (8.7%)
Italian: 705 (7.1%)
American: 506 (5.1%)
Polish: 490 (5.0%)
European: 391 (4.0%)
French: 268 (2.7%)
Greek: 195 (2.0%)
Scottish: 193 (2.0%)
Albanian: 189 (1.9%)
Russian: 144 (1.5%)
Hungarian: 132 (1.3%)
Lebanese: 131 (1.3%)
Armenian: 103 (1.0%)
Eastern European: 102 (1.0%)
British: 91 (0.9%)
Scotch-Irish: 77 (0.8%)
Canadian: 66 (0.7%)
Swiss: 66 (0.7%)
Ukrainian: 64 (0.6%)
Dutch: 62 (0.6%)
Syrian: 47 (0.5%)
Iraqi: 44 (0.4%)
Finnish: 38 (0.4%)
Iranian: 36 (0.4%)
Northern European: 35 (0.4%)
Czech: 31 (0.3%)
Swedish: 31 (0.3%)
Assyrian: 27 (0.3%)
Welsh: 26 (0.3%)
Croatian: 25 (0.3%)
French Canadian: 24 (0.2%)
African: 22 (0.2%)
Slovak: 21 (0.2%)
Norwegian: 18 (0.2%)
Romanian: 16 (0.2%)
Danish: 15 (0.2%)
Austrian: 13 (0.1%)
Israeli: 11 (0.1%)
Serbian: 11 (0.1%)
Lithuanian: 10 (0.1%)
Portuguese: 9 (0.09%)
Czechoslovakian: 7 (0.07%) Most common places of birth for foreign-born residents (%): Korea Birmingham:
12.2% (286)Michigan:
3.0% (20,884)
Canada Birmingham:
9.7% (227)Michigan:
5.0% (35,052)
India Birmingham:
7.4% (174)Michigan:
11.1% (77,240)
Brazil Birmingham:
7.2% (168)Michigan:
1.1% (7,485)
United Kingdom, excluding England and Scotland Birmingham:
4.7% (111)Michigan:
0.8% (5,492)
North Macedonia (Macedonia) Birmingham:
4.6% (107)Michigan:
0.6% (3,931)
Germany Birmingham:
3.2% (76)Michigan:
2.3% (16,126)
Italy Birmingham:
3.0% (70)Michigan:
1.1% (7,792)
Australia Birmingham:
2.9% (67)Michigan:
0.2% (1,695)
Greece Birmingham:
2.7% (64)Michigan:
0.4% (2,721)
Mexico Birmingham:
2.5% (59)Michigan:
10.9% (75,965)
Albania Birmingham:
2.1% (49)Michigan:
1.9% (12,910)
Russia Birmingham:
2.0% (47)Michigan:
0.9% (6,326)
Poland Birmingham:
2.0% (46)Michigan:
1.6% (10,857)
China, excluding Hong Kong and Taiwan Birmingham:
1.8% (43)Michigan:
4.9% (34,295)
Syria Birmingham:
1.8% (41)Michigan:
0.9% (5,978)
Peru Birmingham:
1.7% (39)Michigan:
0.2% (1,298)
Other Eastern Europe Birmingham:
1.7% (39)Michigan:
1.0% (6,730)
Czechoslovakia (includes Czech Republic and Slovakia) Birmingham:
1.6% (38)Michigan:
0.2% (1,437)
England Birmingham:
1.5% (36)Michigan:
0.9% (6,424)
Place of birth for U.S.-born residents:
This state: 14,337Other state: 4,680Northeast: 1,119Midwest: 1,955South: 983West: 631 90.0% of Birmingham residents lived in the same house 1 years ago.
Out of people who lived in different houses, 35.2% lived in this county.
Out of people who lived in different counties, 38.6% lived in Michigan.
Birmingham:
90.0%State average:
88.4%
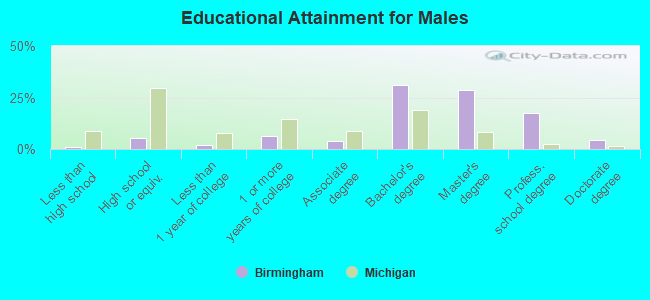
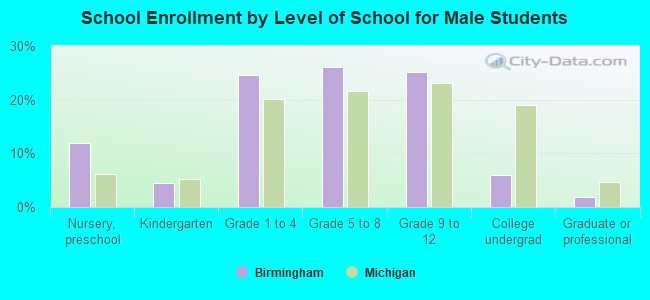
Education attainment for males 25 years and older:
No schooling: 36Nursery to 4th grade: 05th and 6th grade: 07th and 8th grade: 09th grade: 010th grade: 1111th grade: 112th grade, no diploma: 15High school graduate (or equivalency): 406Less than 1 year of college: 152Some college more than 1 year, no degree: 476Associate degree: 293Bachelor's degree: 2,291Master's degree: 2,089Professional school degree: 1,280Doctorate degree: 306
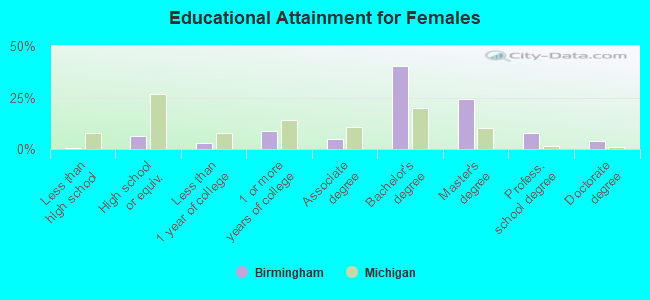
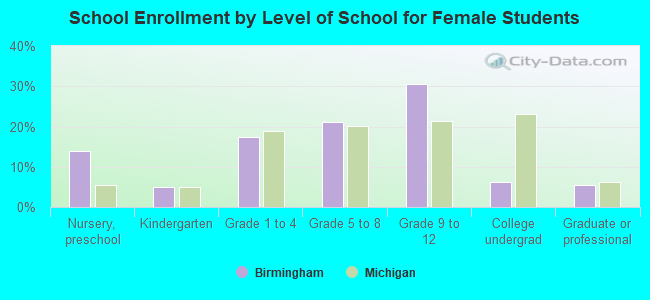
Education attainment for females 25 years and older:
No schooling: 15Nursery to 4th grade: 05th and 6th grade: 67th and 8th grade: 49th grade: 010th grade: 011th grade: 512th grade, no diploma: 26High school graduate (or equivalency): 482Less than 1 year of college: 249Some college more than 1 year, no degree: 687Associate degree: 383Bachelor's degree: 3,212Master's degree: 1,942Professional school degree: 619Doctorate degree: 300
Housing units in structures:
One, detached: 7,442One, attached: 519Two: 1273 or 4: 3865 to 9: 57210 to 19: 45920 to 49: 47150 or more: 562Mobile homes: 8Housing units lacking complete plumbing facilities in 2022: 0.4%Housing units lacking complete kitchen facilities in 2022: 0.4%House/condo owner moved in on average 10 years ago
Renter moved in on average 1 years ago
Private vs. public school enrollment:
Students in private schools in grades 1 to 8 (elementary and middle school): 379 Students in private schools in grades 9 to 12 (high school): 272 Students in private undergraduate colleges: 65