Biddeford, ME (Maine) Houses and Residents
| Biddeford: | $379,812 |
| Maine: | $290,600 |
Mean price in 2022:
Detached houses: $449,743
Here: $449,743 State: $364,324 Townhouses or other attached units: $331,335
Here: $331,335 State: $496,775 In 2-unit structures: $264,857
Here: $264,857 State: $349,654 In 3-to-4-unit structures: $380,335
Here: $380,335 State: $366,418 In 5-or-more-unit structures: $197,400
Here: $197,400 State: $342,001 Mobile homes: $185,334
Here: $185,334 State: $142,980
Total population: 21,337 (Urban population: 16,570, Rural population: 4,372 (37 farm, 4,335 nonfarm))
Houses: 10,852 (9,777 occupied: 4,552 owner occupied, 5,383 renter occupied)
| % of renters here: | 54% |
| State: | 26% |
Housing density: 362 houses/condos per square mile
Median price asked for vacant for-sale houses and condos in 2022: $540,862.
Median contract rent in 2022: $957 (lower quartile is $793, upper quartile is $1,259)
Median rent asked for vacant for-rent units in 2022: $4,050
Median gross rent in Biddeford, ME in 2022: $1,075
Housing units in Biddeford with a mortgage: 3,209 (445 second mortgage, 23 home equity loan, 381 both second mortgage and home equity loan)
Houses without a mortgage: 211
Median household income for houses/condos with a mortgage: $100,264
Median household income for apartments without a mortgage: $62,662
Median monthly housing costs: $1,207
Compare current foreclosures near Biddeford, ME:
| Photo | Address | Area | Beds / Baths | Price | Details |
|---|---|---|---|---|---|

|
#1
Main St Apt 2
Biddeford, ME 04005
|
- sq. feet
|
- baths - beds |
show details | |

|
#2
Graham St
Biddeford, ME 04005
|
- sq. feet
|
- baths - beds |
show details | |

|
#3
Port Rd
Kennebunk, ME 04043
|
- sq. feet
|
6 baths 7 beds |
show details | |

|
#4
Nason St # B
Sanford, ME 04073
|
1,320 sq. feet
|
1 baths 3 beds |
show details | |

|
#5
Spring St Apt 201
Saco, ME 04072
|
6,358 sq. feet
|
5 baths 8 beds |
show details | |

|
#6
Saco St Unit 2
Westbrook, ME 04092
|
1,725 sq. feet
|
2 baths 4 beds |
show details | |

|
#7
Ferry Rd
Saco, ME 04072
|
1,728 sq. feet
|
2 baths 3 beds |
show details | |

|
#8
Coach Rd
South Portland, ME 04106
|
1,300 sq. feet
|
2 baths 3 beds |
show details | |

|
#9
Haskell St
Westbrook, ME 04092
|
1,573 sq. feet
|
1 baths 3 beds |
show details | |

|
#10
Summer St
Kennebunk, ME 04043
|
2,452 sq. feet
|
2 baths 3 beds |
show details |
| Photo | Address | Area | Beds / Baths | Price | Details |
|---|---|---|---|---|---|

|
#11
Fletcher St
Kennebunk, ME 04043
|
1,638 sq. feet
|
1 baths 3 beds |
show details | |

|
#12
Main St
Gorham, ME 04038
|
691 sq. feet
|
1 baths 2 beds |
show details | |

|
#13
Scammon St
Saco, ME 04072
|
1,340 sq. feet
|
2 baths 4 beds |
show details | |

|
#14
Church St
Westbrook, ME 04092
|
1,529 sq. feet
|
1 baths 3 beds |
show details | |

|
#15
Bridge St
Westbrook, ME 04092
|
1,268 sq. feet
|
1 baths 2 beds |
show details | |

|
#16
Dollys Way
Scarborough, ME 04074
|
1,821 sq. feet
|
2 baths 3 beds |
show details | |

|
#17
Tatnic Rd
Wells, ME 04090
|
2,238 sq. feet
|
2 baths - beds |
show details | |

|
#18
Locksmith Ln
Wells, ME 04090
|
1,212 sq. feet
|
1 baths - beds |
show details | |

|
#19
Cape Woods Dr
Cape Elizabeth, ME 04107
|
- sq. feet
|
- baths - beds |
show details | |

|
#20
Emma Ln
Gorham, ME 04038
|
- sq. feet
|
- baths - beds |
show details |
| Photo | Address | Area | Beds / Baths | Price | Details |
|---|---|---|---|---|---|

|
#21
Liza Harmon Dr Apt 128
Westbrook, ME 04092
|
- sq. feet
|
- baths - beds |
show details | |

|
#22
Congress St # 2
Portland, ME 04102
|
- sq. feet
|
- baths - beds |
show details | |

|
#23
Park Ave Apt 2
Portland, ME 04101
|
- sq. feet
|
- baths - beds |
show details | |

|
#24
Main St Apt 15
South Portland, ME 04106
|
- sq. feet
|
- baths - beds |
show details | |

|
#25
Cumberland Ave # 302
Portland, ME 04101
|
- sq. feet
|
- baths - beds |
show details | |

|
#26
Congress St
Portland, ME 04101
|
- sq. feet
|
- baths - beds |
show details | |

|
#27
Pleasant Ave
Portland, ME 04103
|
- sq. feet
|
- baths - beds |
show details | |

|
#28
India St # 1
Portland, ME 04101
|
- sq. feet
|
- baths - beds |
show details | |

|
#29
Jackson St # B
Sanford, ME 04073
|
- sq. feet
|
- baths - beds |
show details | |

|
#30
Riverside St Apt 424
Portland, ME 04103
|
- sq. feet
|
- baths - beds |
show details |
| Photo | Address | Area | Beds / Baths | Price | Details |
|---|---|---|---|---|---|

|
#31
Sargent St
Westbrook, ME 04092
|
- sq. feet
|
- baths - beds |
show details | |

|
#32
Webster Rd
Buxton, ME 04093
|
- sq. feet
|
- baths - beds |
show details | |

|
#33
College Ave # 125
Gorham, ME 04038
|
- sq. feet
|
- baths - beds |
show details | |

|
#34
Us Route 1, Apt 11
Scarborough, ME 04074
|
- sq. feet
|
- baths - beds |
show details | |

|
#35
Stagecoach Dr
Old Orchard Beach, ME 04064
|
- sq. feet
|
- baths - beds |
show details | |

|
#36
Portland Ave # 421
Old Orchard Beach, ME 04064
|
- sq. feet
|
- baths - beds |
show details | |

|
#37
Rose Terrace Cir
Kennebunkport, ME 04046
|
- sq. feet
|
- baths - beds |
show details | |

|
#38
Limerick Rd
Kennebunkport, ME 04046
|
- sq. feet
|
- baths - beds |
show details | |

|
#39
Haleys Woods Ln Apt 4
Kennebunk, ME 04043
|
- sq. feet
|
- baths - beds |
show details | |

|
#40
N Kelsey St Apt 2
South Portland, ME 04106
|
- sq. feet
|
- baths - beds |
show details |
| Photo | Address | Area | Beds / Baths | Price | Details |
|---|---|---|---|---|---|

|
#41
High St
Kennebunk, ME 04043
|
- sq. feet
|
- baths - beds |
show details | |

|
#42
Devereaux Cir
South Portland, ME 04106
|
- sq. feet
|
- baths - beds |
show details | |

|
#43
Ballantyne Dr
Scarborough, ME 04074
|
- sq. feet
|
- baths - beds |
show details | |

|
#44
Basswood St
Alfred, ME 04002
|
- sq. feet
|
- baths - beds |
show details | |

|
#45
Scarborough Downs Rd
Scarborough, ME 04074
|
- sq. feet
|
- baths - beds |
show details | |

|
#46
Farm View Way
Wells, ME 04090
|
- sq. feet
|
- baths - beds |
show details | |

|
#47
Townhouse Dr
South Portland, ME 04106
|
- sq. feet
|
- baths - beds |
show details | |

|
#48
Forest St
Saco, ME 04072
|
- sq. feet
|
- baths - beds |
show details | |

|
#49
Curtis Rd
Kennebunkport, ME 04046
|
- sq. feet
|
- baths - beds |
show details | |

|
Check over 1 million property listings on Foreclosure.com!
|
browse all offers | |||

Latest news about housing in Biddeford, ME collected exclusively by city-data.com from local newspapers, TV, and radio stations

 | Biddeford or Saco schools or...? (0 replies) |
| Portland Neighborhoods, Real Estate Companies, and More (3 replies) |
| Honest opinions on Biddeford/Saco (3 replies) |
| Moving to ME next year, need advice on small towns with apartment rentals (20 replies) |
| Renting in an apartment complex (8 replies) |
| Biddeford Public Schools (3 replies) |

Median year apartment built: 1949
Household type by relationship:
Households: 22,864- Male householders: 4,961 (1,640 living alone), Female householders: 4,795 (1,521 living alone)
3,494 spouses (3,434 opposite-sex spouses), 1,327 unmarried partners, (1,254 opposite-sex unmarried partners), 4,853 children (4,568 natural, 2 adopted, 283 stepchildren), 317 grandchildren, 127 brothers or sisters, 274 parents, 0 foster children, 163 other relatives, 1,164 non-relatives
- In group quarters: 1,384
Size of family households: 2,706 2-persons, 1,262 3-persons, 821 4-persons, 139 5-persons, 170 6-persons, 8 7-or-more-persons.
Size of nonfamily households: 3,258 1-person, 1,226 2-persons, 96 3-persons, 33 4-persons, 11 5-persons.
1,525 married couples with children.
1,552 single-parent households (245 men, 1,307 women).
89.2% of residents of Biddeford speak English at home.
1.6% of residents speak Spanish at home (81% speak English very well, 19% speak English well).
7.5% of residents speak other Indo-European language at home (82% speak English very well, 15% speak English well, 2% speak English not well).
1.3% of residents speak Asian or Pacific Island language at home (25% speak English very well, 38% speak English well, 31% speak English not well, 7% don't speak English at all).
0.2% of residents speak other language at home (60% speak English very well, 25% speak English well, 15% don't speak English at all).
Foreign born population: 647 (2.8%)
(52.2% of them are naturalized citizens)
| Here: | 6.1 |
| State: | 6.1 |
| Here: | 4.1 |
| State: | 4.0 |

- Bedrooms in owner-occupied houses and condos in Biddeford, Maine
- 0no bedroom
- 1941 bedroom
- 1,1012 bedrooms
- 2,3073 bedrooms
- 8204 bedrooms
- 1315+ bedrooms
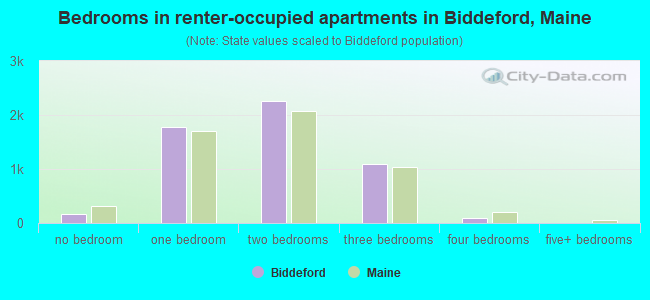
- Bedrooms in renter-occupied apartments in Biddeford, Maine
- 162no bedroom
- 1,7781 bedroom
- 2,2522 bedrooms
- 1,0993 bedrooms
- 924 bedrooms
- 05+ bedrooms
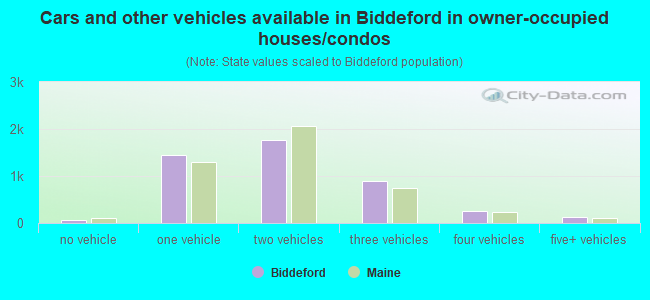
- Cars and other vehicles available in Biddeford in owner-occupied houses/condos
- 58no vehicle
- 1,4471 vehicle
- 1,7572 vehicles
- 9013 vehicles
- 2574 vehicles
- 1325+ vehicles

- Cars and other vehicles available in Biddeford in renter-occupied apartments
- 716no vehicle
- 2,4471 vehicle
- 1,8812 vehicles
- 3243 vehicles
- 164 vehicles
- 05+ vehicles
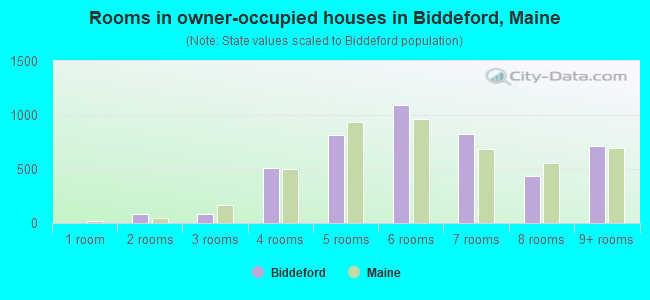
- Rooms in owner-occupied houses in Biddeford, Maine
- 01 room
- 852 rooms
- 843 rooms
- 5094 rooms
- 8135 rooms
- 1,0916 rooms
- 8267 rooms
- 4328 rooms
- 7129+ rooms

- Rooms in renter-occupied apartments in Biddeford, Maine
- 1471 room
- 3862 rooms
- 1,0853 rooms
- 1,6434 rooms
- 9545 rooms
- 5876 rooms
- 3317 rooms
- 1878 rooms
- 639+ rooms


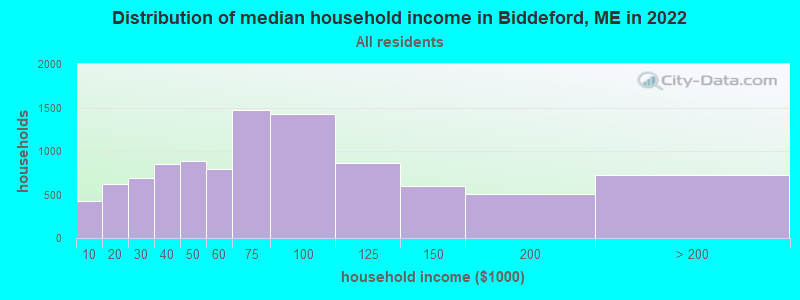
Biddeford, ME household income distribution

- 426Less than $10,000
- 621$10,000 to $19,999
- 692$20,000 to $29,999
- 854$30,000 to $39,999
- 889$40,000 to $49,999
- 797$50,000 to $59,999
- 1,476$60,000 to $74,999
- 1,427$75,000 to $99,999
- 857$100,000 to $124,999
- 601$125,000 to $149,999
- 506$150,000 to $199,999
- 726$200,000 or more
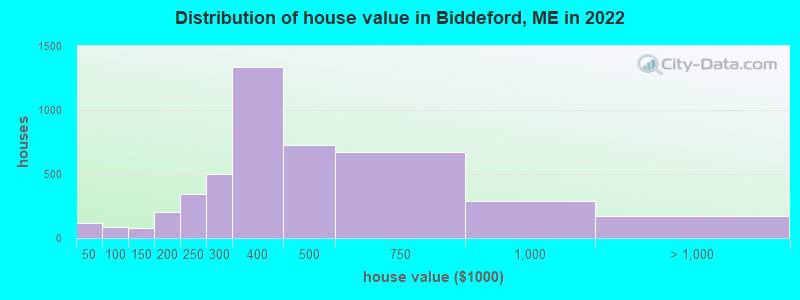
Home value of owner - occupied houses in 2022 in Biddeford, ME
-
- 31Less than $10,000
- 25$20,000 to $24,999
- 39$30,000 to $34,999
- 23$40,000 to $49,999
- 35$50,000 to $59,999
- 23$90,000 to $99,999
- 61$100,000 to $124,999
- 16$125,000 to $149,999
- 87$150,000 to $174,999
- 118$175,000 to $199,999
- 346$200,000 to $249,999
- 500$250,000 to $299,999
- 1,332$300,000 to $399,999
- 729$400,000 to $499,999
- 672$500,000 to $749,999
- 286$750,000 to $999,999
- 64$1,000,000 to $1,499,999
- 4$1,500,000 to $1,999,999
- 102$2,000,000 or more
Rent paid by renters in 2022 in Biddeford, ME
-
- 63Less than $100
- 12$100 to $149
- 30$150 to $199
- 7$200 to $249
- 44$250 to $299
- 109$300 to $349
- 28$350 to $399
- 16$400 to $449
- 60$450 to $499
- 140$500 to $549
- 23$550 to $599
- 17$600 to $649
- 229$650 to $699
- 316$700 to $749
- 133$750 to $799
- 660$800 to $899
- 696$900 to $999
- 963$1,000 to $1,249
- 626$1,250 to $1,499
- 386$1,500 to $1,999
- 45$2,000 to $2,499
- 187No cash rent


Percentage of workers working in this county: 69.0%
Number of people working at home: 1,630 (13.0% of all workers)

Travel time to work (commute)
- Less than 5 minutes: 250
- 5 to 9 minutes: 1,460
- 10 to 14 minutes: 2,103
- 15 to 19 minutes: 1,200
- 20 to 24 minutes: 1,485
- 25 to 29 minutes: 354
- 30 to 34 minutes: 1,820
- 35 to 39 minutes: 575
- 40 to 44 minutes: 565
- 45 to 59 minutes: 653
- 60 to 89 minutes: 212
- 90 or more minutes: 191
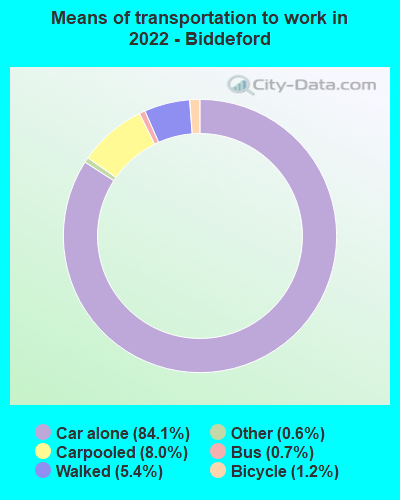
Means of transportation to work:
- Drove a car alone: 9,904 (71.7%)
- Carpooled: 1,036 (7.5%)
- Bus: 120 (0.9%)
- Taxi: 83 (0.6%)
- Bicycle: 111 (0.8%)
- Walked: 579 (4.2%)
- Worked at home: 1,630 (11.8%)

- Unemployment by race in 2022
- Unemployment rate for White non-Hispanic residents
- 4.5%Males
- 3.3%Females
- Unemployment rate for Asian residents
- 2.5%Females
- Unemployment rate for two or more race residents
- 3.9%Males

- Year of entry for the foreign-born population in Biddeford, Maine
- 1472010 or later
- 1102000 to 2009
- 2161990 to 1999
- 1371980 to 1989
- 1061970 to 1979
- 529Before 1970

First ancestries reported:
- French Canadian: 2,237 (21.8%)
- French: 1,352 (13.2%)
- English: 1,027 (10.0%)
- American: 925 (9.0%)
- Irish: 854 (8.3%)
- German: 701 (6.8%)
- Italian: 416 (4.1%)
- Norwegian: 347 (3.4%)
- Canadian: 151 (1.5%)
- Polish: 131 (1.3%)
- Portuguese: 129 (1.3%)
- Scottish: 116 (1.1%)
- European: 106 (1.0%)
- Arab: 68 (0.7%)
- Greek: 60 (0.6%)
- Scotch-Irish: 48 (0.5%)
- Finnish: 45 (0.4%)
- Czech: 38 (0.4%)
- British: 25 (0.2%)
- Russian: 25 (0.2%)
- Celtic: 19 (0.2%)
- Dutch: 11 (0.1%)
- Swiss: 10 (0.10%)
- Slovak: 8 (0.08%)
- Romanian: 6 (0.06%)
- Armenian: 5 (0.05%)
- Austrian: 5 (0.05%)
- Turkish: 4 (0.04%)
- Welsh: 3 (0.03%)
- Northern European: 1 (0.01%)
- Ethiopian: 1 (0.01%)
Most common places of birth for foreign-born residents (%):
| Biddeford: | 23.8% (155) |
| Maine: | 18.9% (9,810) |
| Biddeford: | 15.2% (99) |
| Maine: | 4.6% (2,392) |
| Biddeford: | 8.0% (52) |
| Maine: | 2.0% (1,031) |
| Biddeford: | 7.1% (46) |
| Maine: | 1.7% (865) |
| Biddeford: | 6.1% (40) |
| Maine: | 3.9% (2,005) |
| Biddeford: | 5.1% (33) |
| Maine: | 0.1% (28) |
| Biddeford: | 4.9% (32) |
| Maine: | 1.4% (707) |
| Biddeford: | 4.6% (30) |
| Maine: | 1.2% (603) |
| Biddeford: | 4.0% (26) |
| Maine: | 1.6% (841) |
| Biddeford: | 2.9% (19) |
| Maine: | 0.6% (306) |
| Biddeford: | 2.6% (17) |
| Maine: | 0.6% (321) |
| Biddeford: | 2.0% (13) |
| Maine: | 0.8% (434) |
| Biddeford: | 1.7% (11) |
| Maine: | 3.1% (1,593) |
| Biddeford: | 1.7% (11) |
| Maine: | 2.9% (1,521) |
Place of birth for U.S.-born residents:
- This state: 13,291
- Other state: 8,316
- Northeast: 5,473
- Midwest: 850
- South: 1,284
- West: 567
84.9% of Biddeford residents lived in the same house 1 years ago.
Out of people who lived in different houses, 24.3% lived in this county.
Out of people who lived in different counties, 46.8% lived in Maine.
| Biddeford: | 84.9% |
| State average: | 89.7% |
Education attainment for males 25 years and older:
- No schooling: 87
- Nursery to 4th grade: 0
- 5th and 6th grade: 36
- 7th and 8th grade: 214
- 9th grade: 14
- 10th grade: 104
- 11th grade: 176
- 12th grade, no diploma: 140
- High school graduate (or equivalency): 2,905
- Less than 1 year of college: 452
- Some college more than 1 year, no degree: 936
- Associate degree: 1,011
- Bachelor's degree: 1,557
- Master's degree: 440
- Professional school degree: 80
- Doctorate degree: 180

Education attainment for females 25 years and older:
- No schooling: 5
- Nursery to 4th grade: 0
- 5th and 6th grade: 18
- 7th and 8th grade: 79
- 9th grade: 69
- 10th grade: 31
- 11th grade: 158
- 12th grade, no diploma: 20
- High school graduate (or equivalency): 2,206
- Less than 1 year of college: 382
- Some college more than 1 year, no degree: 1,209
- Associate degree: 955
- Bachelor's degree: 1,861
- Master's degree: 710
- Professional school degree: 100
- Doctorate degree: 37


Housing units in structures:
- One, detached: 4,354
- One, attached: 214
- Two: 1,893
- 3 or 4: 1,733
- 5 to 9: 1,336
- 10 to 19: 379
- 20 to 49: 497
- 50 or more: 300
- Mobile homes: 141
Housing units lacking complete kitchen facilities in 2022: 0.7%
House/condo owner moved in on average 14 years ago
Renter moved in on average 4 years ago

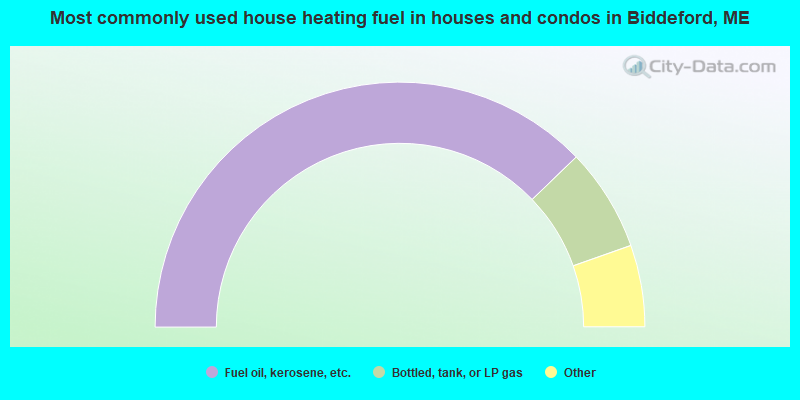
- 75.6%Fuel oil, kerosene, etc.
- 13.6%Bottled, tank, or LP gas
- 3.9%Utility gas
- 3.8%Wood
- 1.8%Electricity
- 0.7%Other fuel
- 0.6%Solar energy
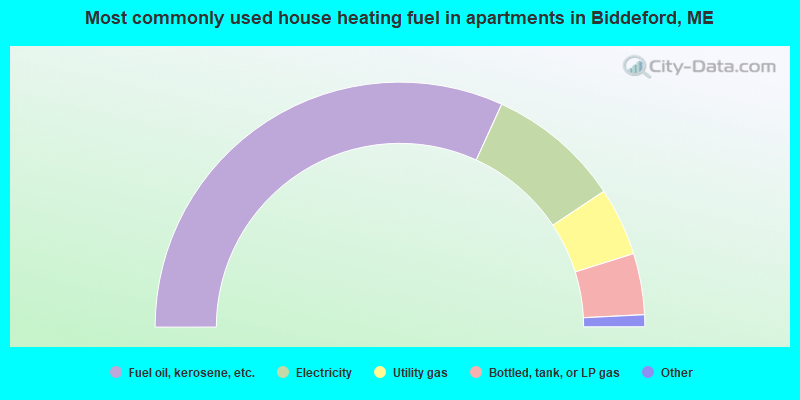
- 63.7%Fuel oil, kerosene, etc.
- 17.7%Electricity
- 9.0%Utility gas
- 8.1%Bottled, tank, or LP gas
- 0.6%No fuel used
- 0.4%Other fuel
- 0.4%Wood
- 0.1%Solar energy
Private vs. public school enrollment:
| Here: | 11.3% |
| Maine: | 12.7% |
| Here: | 3.8% |
| Maine: | 12.6% |
| Here: | 66.7% |
| Maine: | 34.5% |


