Belpre, OH (Ohio) Houses and Residents
| Belpre: | $158,002 |
| Ohio: | $204,100 |
Mean price in 2022:
Detached houses: $244,534
Here: $244,534 State: $254,366 Townhouses or other attached units: $295,790
Here: $295,790 State: $225,733 Mobile homes: $18,337
Here: $18,337 State: $62,719
Total population: 6,436 (All urban)
Houses: 3,349 (3,098 occupied: 1,868 owner occupied, 1,262 renter occupied)
| % of renters here: | 40% |
| State: | 33% |
Housing density: 950 houses/condos per square mile
Median price asked for vacant for-sale houses and condos in 2022 in this county: $264,631.
Median contract rent in 2022: $678 (lower quartile is $535, upper quartile is $822)
Median rent asked for vacant for-rent units in 2022: $700
Median gross rent in Belpre, OH in 2022: $800
Housing units in Belpre with a mortgage: 1,069 (149 second mortgage, 0 home equity loan, 152 both second mortgage and home equity loan)
Houses without a mortgage: 43
Median household income for houses/condos with a mortgage: $66,193
Median household income for apartments without a mortgage: $57,137
Median monthly housing costs: $787
Compare current foreclosures near Belpre, OH:
| Photo | Address | Area | Beds / Baths | Price | Details |
|---|---|---|---|---|---|

|
#1
Florence St
Belpre, OH 45714
|
1,402 sq. feet
|
- baths 2 beds |
show details | |

|
#2
Walnut St
Belpre, OH 45714
|
1,799 sq. feet
|
- baths 4 beds |
show details | |

|
#3
Barnett Ridge Rd
Belpre, OH 45714
|
832 sq. feet
|
- baths 2 beds |
show details | |

|
#4
Poplar Ave
Belpre, OH 45714
|
1,472 sq. feet
|
- baths 4 beds |
show details | |

|
#5
Main St # 3
Belpre, OH 45714
|
- sq. feet
|
- baths - beds |
show details | |

|
#6
Washington Blvd Apt 3
Belpre, OH 45714
|
- sq. feet
|
- baths - beds |
show details | |

|
#7
Florence St
Belpre, OH 45714
|
- sq. feet
|
- baths - beds |
show details | |

|
#8
Rockland Ave
Belpre, OH 45714
|
- sq. feet
|
- baths - beds |
show details | |

|
#9
Main St
Belpre, OH 45714
|
- sq. feet
|
- baths - beds |
show details | |

|
#10
Phillips St
Marietta, OH 45750
|
1,210 sq. feet
|
1 baths 3 beds |
$31,900
|
show details |
| Photo | Address | Area | Beds / Baths | Price | Details |
|---|---|---|---|---|---|

|
#11
23rd St
Parkersburg, WV 26101
|
816 sq. feet
|
1 baths 3 beds |
$12,600
|
show details |

|
#12
Walnut St
Belpre, OH 45714
|
- sq. feet
|
- baths - beds |
show details | |

|
#13
Summit Rd
Marietta, OH 45750
|
1,092 sq. feet
|
1 baths 3 beds |
show details | |

|
#14
Canterbury Dr
Parkersburg, WV 26104
|
1,451 sq. feet
|
3 baths 4 beds |
show details | |

|
#15
Hill Ave
Parkersburg, WV 26101
|
1,410 sq. feet
|
2 baths 3 beds |
show details | |

|
#16
Chestnut St
Parkersburg, WV 26101
|
1,104 sq. feet
|
2 baths 3 beds |
show details | |

|
#17
Warrior Dr
Vincent, OH 45784
|
1,040 sq. feet
|
1 baths 2 beds |
show details | |

|
#18
State Route 550
Bartlett, OH 45713
|
1,684 sq. feet
|
1 baths 4 beds |
show details | |

|
#19
Camden Ave
Parkersburg, WV 26101
|
- sq. feet
|
- baths - beds |
$21,900
|
show details |

|
#20
42nd St
Parkersburg, WV 26104
|
1,560 sq. feet
|
1 baths 3 beds |
show details |
| Photo | Address | Area | Beds / Baths | Price | Details |
|---|---|---|---|---|---|

|
#21
New England Ridge Rd
Washington, WV 26181
|
1,620 sq. feet
|
2 baths 3 beds |
show details | |

|
#22
Northwood Dr
Parkersburg, WV 26104
|
1,796 sq. feet
|
1 baths 3 beds |
show details | |

|
#23
Lincoln St
Parkersburg, WV 26104
|
1,248 sq. feet
|
1 baths 2 beds |
show details | |

|
#24
Capital Dr
Parkersburg, WV 26101
|
1,790 sq. feet
|
1 baths 3 beds |
show details | |

|
#25
21st St
Vienna, WV 26105
|
2,040 sq. feet
|
2 baths 4 beds |
show details | |

|
#26
Fairview Ave
Parkersburg, WV 26101
|
1,120 sq. feet
|
2 baths 4 beds |
show details | |

|
#27
Central Ave
Williamstown, WV 26187
|
1,852 sq. feet
|
3 baths 4 beds |
show details | |

|
#28
Chestnut St
Parkersburg, WV 26101
|
1,100 sq. feet
|
1 baths 2 beds |
show details | |

|
#29
Emerson Ave
Parkersburg, WV 26104
|
1,120 sq. feet
|
1 baths 2 beds |
show details | |

|
#30
30th St
Parkersburg, WV 26104
|
1,436 sq. feet
|
1 baths 3 beds |
show details |
| Photo | Address | Area | Beds / Baths | Price | Details |
|---|---|---|---|---|---|

|
#31
Briarwood Pl
Parkersburg, WV 26104
|
2,290 sq. feet
|
2 baths 4 beds |
show details | |

|
#32
Harmar St
Marietta, OH 45750
|
1,288 sq. feet
|
- baths 2 beds |
show details | |

|
#33
Maple St
Marietta, OH 45750
|
808 sq. feet
|
- baths 3 beds |
show details | |

|
#34
Lancaster St
Marietta, OH 45750
|
784 sq. feet
|
- baths 2 beds |
show details | |

|
#35
Summers Rd
Marietta, OH 45750
|
1,664 sq. feet
|
- baths 5 beds |
show details | |

|
#36
Wells Ave
Marietta, OH 45750
|
1,512 sq. feet
|
- baths 3 beds |
show details | |

|
#37
Harvest Run Rd
Marietta, OH 45750
|
1,688 sq. feet
|
- baths 3 beds |
show details | |

|
#38
9th St
Marietta, OH 45750
|
1,506 sq. feet
|
- baths 2 beds |
show details | |

|
#39
Warner St
Marietta, OH 45750
|
1,920 sq. feet
|
- baths 4 beds |
show details | |

|
#40
Greene St
Marietta, OH 45750
|
896 sq. feet
|
- baths 2 beds |
show details |
| Photo | Address | Area | Beds / Baths | Price | Details |
|---|---|---|---|---|---|

|
#41
Jordan Run Rd
Coolville, OH 45723
|
960 sq. feet
|
- baths - beds |
show details | |

|
#42
Muskingum Dr
Marietta, OH 45750
|
1,820 sq. feet
|
- baths 3 beds |
show details | |

|
#43
Browns Rd
Marietta, OH 45750
|
1,944 sq. feet
|
- baths 4 beds |
show details | |

|
#44
Anderson Rd
Fleming, OH 45729
|
1,504 sq. feet
|
- baths 3 beds |
show details | |

|
#45
Warren Chapel Rd
Fleming, OH 45729
|
1,544 sq. feet
|
- baths 2 beds |
show details | |

|
#46
Ross Rd
Little Hocking, OH 45742
|
1,324 sq. feet
|
- baths 3 beds |
show details | |

|
#47
Greenhill Rd
Marietta, OH 45750
|
2,016 sq. feet
|
- baths 3 beds |
show details | |

|
#48
Oak Dr
Little Hocking, OH 45742
|
1,056 sq. feet
|
- baths 3 beds |
show details | |

|
#49
Blue Knob Rd
Marietta, OH 45750
|
1,352 sq. feet
|
- baths 3 beds |
show details | |

|
Check over 1 million property listings on Foreclosure.com!
|
browse all offers | |||

Latest news about housing in Belpre, OH collected exclusively by city-data.com from local newspapers, TV, and radio stations

 | Best town in eastern Ohio (20 replies) |
| What Ohio city are you from? (123 replies) |
| looking for small town in OH to make home (202 replies) |
| Best Movie that's been shot in Ohio? (86 replies) |

Median year apartment built: 1974
Household type by relationship:
Households: 6,679- Male householders: 1,325 (410 living alone), Female householders: 1,743 (769 living alone)
1,185 spouses (1,185 opposite-sex spouses), 490 unmarried partners, (490 opposite-sex unmarried partners), 1,597 children (1,509 natural, 19 adopted, 67 stepchildren), 101 grandchildren, 39 brothers or sisters, 68 parents, 0 foster children, 15 other relatives, 107 non-relatives
- In group quarters: 2
Size of family households: 857 2-persons, 256 3-persons, 269 4-persons, 164 5-persons, 34 6-persons.
Size of nonfamily households: 1,217 1-person, 329 2-persons, 15 5-persons.
772 married couples with children.
391 single-parent households (105 men, 286 women).
96.6% of residents of Belpre speak English at home.
2.7% of residents speak Spanish at home (38% speak English very well, 15% speak English well, 47% speak English not well).
0.4% of residents speak other Indo-European language at home (100% speak English well).
0.7% of residents speak Asian or Pacific Island language at home (69% speak English very well, 31% speak English well).
0.3% of residents speak other language at home (100% speak English very well).
Foreign born population: 50 (0.7%)
(58.0% of them are naturalized citizens)
| Here: | 6.4 |
| State: | 6.7 |
| Here: | 4.3 |
| State: | 4.4 |

- Bedrooms in owner-occupied houses and condos in Belpre, Ohio
- 0no bedroom
- 261 bedroom
- 4322 bedrooms
- 1,1443 bedrooms
- 2254 bedrooms
- 415+ bedrooms

- Bedrooms in renter-occupied apartments in Belpre, Ohio
- 84no bedroom
- 3181 bedroom
- 6012 bedrooms
- 2103 bedrooms
- 514 bedrooms
- 05+ bedrooms

- Cars and other vehicles available in Belpre in owner-occupied houses/condos
- 28no vehicle
- 6061 vehicle
- 7672 vehicles
- 3113 vehicles
- 984 vehicles
- 595+ vehicles

- Cars and other vehicles available in Belpre in renter-occupied apartments
- 64no vehicle
- 7491 vehicle
- 3482 vehicles
- 1023 vehicles
- 04 vehicles
- 05+ vehicles

- Rooms in owner-occupied houses in Belpre, Ohio
- 01 room
- 02 rooms
- 113 rooms
- 1634 rooms
- 3495 rooms
- 4686 rooms
- 4087 rooms
- 2228 rooms
- 2469+ rooms

- Rooms in renter-occupied apartments in Belpre, Ohio
- 591 room
- 812 rooms
- 2423 rooms
- 3234 rooms
- 2285 rooms
- 1686 rooms
- 1137 rooms
- 428 rooms
- 69+ rooms


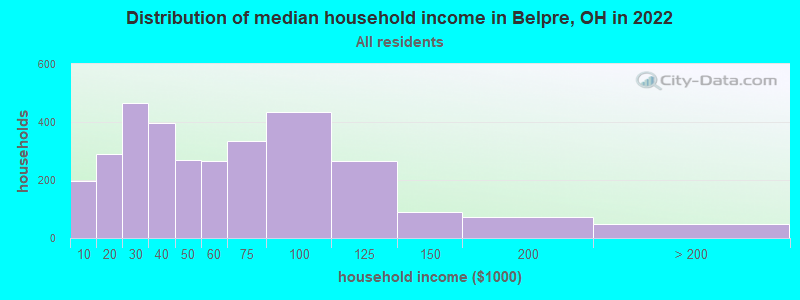
Belpre, OH household income distribution

- 198Less than $10,000
- 291$10,000 to $19,999
- 467$20,000 to $29,999
- 396$30,000 to $39,999
- 270$40,000 to $49,999
- 264$50,000 to $59,999
- 333$60,000 to $74,999
- 434$75,000 to $99,999
- 267$100,000 to $124,999
- 89$125,000 to $149,999
- 72$150,000 to $199,999
- 47$200,000 or more
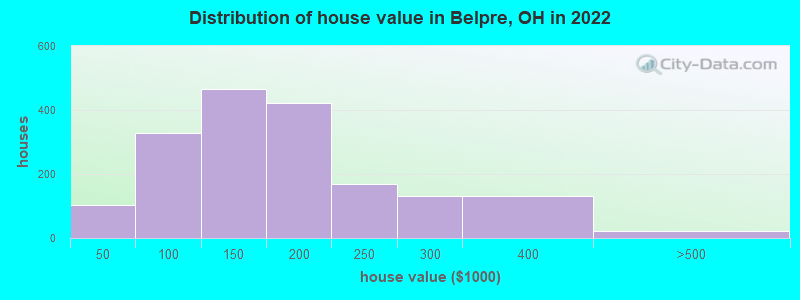
Home value of owner - occupied houses in 2022 in Belpre, OH
-
- 21Less than $10,000
- 19$10,000 to $14,999
- 25$15,000 to $19,999
- 7$25,000 to $29,999
- 11$30,000 to $34,999
- 16$40,000 to $49,999
- 8$60,000 to $69,999
- 31$70,000 to $79,999
- 190$80,000 to $89,999
- 82$90,000 to $99,999
- 262$100,000 to $124,999
- 202$125,000 to $149,999
- 320$150,000 to $174,999
- 100$175,000 to $199,999
- 169$200,000 to $249,999
- 132$250,000 to $299,999
- 130$300,000 to $399,999
- 22$400,000 to $499,999
Rent paid by renters in 2022 in Belpre, OH
-
- 11Less than $100
- 20$100 to $149
- 14$200 to $249
- 52$300 to $349
- 28$350 to $399
- 106$400 to $449
- 26$450 to $499
- 102$500 to $549
- 57$550 to $599
- 147$600 to $649
- 136$650 to $699
- 73$700 to $749
- 213$750 to $799
- 72$800 to $899
- 131$900 to $999
- 34$1,000 to $1,249
- 12$2,500 to $2,999
- 11No cash rent


Percentage of workers working in this county: 40.5%
Number of people working at home: 342 (11.5% of all workers)

Travel time to work (commute)
- Less than 5 minutes: 75
- 5 to 9 minutes: 394
- 10 to 14 minutes: 595
- 15 to 19 minutes: 640
- 20 to 24 minutes: 241
- 25 to 29 minutes: 265
- 30 to 34 minutes: 164
- 35 to 39 minutes: 32
- 40 to 44 minutes: 38
- 45 to 59 minutes: 21
- 60 to 89 minutes: 81
- 90 or more minutes: 69
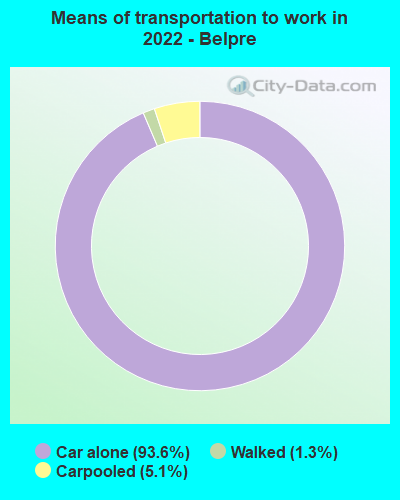
Means of transportation to work:
- Drove a car alone: 2,089 (80.7%)
- Carpooled: 122 (4.7%)
- Walked: 28 (1.1%)
- Worked at home: 342 (13.2%)

- Unemployment by race in 2022
- Unemployment rate for White non-Hispanic residents
- 5.0%Males
- 0.9%Females

- Year of entry for the foreign-born population in Belpre, Ohio
- 232010 or later
- 202000 to 2009
- 01990 to 1999
- 291980 to 1989
- 01970 to 1979
- 13Before 1970
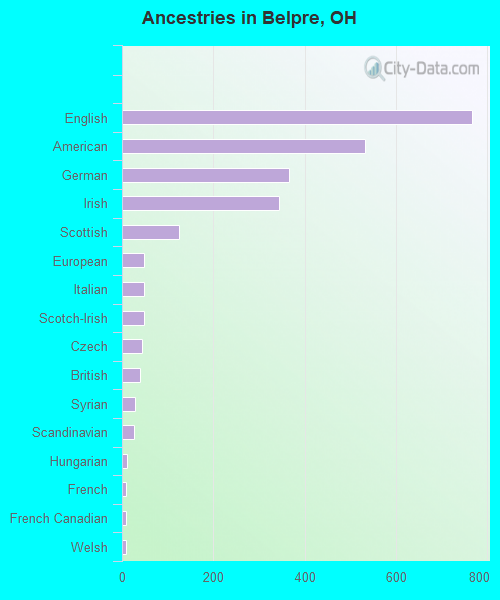
First ancestries reported:
- English: 766 (27.0%)
- American: 532 (18.8%)
- German: 366 (12.9%)
- Irish: 345 (12.2%)
- Scottish: 124 (4.4%)
- European: 48 (1.7%)
- Italian: 48 (1.7%)
- Scotch-Irish: 48 (1.7%)
- Czech: 44 (1.6%)
- British: 40 (1.4%)
- Syrian: 28 (1.0%)
- Scandinavian: 27 (1.0%)
- Hungarian: 10 (0.4%)
- French: 8 (0.3%)
- French Canadian: 8 (0.3%)
- Welsh: 8 (0.3%)
- Arab: 5 (0.2%)
Most common places of birth for foreign-born residents (%):
| Belpre: | 42.0% (21) |
| Ohio: | 0.8% (4,549) |
| Belpre: | 34.0% (17) |
| Ohio: | 3.1% (17,818) |
| Belpre: | 18.0% (9) |
| Ohio: | 0.5% (2,631) |
Place of birth for U.S.-born residents:
- This state: 2,097
- Other state: 4,465
- Northeast: 129
- Midwest: 276
- South: 3,880
- West: 104
88.0% of Belpre residents lived in the same house 1 years ago.
Out of people who lived in different houses, 36.3% lived in this county.
Out of people who lived in different counties, 24.3% lived in Ohio.
| Belpre: | 88.0% |
| State average: | 87.8% |
Education attainment for males 25 years and older:
- No schooling: 19
- Nursery to 4th grade: 0
- 5th and 6th grade: 0
- 7th and 8th grade: 21
- 9th grade: 103
- 10th grade: 31
- 11th grade: 38
- 12th grade, no diploma: 20
- High school graduate (or equivalency): 1,080
- Less than 1 year of college: 102
- Some college more than 1 year, no degree: 306
- Associate degree: 239
- Bachelor's degree: 270
- Master's degree: 75
- Professional school degree: 17
- Doctorate degree: 0

Education attainment for females 25 years and older:
- No schooling: 8
- Nursery to 4th grade: 0
- 5th and 6th grade: 24
- 7th and 8th grade: 0
- 9th grade: 16
- 10th grade: 33
- 11th grade: 49
- 12th grade, no diploma: 17
- High school graduate (or equivalency): 759
- Less than 1 year of college: 216
- Some college more than 1 year, no degree: 520
- Associate degree: 454
- Bachelor's degree: 337
- Master's degree: 65
- Professional school degree: 16
- Doctorate degree: 0


Housing units in structures:
- One, detached: 2,347
- One, attached: 91
- Two: 184
- 3 or 4: 369
- 5 to 9: 100
- 10 to 19: 19
- 20 to 49: 29
- 50 or more: 111
- Mobile homes: 94
Housing units lacking complete kitchen facilities in 2022: 1.9%
House/condo owner moved in on average 12 years ago
Renter moved in on average 5 years ago

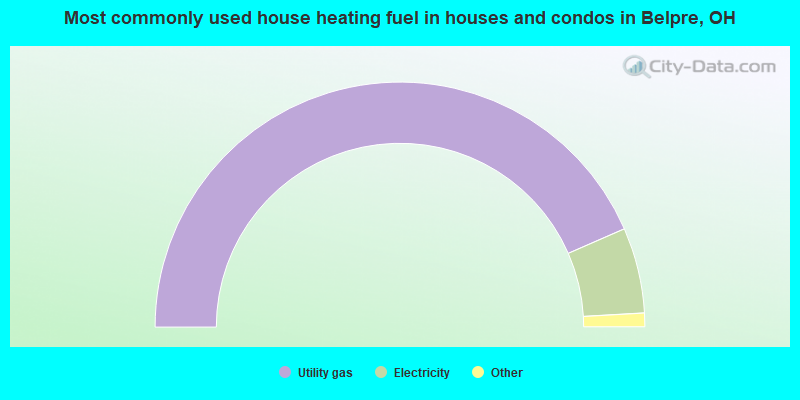
- 86.9%Utility gas
- 11.3%Electricity
- 1.5%Bottled, tank, or LP gas
- 0.3%Fuel oil, kerosene, etc.
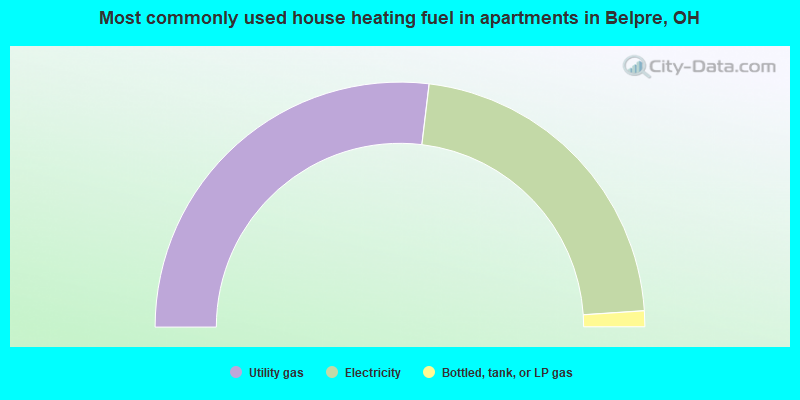
- 53.8%Utility gas
- 44.1%Electricity
- 2.1%Bottled, tank, or LP gas
Private vs. public school enrollment:
| Here: | 3.1% |
| Ohio: | 16.0% |
| Here: | 0.0% |
| Ohio: | 13.1% |
| Here: | 1.6% |
| Ohio: | 22.3% |


