Beebe, AR (Arkansas) Houses and Residents
| Beebe: | $138,430 |
| Arkansas: | $179,800 |
Mean price in 2022:
Detached houses: $184,349
Here: $184,349 State: $243,881
Total population: 7,971 (Urban population: 4,804 (all inside urban clusters), Rural population: 97 (all nonfarm))
Houses: 3,616 (3,072 occupied: 1,824 owner occupied, 1,326 renter occupied)
| % of renters here: | 42% |
| State: | 34% |
Housing density: 838 houses/condos per square mile
Median price asked for vacant for-sale houses and condos in 2022 in this county: $96,218.
Median contract rent in 2022: $579 (lower quartile is $461, upper quartile is $719)
Median rent asked for vacant for-rent units in 2022: $1,002
Median gross rent in Beebe, AR in 2022: $778
Housing units in Beebe with a mortgage: 1,133 (51 second mortgage, 0 home equity loan, 43 both second mortgage and home equity loan)
Houses without a mortgage: 0
Median household income for houses/condos with a mortgage: $94,243
Median household income for apartments without a mortgage: $53,126
Median monthly housing costs: $827
Compare current foreclosures in Beebe, AR:
| Photo | Address | Area | Beds / Baths | Price | Details |
|---|---|---|---|---|---|

|
#1
E Center St
Beebe, AR 72012
|
1,112 sq. feet
|
1 baths 3 beds |
show details | |

|
#2
N Main St
Beebe, AR 72012
|
1,230 sq. feet
|
2 baths 3 beds |
show details | |

|
#3
Sunflower Ln
Beebe, AR 72012
|
- sq. feet
|
2 baths 3 beds |
show details | |

|
#4
Highway 64 W
Beebe, AR 72012
|
2,240 sq. feet
|
2 baths - beds |
show details | |

|
#5
S Fir St
Beebe, AR 72012
|
1,431 sq. feet
|
2 baths - beds |
show details | |

|
#6
Meadows Ln
Beebe, AR 72012
|
2,128 sq. feet
|
2 baths - beds |
show details | |

|
#7
Highway 64 W
Beebe, AR 72012
|
1,800 sq. feet
|
2 baths - beds |
show details | |

|
#8
Birchwood Dr
Beebe, AR 72012
|
1,508 sq. feet
|
2 baths - beds |
show details | |

|
#9
Lynn Harvey Rd
Beebe, AR 72012
|
1,982 sq. feet
|
2 baths - beds |
show details | |

|
#10
Skylark Dr
Beebe, AR 72012
|
1,537 sq. feet
|
1 baths - beds |
show details |
| Photo | Address | Area | Beds / Baths | Price | Details |
|---|---|---|---|---|---|

|
#11
Jamie Ln
Beebe, AR 72012
|
1,608 sq. feet
|
2 baths - beds |
show details | |

|
#12
Baker St
Beebe, AR 72012
|
1,216 sq. feet
|
1 baths - beds |
show details | |

|
#13
S Fir St
Beebe, AR 72012
|
1,568 sq. feet
|
1 baths - beds |
show details | |

|
#14
Windwood Dr
Beebe, AR 72012
|
1,818 sq. feet
|
2 baths - beds |
show details | |

|
#15
Lee Ln
Beebe, AR 72012
|
2,234 sq. feet
|
2 baths - beds |
show details | |

|
#16
W College St
Beebe, AR 72012
|
1,216 sq. feet
|
1 baths - beds |
show details | |

|
#17
Leewood Cv
Beebe, AR 72012
|
1,036 sq. feet
|
1 baths - beds |
show details | |

|
#18
N Hickory St
Beebe, AR 72012
|
2,068 sq. feet
|
3 baths - beds |
show details | |

|
#19
Shamrock Ln
Beebe, AR 72012
|
960 sq. feet
|
1 baths - beds |
show details | |

|
#20
Leewood Cv
Beebe, AR 72012
|
1,963 sq. feet
|
2 baths - beds |
show details |
| Photo | Address | Area | Beds / Baths | Price | Details |
|---|---|---|---|---|---|

|
#21
Mcgraw Lake Rd
Beebe, AR 72012
|
- sq. feet
|
- baths - beds |
show details | |

|
#22
N Gum St
Beebe, AR 72012
|
- sq. feet
|
- baths - beds |
show details | |

|
#23
Ar-31 S
Beebe, AR 72012
|
- sq. feet
|
- baths - beds |
show details | |

|
#24
Jim Corbitt Rd
Beebe, AR 72012
|
- sq. feet
|
- baths - beds |
show details | |

|
#25
Coy Ln
Beebe, AR 72012
|
- sq. feet
|
- baths - beds |
show details | |

|
#26
Loyd Henderson Rd
Beebe, AR 72012
|
- sq. feet
|
- baths - beds |
show details | |

|
#27
Harvest Dr
Beebe, AR 72012
|
- sq. feet
|
- baths - beds |
show details | |

|
#28
Crestwood Dr
Beebe, AR 72012
|
- sq. feet
|
- baths - beds |
show details | |

|
#29
E Idaho St Apt C
Beebe, AR 72012
|
- sq. feet
|
- baths - beds |
show details | |

|
#30
Harvest Dr
Beebe, AR 72012
|
- sq. feet
|
- baths - beds |
show details |
| Photo | Address | Area | Beds / Baths | Price | Details |
|---|---|---|---|---|---|

|
#31
Highway 31 S
Beebe, AR 72012
|
- sq. feet
|
- baths - beds |
show details | |

|
#32
Crestwood Dr
Beebe, AR 72012
|
- sq. feet
|
- baths - beds |
show details | |

|
#33
Crestwood Dr
Beebe, AR 72012
|
- sq. feet
|
- baths - beds |
show details | |

|
#34
Sunflower Ln
Beebe, AR 72012
|
- sq. feet
|
- baths - beds |
show details | |

|
#35
Buck Glade Rd
Beebe, AR 72012
|
- sq. feet
|
- baths - beds |
show details | |

|
#36
W Vinity Rd
Beebe, AR 72012
|
- sq. feet
|
- baths - beds |
show details | |

|
#37
Rhode Island St
Beebe, AR 72012
|
- sq. feet
|
- baths - beds |
show details | |

|
Check over 1 million property listings on Foreclosure.com!
|
browse all offers | |||

Latest news about housing in Beebe, AR collected exclusively by city-data.com from local newspapers, TV, and radio stations

 | Apartments in Searcy area (0 replies) |
| How much clout does the Duggar family havein Arkansas? (129 replies) |
| Moving from Colorado to Fayetteville (25 replies) |
| Best place to live in Arkansas? (476 replies) |
| Can a New York or California liberal be happy living in Conway and/or Little Rock? (56 replies) |
| What do locals around Little Rock think of Bill & Hillary Clinton? (14 replies) |

Median year apartment built: 1998
Household type by relationship:
Households: 8,516- Male householders: 1,439 (256 living alone), Female householders: 1,628 (468 living alone)
1,451 spouses (1,451 opposite-sex spouses), 190 unmarried partners, (190 opposite-sex unmarried partners), 2,543 children (2,141 natural, 100 adopted, 301 stepchildren), 143 grandchildren, 99 brothers or sisters, 77 parents, 0 foster children, 538 other relatives, 272 non-relatives
- In group quarters: 131
Size of family households: 941 2-persons, 360 3-persons, 725 4-persons, 247 5-persons, 27 6-persons, 44 7-or-more-persons.
Size of nonfamily households: 735 1-person, 42 2-persons, 39 3-persons.
1,296 married couples with children.
1,142 single-parent households (621 men, 521 women).
96.9% of residents of Beebe speak English at home.
2.1% of residents speak Spanish at home (43% speak English very well, 57% speak English well).
0.2% of residents speak Asian or Pacific Island language at home (100% speak English very well).
Foreign born population: 112 (1.3%)
(7.1% of them are naturalized citizens)
| Here: | 5.8 |
| State: | 6.1 |
| Here: | 5.0 |
| State: | 4.3 |

- Bedrooms in owner-occupied houses and condos in Beebe, Arkansas
- 0no bedroom
- 221 bedroom
- 802 bedrooms
- 1,3503 bedrooms
- 3194 bedrooms
- 545+ bedrooms

- Bedrooms in renter-occupied apartments in Beebe, Arkansas
- 0no bedroom
- 1581 bedroom
- 3732 bedrooms
- 7953 bedrooms
- 04 bedrooms
- 05+ bedrooms

- Cars and other vehicles available in Beebe in owner-occupied houses/condos
- 22no vehicle
- 4671 vehicle
- 6292 vehicles
- 5143 vehicles
- 1934 vehicles
- 05+ vehicles

- Cars and other vehicles available in Beebe in renter-occupied apartments
- 147no vehicle
- 6521 vehicle
- 3032 vehicles
- 1953 vehicles
- 294 vehicles
- 05+ vehicles

- Rooms in owner-occupied houses in Beebe, Arkansas
- 01 room
- 02 rooms
- 93 rooms
- 934 rooms
- 5275 rooms
- 4676 rooms
- 3787 rooms
- 1248 rooms
- 2269+ rooms

- Rooms in renter-occupied apartments in Beebe, Arkansas
- 01 room
- 02 rooms
- 1113 rooms
- 1894 rooms
- 6955 rooms
- 2396 rooms
- 927 rooms
- 08 rooms
- 09+ rooms


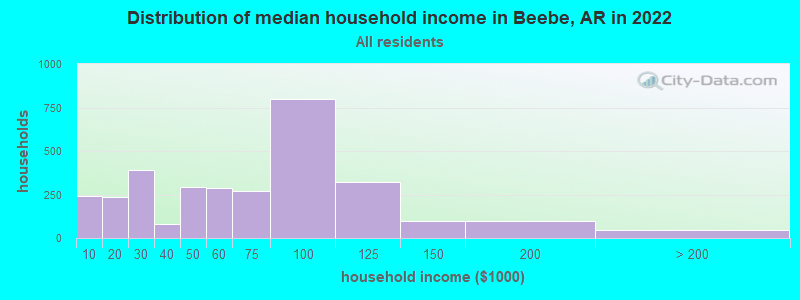
Beebe, AR household income distribution

- 239Less than $10,000
- 235$10,000 to $19,999
- 390$20,000 to $29,999
- 78$30,000 to $39,999
- 295$40,000 to $49,999
- 290$50,000 to $59,999
- 272$60,000 to $74,999
- 798$75,000 to $99,999
- 322$100,000 to $124,999
- 97$125,000 to $149,999
- 95$150,000 to $199,999
- 46$200,000 or more
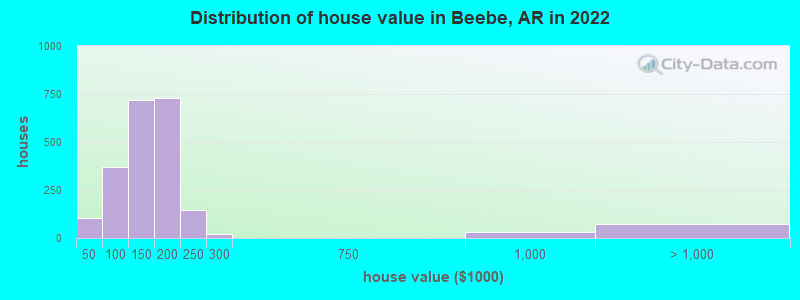
Home value of owner - occupied houses in 2022 in Beebe, AR
-
- 23Less than $10,000
- 32$10,000 to $14,999
- 49$35,000 to $39,999
- 7$50,000 to $59,999
- 268$70,000 to $79,999
- 31$80,000 to $89,999
- 63$90,000 to $99,999
- 642$100,000 to $124,999
- 75$125,000 to $149,999
- 458$150,000 to $174,999
- 268$175,000 to $199,999
- 146$200,000 to $249,999
- 19$250,000 to $299,999
- 29$750,000 to $999,999
- 71$1,000,000 to $1,499,999
Rent paid by renters in 2022 in Beebe, AR
-
- 117$200 to $249
- 144$250 to $299
- 26$300 to $349
- 24$400 to $449
- 60$450 to $499
- 184$500 to $549
- 163$550 to $599
- 108$600 to $649
- 125$700 to $749
- 77$1,000 to $1,249
- 65No cash rent


Percentage of workers working in this county: 72.7%
Number of people working at home: 51 (1.3% of all workers)
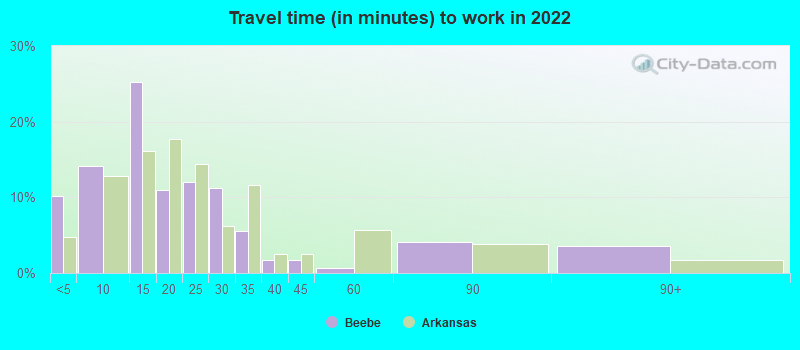
Travel time to work (commute)
- Less than 5 minutes: 306
- 5 to 9 minutes: 514
- 10 to 14 minutes: 349
- 15 to 19 minutes: 615
- 20 to 24 minutes: 249
- 25 to 29 minutes: 478
- 30 to 34 minutes: 310
- 35 to 39 minutes: 123
- 40 to 44 minutes: 178
- 45 to 59 minutes: 264
- 60 to 89 minutes: 305
- 90 or more minutes: 58

Means of transportation to work:
- Drove a car alone: 1,890 (76.3%)
- Carpooled: 367 (14.8%)
- Bus: 40 (1.6%)
- Bicycle: 32 (1.3%)
- Walked: 21 (0.8%)
- Worked at home: 51 (2.1%)

- Unemployment by race in 2022
- Unemployment rate for White non-Hispanic residents
- 1.6%Males
- 2.0%Females

- Year of entry for the foreign-born population in Beebe, Arkansas
- 02010 or later
- 1142000 to 2009
- 01990 to 1999
- 501980 to 1989
- 01970 to 1979
- 7Before 1970

First ancestries reported:
- American: 1,036 (30.2%)
- Irish: 681 (19.8%)
- English: 269 (7.8%)
- German: 153 (4.5%)
- European: 112 (3.3%)
- British: 23 (0.7%)
- French Canadian: 22 (0.6%)
- Polish: 20 (0.6%)
Most common places of birth for foreign-born residents (%):
| Beebe: | 85.4% (105) |
| Arkansas: | 40.2% (61,075) |
| Beebe: | 5.7% (7) |
| Arkansas: | 0.4% (603) |
| Beebe: | 4.9% (6) |
| Arkansas: | 1.8% (2,721) |
Place of birth for U.S.-born residents:
- This state: 5,766
- Other state: 2,646
- Northeast: 69
- Midwest: 924
- South: 1,309
- West: 341
85.8% of Beebe residents lived in the same house 1 years ago.
Out of people who lived in different houses, 39.4% lived in this county.
Out of people who lived in different counties, 56.1% lived in Arkansas.
| Beebe: | 85.8% |
| State average: | 87.0% |
Education attainment for males 25 years and older:
- No schooling: 0
- Nursery to 4th grade: 0
- 5th and 6th grade: 0
- 7th and 8th grade: 35
- 9th grade: 0
- 10th grade: 0
- 11th grade: 68
- 12th grade, no diploma: 29
- High school graduate (or equivalency): 1,236
- Less than 1 year of college: 394
- Some college more than 1 year, no degree: 383
- Associate degree: 38
- Bachelor's degree: 266
- Master's degree: 193
- Professional school degree: 0
- Doctorate degree: 23

Education attainment for females 25 years and older:
- No schooling: 73
- Nursery to 4th grade: 0
- 5th and 6th grade: 0
- 7th and 8th grade: 110
- 9th grade: 0
- 10th grade: 59
- 11th grade: 72
- 12th grade, no diploma: 46
- High school graduate (or equivalency): 902
- Less than 1 year of college: 202
- Some college more than 1 year, no degree: 190
- Associate degree: 391
- Bachelor's degree: 344
- Master's degree: 157
- Professional school degree: 49
- Doctorate degree: 172


Housing units in structures:
- One, detached: 2,839
- One, attached: 78
- Two: 93
- 3 or 4: 392
- 5 to 9: 17
- 10 to 19: 48
- 20 to 49: 24
- 50 or more: 58
- Mobile homes: 63
Housing units lacking complete kitchen facilities in 2022: 4.2%
House/condo owner moved in on average 12 years ago
Renter moved in on average 5 years ago

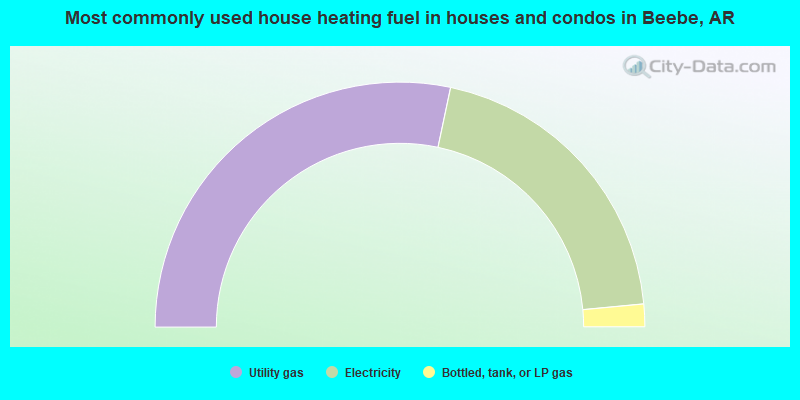
- 56.7%Utility gas
- 40.4%Electricity
- 3.0%Bottled, tank, or LP gas
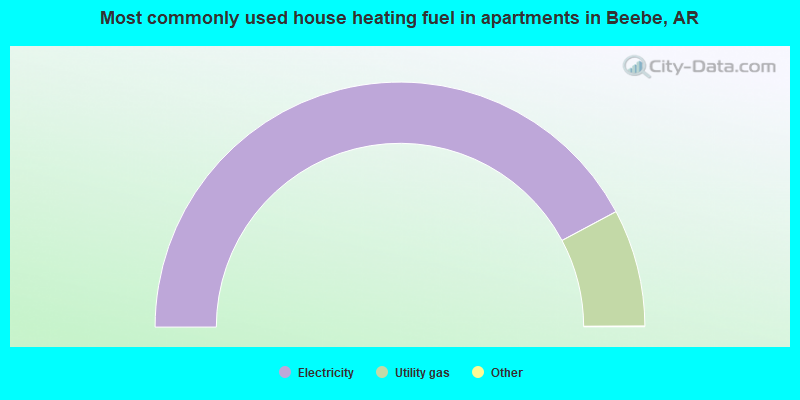
- 84.5%Electricity
- 15.5%Utility gas
Private vs. public school enrollment:
| Here: | 0.0% |
| Arkansas: | 10.5% |
| Here: | 6.2% |
| Arkansas: | 8.7% |
| Here: | 34.6% |
| Arkansas: | 19.4% |


