Battle Creek, MI (Michigan) Houses and Residents
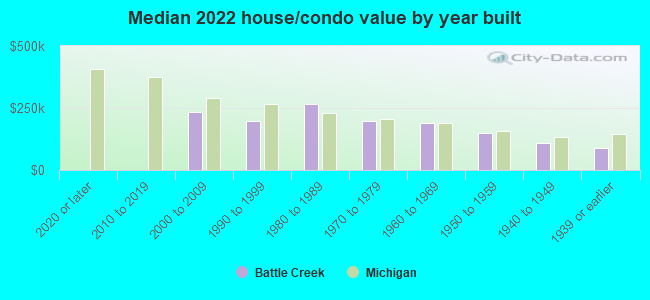
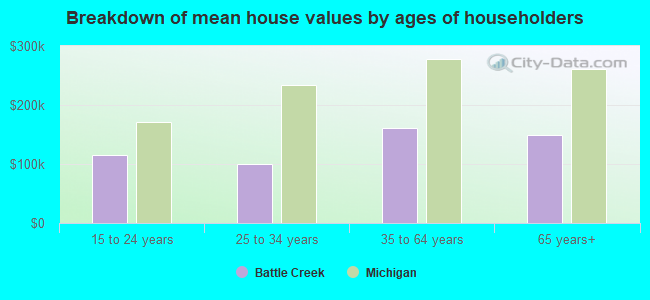
Estimated median house or condo value in 2022: $130,269 (it was $70,800 in 2000 )
Battle Creek:
$130,269Michigan:
$224,400
Lower value quartile - upper value quartile: $76,236 - $204,166Mean price in 2022: Detached houses: $155,472 Here:
$155,472State:
$280,038
Townhouses or other attached units: $208,276 Here:
$208,276State:
$239,520
In 2-unit structures: $137,482 Here:
$137,482State:
$219,481
In 3-to-4-unit structures: $209,306 Here:
$209,306State:
$207,067
In 5-or-more-unit structures: $128,919 Here:
$128,919State:
$192,733
Mobile homes: $34,132 Here:
$34,132State:
$72,868
Total population: 51,833 (All urban)
Houses: 23,782 (21,134 occupied: 13,579 owner occupied, 7,694 renter occupied )
% of renters here:
36%State:
27%
Housing density: 555 houses/condos per square mile
Median price asked for vacant for-sale houses and condos in 2022: $132,087.
Median contract rent in 2022: $685 (lower quartile is $518, upper quartile is $853)
Median rent asked for vacant for-rent units in 2022: $847
Median gross rent in Battle Creek, MI in 2022: $835
Housing units in Battle Creek with a mortgage: 8,809 (518 second mortgage, 0 home equity loan, 471 both second mortgage and home equity loan )Houses without a mortgage: 338
Median household income for houses/condos with a mortgage: $70,827
Median household income for apartments without a mortgage: $55,259
Median monthly housing costs: $841
Data:
Median house or condo value ($)
Median house or condo value ($ change since 2000)
Median house or condo value ($) - White
Median house or condo value ($) - Black or African American
Median house or condo value ($) - Asian
Median house or condo value ($) - Hispanic or Latino
Median house or condo value ($) - American Indian and Alaska Native
Median house or condo value ($) - Multirace
Median house or condo value ($) - Other Race
Median price asked for mobile homes ($)
Household density (households per square mile)
Mean house or condo value by units in structure - 1, detached ($)
Mean house or condo value by units in structure - 1, attached ($)
Mean house or condo value by units in structure - 2 ($)
Mean house or condo value by units in structure by units in structure - 3 or 4 ($)
Mean house or condo value by units in structure - 5 or more ($)
Mean house or condo value by units in structure - Boat, RV, van, etc. ($)
Mean house or condo value by units in structure - Mobile home ($)
Median contract rent ($)
Median contract rent - Lower quartile ($)
Median contract rent - Upper quartile ($)
Median gross rent ($)
Urban houses (%)
Rural houses (%)
Houses occupied (%)
Houses occupied (% change since 2000)
Houses owner occupied (%)
Houses owner occupied (% change since 2000)
Houses renter occupied (%)
Houses renter occupied (% change since 2000)
Vacant housing units - For rent (%)
Vacant housing units - For rent (% change since 2000)
Vacant housing units - For sale only (%)
Vacant housing units - For sale only (% change since 2000)
Vacant housing units - Rented or sold, not occupied (%)
Vacant housing units - Rented or sold, not occupied (% change since 2000)
Vacant housing units - For seasonal, recreational, or occasional use (%)
Vacant housing units - For seasonal, recreational, or occasional use (% change since 2000)
Vacant housing units - For migrant workers (%)
Vacant housing units - For migrant workers (% change since 2000)
Vacant housing units - Other vacant (%)
Vacant housing units - Other vacant (% change since 2000)
Median monthly housing costs ($)
Median household income for houses/condos with a mortgage ($)
Median household income for houses/condos without a mortgage ($)
Median household income ($)
Median household income ($) - White
Median household income ($) - Black or African American
Median household income ($) - Asian
Median household income ($) - Hispanic or Latino
Median household income ($) - American Indian and Alaska Native
Median household income ($) - Multirace
Median household income ($) - Other Race
Mortgage status - with mortgage (%)
Mortgage status - with second mortgage (%)
Mortgage status - with home equity loan (%)
Mortgage status - with both second mortgage and home equity loan (%)
Mortgage status - without a mortgage (%)
Median year house/condo built
Median year apartment built
Household type by relationship - Male householder living alone (%)
Household type by relationship - Male householder not living alone (%)
Household type by relationship - Female householder living alone (%)
Household type by relationship - Female householder not living alone (%)
Household type by relationship - Opposite-Sex spouse (%)
Household type by relationship - Same-Sex spouse (%)
Household type by relationship - Opposite-Sex unmarried partner (%)
Household type by relationship - Same-Sex unmarried partner (%)
Household type by relationship - In group quarters (%)
Size of family households - 2-person household (%)
Size of family households - 3-person household (%)
Size of family households - 4-person household (%)
Size of family households - 5-person household (%)
Size of family households - 6-person household (%)
Size of family households - 7-or-more-person household (%)
Size of nonfamily households - 1-person household (%)
Size of nonfamily households - 2-person household (%)
Size of nonfamily households - 3-person household (%)
Size of nonfamily households - 4-person household (%)
Size of nonfamily households - 5-person household (%)
Size of nonfamily households - 6-person household (%)
Size of nonfamily households - 7-or-moreperson household (%)
Year house built - Built 2010 or later (%)
Year house built - Built 2000 to 2009 (%)
Year house built - Built 1990 to 1999 (%)
Year house built - Built 1980 to 1989 (%)
Year house built - Built 1970 to 1979 (%)
Year house built - Built 1960 to 1969 (%)
Year house built - Built 1950 to 1959 (%)
Year house built - Built 1940 to 1949 (%)
Year house built - Built 1939 or earlier (%)
Median number of rooms in houses and condos
Median number of rooms in apartments
Median number of bedrooms in owner occupied houses
Mean number of bedrooms in owner occupied houses
Median number of bedrooms in renter occupied houses
Mean number of bedrooms in renter occupied houses
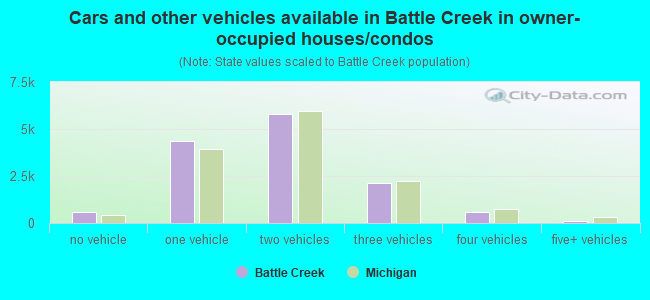
Median number of vehichles in owner occupied houses
Mean number of vehichles in owner occupied houses
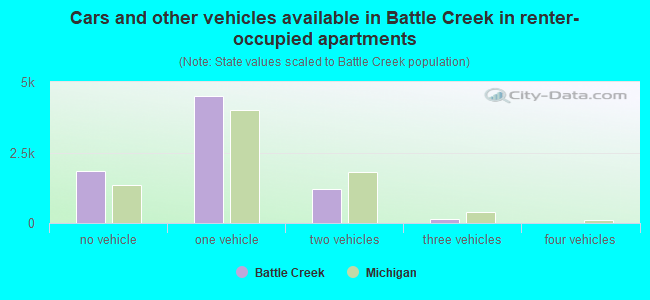
Median number of vehichles in renter occupied houses
Mean number of vehichles in renter occupied houses
Rooms in owner-occupied houses - 1 room (%)
Rooms in owner-occupied houses - 2 rooms (%)
Rooms in owner-occupied houses - 3 rooms (%)
Rooms in owner-occupied houses - 4 rooms (%)
Rooms in owner-occupied houses - 5 rooms (%)
Rooms in owner-occupied houses - 6 rooms (%)
Rooms in owner-occupied houses - 7 rooms (%)
Rooms in owner-occupied houses - 8 rooms (%)
Rooms in owner-occupied houses - 9+ rooms (%)
Rooms in renter-occupied houses - 1 room (%)
Rooms in renter-occupied houses - 2 rooms (%)
Rooms in renter-occupied houses - 3 rooms (%)
Rooms in renter-occupied houses - 4 rooms (%)
Rooms in renter-occupied houses - 5 rooms (%)
Rooms in renter-occupied houses - 6 rooms (%)
Rooms in renter-occupied houses - 7 rooms (%)
Rooms in renter-occupied houses - 8 rooms (%)
Rooms in renter-occupied houses - 9+ rooms (%)
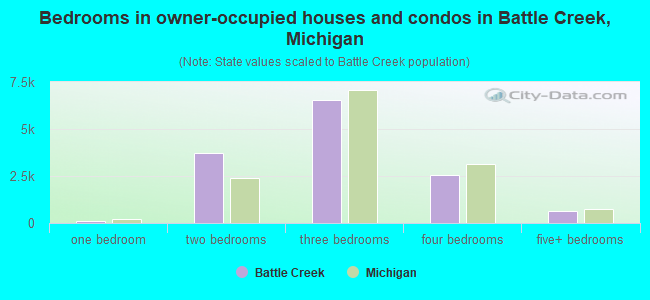
Bedrooms in owner-occupied houses - no bedrooms (%)
Bedrooms in owner-occupied houses - 1 bedroom (%)
Bedrooms in owner-occupied houses - 2 bedrooms (%)
Bedrooms in owner-occupied houses - 3 bedrooms (%)
Bedrooms in owner-occupied houses - 4 bedrooms (%)
Bedrooms in owner-occupied houses - 5+ bedrooms (%)
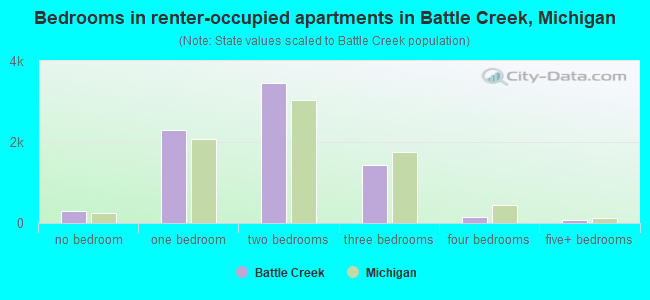
Bedrooms in renter-occupied houses - no bedrooms (%)
Bedrooms in renter-occupied houses - 1 bedroom (%)
Bedrooms in renter-occupied houses - 2 bedrooms (%)
Bedrooms in renter-occupied houses - 3 bedrooms (%)
Bedrooms in renter-occupied houses - 4 bedrooms (%)
Bedrooms in renter-occupied houses - 5+ bedrooms (%)
Vehicles available in owner-occupied houses - no vehicle available (%)
Vehicles available in owner-occupied houses - 1 vehicle available(%)
Vehicles available in owner-occupied houses - 2 Vehicles available (%)
Vehicles available in owner-occupied houses - 3 Vehicles available (%)
Vehicles available in owner-occupied houses - 4 Vehicles available (%)
Vehicles available in owner-occupied houses - 5+ Vehicles available (%)
Vehicles available in renter-occupied houses - no vehicle available (%)
Vehicles available in renter-occupied houses - 1 vehicle available (%)
Vehicles available in renter-occupied houses - 2 Vehicles available (%)
Vehicles available in renter-occupied houses - 3 Vehicles available (%)
Vehicles available in renter-occupied houses - 4 Vehicles available (%)
Vehicles available in renter-occupied houses - 5+ Vehicles available (%)
Housing units in structures - 1, detached (%)
Housing units in structures - 1, attached (%)
Housing units in structures - 2 (%)
Housing units in structures - 3 or 4 (%)
Housing units in structures - 5 to 9 (%)
Housing units in structures - 10 to 19 (%)
Housing units in structures - 20 to 49 (%)
Housing units in structures - 50 or more (%)
Housing units in structures - Mobile home (%)
Housing units in structures - Boat, RV, van, etc. (%)
Housing units in structures - Owners - 1, detached (%)
Housing units in structures - Owners - 1, attached (%)
Housing units in structures - Owners - 2 (%)
Housing units in structures - Owners - 3 or 4 (%)
Housing units in structures - Owners - 5 to 9 (%)
Housing units in structures - Owners - 10 to 19 (%)
Housing units in structures - Owners - 20 to 49 (%)
Housing units in structures - Owners - 50 or more (%)
Housing units in structures - Owners - Mobile home (%)
Housing units in structures - Owners - Boat, RV, van, etc. (%)
Housing units in structures - Renters - 1, detached (%)
Housing units in structures - Renters - 1, attached (%)
Housing units in structures - Renters - 2 (%)
Housing units in structures - Renters - 3 or 4 (%)
Housing units in structures - Renters - 5 to 9 (%)
Housing units in structures - Renters - 10 to 19 (%)
Housing units in structures - Renters - 20 to 49 (%)
Housing units in structures - Renters - 50 or more (%)
Housing units in structures - Renters - Mobile home (%)
Housing units in structures - Renters - Boat, RV, van, etc. (%)
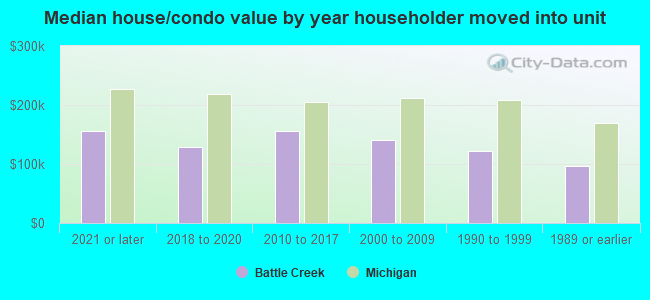
House/condo owner moved in on average (years ago)
Renter moved in on average (years ago)
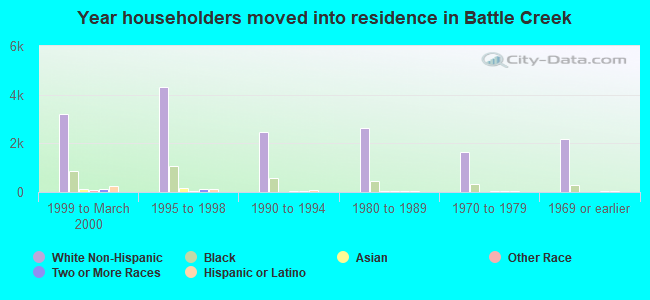
Year householder moved into unit - Moved in 1999 to March 2000 (%)
Year householder moved into unit - Moved in 1999 to March 2000 (%) - White
Year householder moved into unit - Moved in 1999 to March 2000 (%) - Black or African American
Year householder moved into unit - Moved in 1999 to March 2000 (%) - Asian
Year householder moved into unit - Moved in 1999 to March 2000 (%) - Hispanic or Latino
Year householder moved into unit - Moved in 1999 to March 2000 (%) - American Indian and Alaska Native
Year householder moved into unit - Moved in 1999 to March 2000 (%) - Multirace
Year householder moved into unit - Moved in 1999 to March 2000 (%) - Other Race
Year householder moved into unit - Moved in 1995 to 1998 (%)
Year householder moved into unit - Moved in 1995 to 1998 (%) - White
Year householder moved into unit - Moved in 1995 to 1998 (%) - Black or African American
Year householder moved into unit - Moved in 1995 to 1998 (%) - Asian
Year householder moved into unit - Moved in 1995 to 1998 (%) - Hispanic or Latino
Year householder moved into unit - Moved in 1995 to 1998 (%) - American Indian and Alaska Native
Year householder moved into unit - Moved in 1995 to 1998 (%) - Multirace
Year householder moved into unit - Moved in 1995 to 1998 (%) - Other Race
Year householder moved into unit - Moved in 1990 to 1994 (%)
Year householder moved into unit - Moved in 1990 to 1994 (%) - White
Year householder moved into unit - Moved in 1990 to 1994 (%) - Black or African American
Year householder moved into unit - Moved in 1990 to 1994 (%) - Asian
Year householder moved into unit - Moved in 1990 to 1994 (%) - Hispanic or Latino
Year householder moved into unit - Moved in 1990 to 1994 (%) - American Indian and Alaska Native
Year householder moved into unit - Moved in 1990 to 1994 (%) - Multirace
Year householder moved into unit - Moved in 1990 to 1994 (%) - Other Race
Year householder moved into unit - Moved in 1980 to 1989 (%)
Year householder moved into unit - Moved in 1980 to 1989 (%) - White
Year householder moved into unit - Moved in 1980 to 1989 (%) - Black or African American
Year householder moved into unit - Moved in 1980 to 1989 (%) - Asian
Year householder moved into unit - Moved in 1980 to 1989 (%) - Hispanic or Latino
Year householder moved into unit - Moved in 1980 to 1989 (%) - American Indian and Alaska Native
Year householder moved into unit - Moved in 1980 to 1989 (%) - Multirace
Year householder moved into unit - Moved in 1980 to 1989 (%) - Other Race
Year householder moved into unit - Moved in 1970 to 1979 (%)
Year householder moved into unit - Moved in 1970 to 1979 (%) - White
Year householder moved into unit - Moved in 1970 to 1979 (%) - Black or African American
Year householder moved into unit - Moved in 1970 to 1979 (%) - Asian
Year householder moved into unit - Moved in 1970 to 1979 (%) - Hispanic or Latino
Year householder moved into unit - Moved in 1970 to 1979 (%) - American Indian and Alaska Native
Year householder moved into unit - Moved in 1970 to 1979 (%) - Multirace
Year householder moved into unit - Moved in 1970 to 1979 (%) - Other Race
Year householder moved into unit - Moved in 1969 or earlier (%)
Year householder moved into unit - Moved in 1969 or earlier (%) - White
Year householder moved into unit - Moved in 1969 or earlier (%) - Black or African American
Year householder moved into unit - Moved in 1969 or earlier (%) - Asian
Year householder moved into unit - Moved in 1969 or earlier (%) - Hispanic or Latino
Year householder moved into unit - Moved in 1969 or earlier (%) - American Indian and Alaska Native
Year householder moved into unit - Moved in 1969 or earlier (%) - Multirace
Year householder moved into unit - Moved in 1969 or earlier (%) - Other Race
Housing units lacking complete plumbing facilities (%)
Housing units lacking complete kitchen facilities (%)
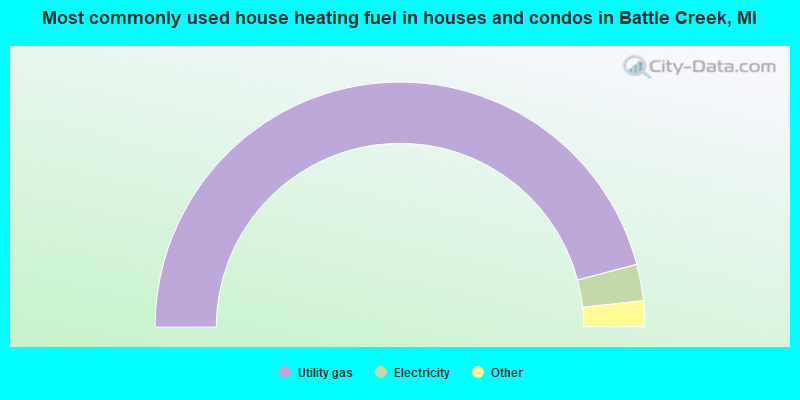
House heating fuel used in houses and condos - Utility gas (%)
House heating fuel used in houses and condos - Bottled, tank, or LP gas (%)
House heating fuel used in houses and condos - Electricity (%)
House heating fuel used in houses and condos - Fuel oil, kerosene, etc. (%)
House heating fuel used in houses and condos - Coal or coke (%)
House heating fuel used in houses and condos - Wood (%)
House heating fuel used in houses and condos - Solar energy (%)
House heating fuel used in houses and condos - Other fuel (%)
House heating fuel used in houses and condos - No fuel used (%)
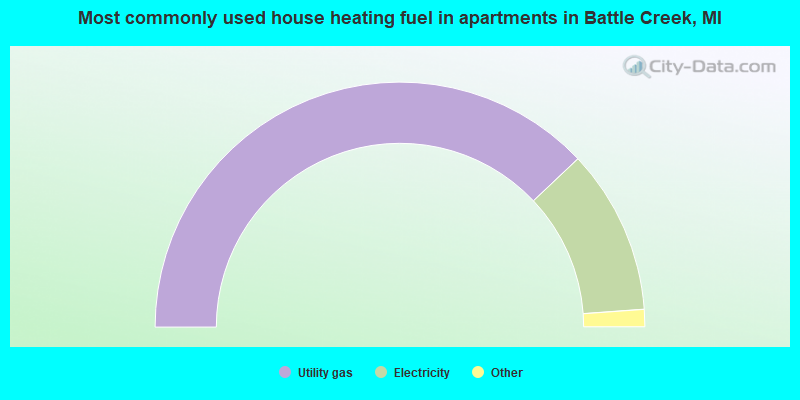
House heating fuel used in apartments - Utility gas (%)
House heating fuel used in apartments - Bottled, tank, or LP gas (%)
House heating fuel used in apartments - Electricity (%)
House heating fuel used in apartments - Fuel oil, kerosene, etc. (%)
House heating fuel used in apartments - Coal or coke (%)
House heating fuel used in apartments - Wood (%)
House heating fuel used in apartments - Solar energy (%)
House heating fuel used in apartments - Other fuel (%)
House heating fuel used in apartments - No fuel used (%)
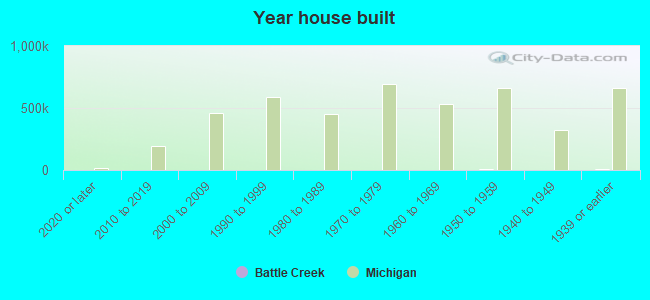
Median year house/condo built: 1952Median year apartment built: 1974Household type by relationship:
Households: 52,186
Male householders: 9,667 (3,617 living alone ), Female householders: 11,358 (4,181 living alone )6,860 spouses (6,809 opposite-sex spouses ), 1,976 unmarried partners , (1,869 opposite-sex unmarried partners ), 16,859 children (16,027 natural , 249 adopted , 582 stepchildren ), 1,360 grandchildren , 467 brothers or sisters , 532 parents , 43 foster children , 562 other relatives , 1,326 non-relatives In group quarters: 1,169
Size of family households: 5,080 2-persons , 2,808 3-persons , 2,375 4-persons , 1,014 5-persons , 509 6-persons , 170 7-or-more-persons .
Size of nonfamily households: 8,098 1-person , 1,052 2-persons , 168 3-persons , 16 4-persons , 13 5-persons .
5,784 married couples with children. single-parent households (691 men , 5,563 women ).
88.6% of residents of Battle Creek speak English at home. of residents speak Spanish at home (64% speak English very well , 17% speak English well , 10% speak English not well , 9% don't speak English at all ).of residents speak other Indo-European language at home (72% speak English very well , 17% speak English well , 11% speak English not well ).of residents speak Asian or Pacific Island language at home (48% speak English very well , 32% speak English well , 11% speak English not well , 9% don't speak English at all ).of residents speak other language at home (70% speak English very well , 30% speak English well ).
Foreign born population: 3,808 (7.3%)of them are naturalized citizens )
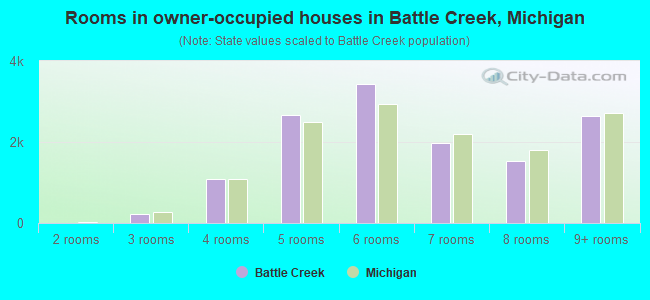
Median number of rooms in houses and condos:
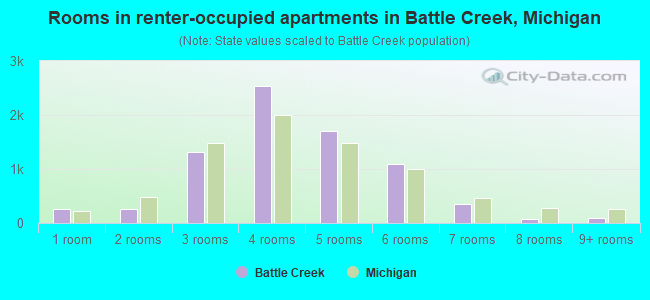
Median number of rooms in apartments
Owner-occupied Renter-occupied
Rooms in owner-occupied houses in Battle Creek, Michigan
0 1 room 0 2 rooms 220 3 rooms 1,089 4 rooms 2,672 5 rooms 3,437 6 rooms 1,984 7 rooms 1,525 8 rooms 2,654 9+ rooms
Rooms in renter-occupied apartments in Battle Creek, Michigan
257 1 room 259 2 rooms 1,316 3 rooms 2,533 4 rooms 1,712 5 rooms 1,101 6 rooms 356 7 rooms 72 8 rooms 89 9+ rooms
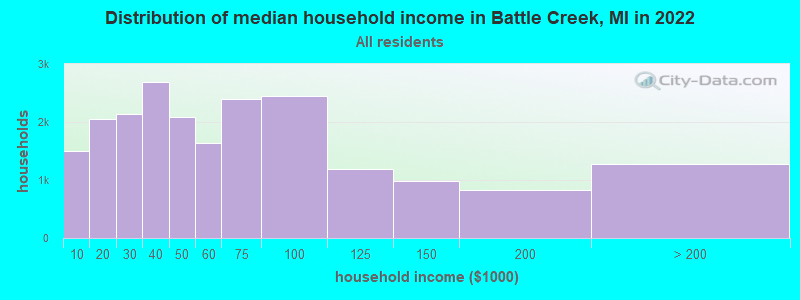
Battle Creek, MI household income distribution 1,492 Less than $10,0002,059 $10,000 to $19,9992,143 $20,000 to $29,9992,684 $30,000 to $39,9992,091 $40,000 to $49,9991,645 $50,000 to $59,9992,394 $60,000 to $74,9992,441 $75,000 to $99,9991,196 $100,000 to $124,999984 $125,000 to $149,999829 $150,000 to $199,9991,273 $200,000 or more
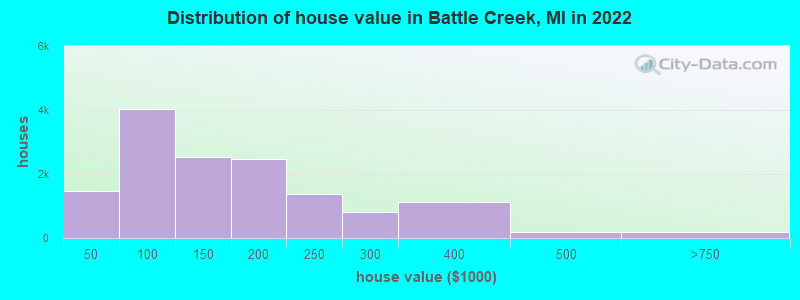
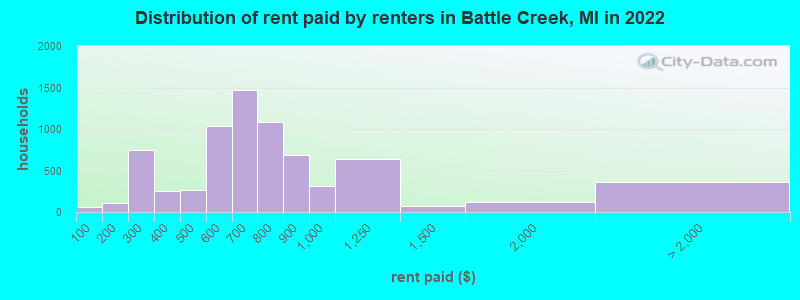
Home value of owner - occupied houses in 2022 in Battle Creek, MI 100 Less than $10,00074 $10,000 to $14,999136 $15,000 to $19,999248 $20,000 to $24,999216 $25,000 to $29,999257 $30,000 to $34,999170 $35,000 to $39,999273 $40,000 to $49,999958 $50,000 to $59,999385 $60,000 to $69,999548 $70,000 to $79,999932 $80,000 to $89,999934 $90,000 to $99,9991,405 $100,000 to $124,9991,128 $125,000 to $149,9991,764 $150,000 to $174,999697 $175,000 to $199,9991,378 $200,000 to $249,999802 $250,000 to $299,9991,127 $300,000 to $399,999194 $400,000 to $499,999129 $500,000 to $749,99944 $750,000 to $999,999Rent paid by renters in 2022 in Battle Creek, MI 55 Less than $10032 $100 to $14974 $150 to $199335 $200 to $249416 $250 to $299132 $300 to $349119 $350 to $399120 $400 to $449146 $450 to $499458 $500 to $549580 $550 to $599462 $600 to $6491,006 $650 to $699809 $700 to $749270 $750 to $799689 $800 to $899316 $900 to $999636 $1,000 to $1,24971 $1,250 to $1,499115 $1,500 to $1,99946 $2,000 to $2,49923 $2,500 to $2,9997 $3,000 to $3,49975 $3,500 or more203 No cash rent
Percentage of workers working in this county: 81.3%Number of people working at home: 2,234 (9.6% of all workers )
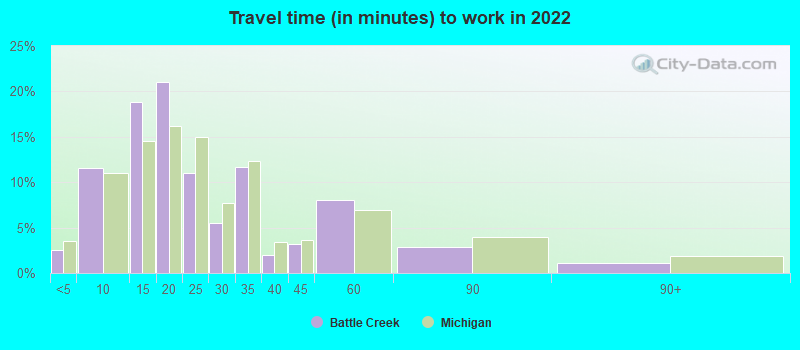
Travel time to work (commute)
Less than 5 minutes: 8465 to 9 minutes: 3,15210 to 14 minutes: 5,00315 to 19 minutes: 4,81220 to 24 minutes: 2,37725 to 29 minutes: 1,03530 to 34 minutes: 1,94135 to 39 minutes: 28240 to 44 minutes: 42045 to 59 minutes: 81760 to 89 minutes: 77690 or more minutes: 241
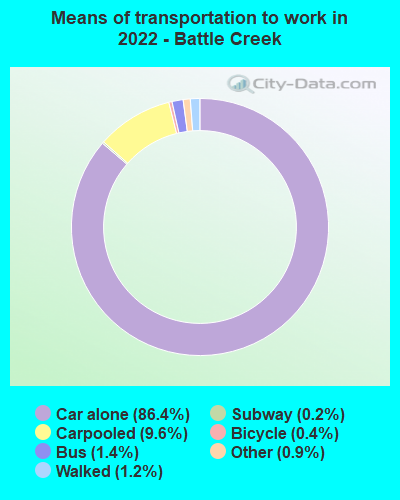
Means of transportation to work:
Drove a car alone: 28,758 (79.1%)Carpooled: 3,208 (8.8%)Bus : 371 (1.0%)Long-distance train or commuter rail : 29 (0.1%)Taxi: 365 (1.0%)Bicycle: 136 (0.4%)Walked: 407 (1.1%)Worked at home: 2,234 (6.1%)
Unemployment by race in 2022
Unemployment rate for White non-Hispanic residents 4.4% Males2.2% FemalesUnemployment rate for Black residents 15.0% Males20.4% FemalesUnemployment rate for Asian residents 1.7% Males4.1% FemalesUnemployment rate for other race residents 15.5% MalesUnemployment rate for two or more race residents 3.4% Males13.0% FemalesUnemployment rate for Hispanic or Latino residents 2.7% Males10.2% Females
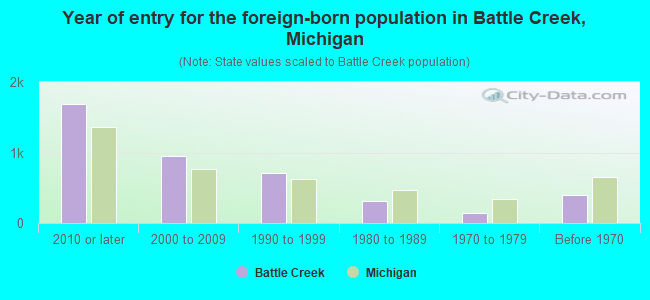
Year of entry for the foreign-born population in Battle Creek, Michigan
1,694 2010 or later 957 2000 to 2009 705 1990 to 1999 317 1980 to 1989 142 1970 to 1979 392 Before 1970
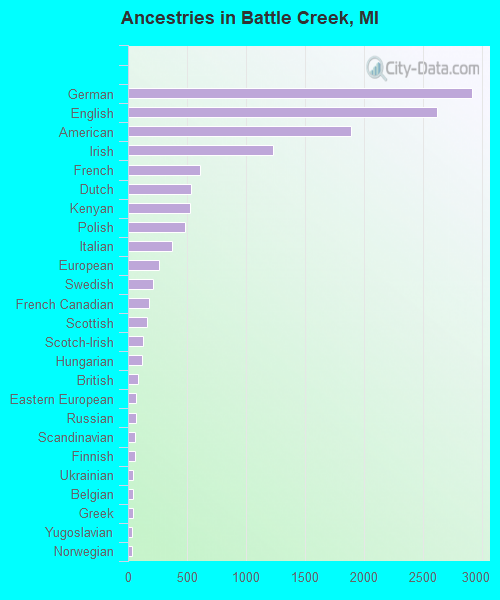
First ancestries reported:
German: 2,914 (11.2%)
English: 2,621 (10.0%)
American: 1,888 (7.2%)
Irish: 1,233 (4.7%)
French: 610 (2.3%)
Dutch: 534 (2.0%)
Kenyan: 522 (2.0%)
Polish: 485 (1.9%)
Italian: 373 (1.4%)
European: 264 (1.0%)
Swedish: 211 (0.8%)
French Canadian: 182 (0.7%)
Scottish: 162 (0.6%)
Scotch-Irish: 123 (0.5%)
Hungarian: 120 (0.5%)
British: 82 (0.3%)
Eastern European: 70 (0.3%)
Russian: 64 (0.2%)
Scandinavian: 61 (0.2%)
Finnish: 58 (0.2%)
Ukrainian: 45 (0.2%)
Belgian: 42 (0.2%)
Greek: 42 (0.2%)
Yugoslavian: 37 (0.1%)
Norwegian: 31 (0.1%)
Romanian: 28 (0.1%)
Portuguese: 27 (0.1%)
Welsh: 24 (0.09%)
Croatian: 21 (0.08%)
Slovene: 15 (0.06%)
Pennsylvania German: 13 (0.05%)
Canadian: 12 (0.05%)
Ethiopian: 9 (0.03%)
Maltese: 9 (0.03%)
Iraqi: 8 (0.03%)
Jamaican: 8 (0.03%)
Northern European: 7 (0.03%)
Swiss: 6 (0.02%)
Celtic: 5 (0.02%) Most common places of birth for foreign-born residents (%): Burma (Myanmar) Battle Creek:
28.6% (1,099)Michigan:
0.6% (4,087)
Mexico Battle Creek:
24.0% (922)Michigan:
10.9% (75,965)
Kenya Battle Creek:
8.6% (331)Michigan:
0.3% (1,965)
India Battle Creek:
6.3% (244)Michigan:
11.1% (77,240)
Sweden Battle Creek:
4.6% (176)Michigan:
0.1% (751)
Malaysia Battle Creek:
4.0% (155)Michigan:
0.2% (1,331)
Germany Battle Creek:
3.3% (128)Michigan:
2.3% (16,126)
China, excluding Hong Kong and Taiwan Battle Creek:
2.1% (79)Michigan:
4.9% (34,295)
Bangladesh Battle Creek:
2.0% (77)Michigan:
2.6% (18,065)
Japan Battle Creek:
1.8% (68)Michigan:
1.5% (10,225)
Vietnam Battle Creek:
1.7% (67)Michigan:
1.8% (12,679)
Korea Battle Creek:
1.6% (60)Michigan:
3.0% (20,884)
Place of birth for U.S.-born residents:
This state: 37,961Other state: 9,982Northeast: 913Midwest: 4,523South: 3,414West: 1,129 87.2% of Battle Creek residents lived in the same house 1 years ago.
Out of people who lived in different houses, 40.6% lived in this county.
Out of people who lived in different counties, 71.6% lived in Michigan.
Battle Creek:
87.2%State average:
88.4%
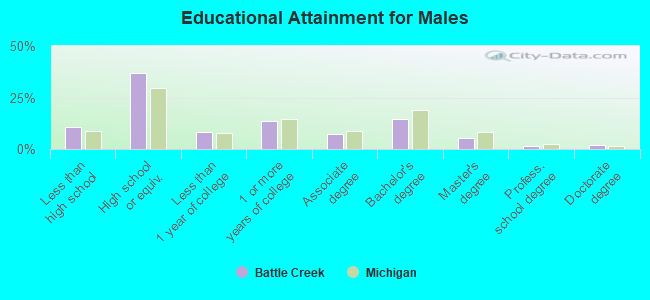
Education attainment for males 25 years and older:
No schooling: 364Nursery to 4th grade: 05th and 6th grade: 657th and 8th grade: 539th grade: 27310th grade: 47711th grade: 30412th grade, no diploma: 241High school graduate (or equivalency): 6,167Less than 1 year of college: 1,365Some college more than 1 year, no degree: 2,289Associate degree: 1,218Bachelor's degree: 2,453Master's degree: 925Professional school degree: 208Doctorate degree: 320
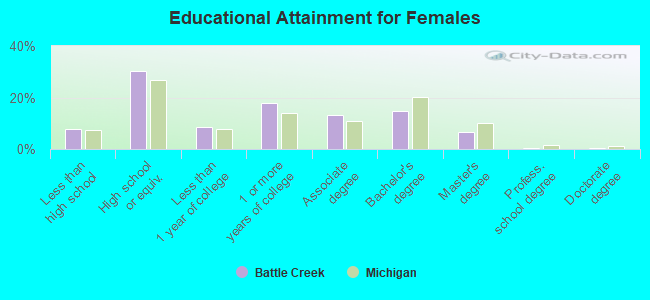
Education attainment for females 25 years and older:
No schooling: 182Nursery to 4th grade: 695th and 6th grade: 567th and 8th grade: 1119th grade: 8010th grade: 33911th grade: 34812th grade, no diploma: 229High school graduate (or equivalency): 5,607Less than 1 year of college: 1,589Some college more than 1 year, no degree: 3,299Associate degree: 2,430Bachelor's degree: 2,749Master's degree: 1,184Professional school degree: 64Doctorate degree: 99
Housing units in structures:
One, detached: 16,037One, attached: 217Two: 1,0063 or 4: 9695 to 9: 83810 to 19: 1,32320 to 49: 1,31650 or more: 1,577Mobile homes: 493Median worth of mobile homes: $35,699
Housing units lacking complete plumbing facilities in 2022: 1.2%Housing units lacking complete kitchen facilities in 2022: 2.1%House/condo owner moved in on average 10 years ago
Renter moved in on average 3 years ago
Private vs. public school enrollment:
Students in private schools in grades 1 to 8 (elementary and middle school): 389 Students in private schools in grades 9 to 12 (high school): 113 Students in private undergraduate colleges: 117