Bangor, ME (Maine) Houses and Residents
| Bangor: | $216,445 |
| Maine: | $290,600 |
Mean price in 2022:
Detached houses: $272,059
Here: $272,059 State: $364,324 Townhouses or other attached units: $202,289
Here: $202,289 State: $496,775 In 2-unit structures: $236,053
Here: $236,053 State: $349,654 In 3-to-4-unit structures: $181,735
Here: $181,735 State: $366,418 In 5-or-more-unit structures: $351,611
Here: $351,611 State: $342,001 Mobile homes: $54,367
Here: $54,367 State: $142,980
Total population: 32,568 (Urban population: 29,720, Rural population: 1,753 (137 farm, 1,616 nonfarm))
Houses: 15,538 (14,079 occupied: 6,720 owner occupied, 7,756 renter occupied)
| % of renters here: | 54% |
| State: | 26% |
Housing density: 451 houses/condos per square mile
Median price asked for vacant for-sale houses and condos in 2022: $337,047.
Median contract rent in 2022: $890 (lower quartile is $693, upper quartile is $1,115)
Median rent asked for vacant for-rent units in 2022: $939
Median gross rent in Bangor, ME in 2022: $933
Housing units in Bangor with a mortgage: 3,986 (643 second mortgage, 0 home equity loan, 643 both second mortgage and home equity loan)
Houses without a mortgage: 46
Median household income for houses/condos with a mortgage: $112,831
Median household income for apartments without a mortgage: $63,172
Median monthly housing costs: $1,016
Compare current foreclosures near Bangor, ME:
| Photo | Address | Area | Beds / Baths | Price | Details |
|---|---|---|---|---|---|

|
#1
Hancock St
Bangor, ME 04401
|
1,736 sq. feet
|
1 baths 4 beds |
show details | |

|
#2
Ohio St
Bangor, ME 04401
|
1,628 sq. feet
|
1 baths 4 beds |
show details | |

|
#3
Billings Rd
Bangor, ME 04401
|
1,512 sq. feet
|
2 baths 3 beds |
show details | |

|
#4
Sugarloaf Ln
Bangor, ME 04401
|
1,421 sq. feet
|
2 baths 3 beds |
show details | |

|
#5
Wing Rd
Bangor, ME 04401
|
1,680 sq. feet
|
2 baths 3 beds |
show details | |

|
#6
Union St
Bangor, ME 04401
|
1,857 sq. feet
|
2 baths 3 beds |
show details | |

|
#7
Warren St
Bangor, ME 04401
|
2,842 sq. feet
|
3 baths 5 beds |
show details | |

|
#8
Main St
Bangor, ME 04401
|
2,232 sq. feet
|
2 baths 3 beds |
show details | |

|
#9
Elm St
Bangor, ME 04401
|
1,718 sq. feet
|
2 baths 4 beds |
show details | |

|
#10
Savage St
Bangor, ME 04401
|
1,582 sq. feet
|
2 baths 4 beds |
show details |
| Photo | Address | Area | Beds / Baths | Price | Details |
|---|---|---|---|---|---|

|
#11
Fruit St
Bangor, ME 04401
|
1,224 sq. feet
|
1 baths 2 beds |
show details | |

|
#12
Billings Rd
Bangor, ME 04401
|
864 sq. feet
|
2 baths 4 beds |
show details | |

|
#13
Maple St
Bangor, ME 04401
|
1,926 sq. feet
|
3 baths 4 beds |
show details | |

|
#14
Allen St
Bangor, ME 04401
|
1,200 sq. feet
|
1 baths 3 beds |
show details | |

|
#15
Grove St
Bangor, ME 04401
|
910 sq. feet
|
1 baths 3 beds |
show details | |

|
#16
Stillwater Ave
Bangor, ME 04401
|
- sq. feet
|
- baths - beds |
show details | |

|
#17
Cedar St Apt 4
Bangor, ME 04401
|
- sq. feet
|
- baths - beds |
show details | |

|
#18
Union St
Bangor, ME 04401
|
924 sq. feet
|
- baths - beds |
show details | |

|
#19
Davenport St
Milford, ME 04461
|
1,200 sq. feet
|
2 baths 3 beds |
$269,900
|
show details |
|
|
#20
York Rd
Bangor, ME 04401
|
- sq. feet
|
- baths - beds |
show details |
| Photo | Address | Area | Beds / Baths | Price | Details |
|---|---|---|---|---|---|

|
#21
Cedar Breeze N
Bangor, ME 04401
|
- sq. feet
|
- baths - beds |
show details | |

|
#22
Main St
Bangor, ME 04401
|
- sq. feet
|
- baths - beds |
show details | |

|
#23
Luckys Landing Rd
Bangor, ME 04401
|
- sq. feet
|
- baths - beds |
show details | |

|
#24
Leavitt Ln
Bangor, ME 04401
|
- sq. feet
|
- baths - beds |
show details | |

|
#25
Kenduskeag Ave # 24
Bangor, ME 04401
|
- sq. feet
|
- baths - beds |
show details | |

|
#26
Ash Ln
Bangor, ME 04401
|
- sq. feet
|
- baths - beds |
show details | |

|
#27
Bog Rd
Hampden, ME 04444
|
1,512 sq. feet
|
3 baths 5 beds |
show details | |

|
#28
Western Ave
Hampden, ME 04444
|
1,825 sq. feet
|
1 baths 3 beds |
show details | |

|
#29
State Route 46
Bucksport, ME 04416
|
1,152 sq. feet
|
1 baths 1 beds |
show details | |

|
#30
Kenduskeag Levant Rd
Kenduskeag, ME 04450
|
- sq. feet
|
2 baths 3 beds |
show details |
| Photo | Address | Area | Beds / Baths | Price | Details |
|---|---|---|---|---|---|

|
#31
Kirkland Rd
Old Town, ME 04468
|
864 sq. feet
|
1 baths 2 beds |
show details | |

|
#32
Upper Cross Rd
Hudson, ME 04449
|
1,344 sq. feet
|
2 baths 3 beds |
show details | |

|
#33
Western Ave
Hampden, ME 04444
|
1,976 sq. feet
|
2 baths 4 beds |
show details | |

|
#34
Union St
Levant, ME 04456
|
1,538 sq. feet
|
1 baths 4 beds |
show details | |

|
#35
Lincoln St
Old Town, ME 04468
|
725 sq. feet
|
1 baths 3 beds |
show details | |

|
#36
Bennoch Rd
Old Town, ME 04468
|
1,244 sq. feet
|
3 baths 4 beds |
show details | |

|
#37
Maple St
Milford, ME 04461
|
1,512 sq. feet
|
2 baths 3 beds |
show details | |

|
#38
Dartmouth St
Old Town, ME 04468
|
2,555 sq. feet
|
3 baths 6 beds |
show details | |

|
#39
Foxtail Ln
Levant, ME 04456
|
1,190 sq. feet
|
2 baths 3 beds |
show details | |

|
#40
Hinks St
Bucksport, ME 04416
|
1,320 sq. feet
|
1 baths 4 beds |
show details |
| Photo | Address | Area | Beds / Baths | Price | Details |
|---|---|---|---|---|---|

|
#41
Main St
Bradley, ME 04411
|
1,944 sq. feet
|
2 baths 3 beds |
show details | |

|
#42
N Main St
Brewer, ME 04412
|
1,004 sq. feet
|
1 baths 3 beds |
show details | |

|
#43
Church St
Brewer, ME 04412
|
2,548 sq. feet
|
2 baths 3 beds |
show details | |

|
#44
E Summer St
Brewer, ME 04412
|
1,062 sq. feet
|
1 baths 2 beds |
show details | |

|
#45
Riverview Ter
Brewer, ME 04412
|
1,144 sq. feet
|
1 baths 3 beds |
show details | |

|
#46
Jefferson St
Brewer, ME 04412
|
1,088 sq. feet
|
2 baths 3 beds |
show details | |

|
#47
Stillwater Ave
Old Town, ME 04468
|
1,961 sq. feet
|
2 baths 4 beds |
show details | |

|
#48
Central St
Bucksport, ME 04416
|
- sq. feet
|
- baths - beds |
$63,000
|
show details |

|
#49
Century St
Brewer, ME 04412
|
1,652 sq. feet
|
2 baths 4 beds |
show details | |

|
Check over 1 million property listings on Foreclosure.com!
|
browse all offers | |||

Latest news about housing in Bangor, ME collected exclusively by city-data.com from local newspapers, TV, and radio stations

 | Renting in Bangor for two months (5 replies) |
| Looking to move outside Bangor with kids (6 replies) |
| Potential Move to Bangor (14 replies) |
| Apartments in Downtown Bangor? (4 replies) |
| Where would you live in Bangor? (7 replies) |
| Looking to rent and kind of at my wits end (1 reply) |

Median year apartment built: 1957
Household type by relationship:
Households: 31,926- Male householders: 6,204 (2,369 living alone), Female householders: 7,874 (3,374 living alone)
4,527 spouses (4,461 opposite-sex spouses), 1,389 unmarried partners, (1,344 opposite-sex unmarried partners), 6,997 children (6,099 natural, 333 adopted, 564 stepchildren), 230 grandchildren, 277 brothers or sisters, 307 parents, 8 foster children, 470 other relatives, 1,329 non-relatives
- In group quarters: 2,308
Size of family households: 3,241 2-persons, 1,976 3-persons, 1,263 4-persons, 570 5-persons, 113 6-persons, 44 7-or-more-persons.
Size of nonfamily households: 6,012 1-person, 1,090 2-persons, 23 3-persons, 92 4-persons, 17 5-persons.
2,797 married couples with children.
1,826 single-parent households (393 men, 1,433 women).
93.0% of residents of Bangor speak English at home.
1.5% of residents speak Spanish at home (74% speak English very well, 13% speak English well, 12% speak English not well).
2.8% of residents speak other Indo-European language at home (76% speak English very well, 14% speak English well, 10% speak English not well).
1.7% of residents speak Asian or Pacific Island language at home (64% speak English very well, 13% speak English well, 24% speak English not well).
1.2% of residents speak other language at home (64% speak English very well, 32% speak English well, 4% speak English not well).
Foreign born population: 1,689 (5.3%)
(47.1% of them are naturalized citizens)
| Here: | 6.6 |
| State: | 6.1 |
| Here: | 4.1 |
| State: | 4.0 |

- Bedrooms in owner-occupied houses and condos in Bangor, Maine
- 10no bedroom
- 1651 bedroom
- 1,7662 bedrooms
- 2,7783 bedrooms
- 1,6044 bedrooms
- 3985+ bedrooms

- Bedrooms in renter-occupied apartments in Bangor, Maine
- 529no bedroom
- 3,0021 bedroom
- 2,4512 bedrooms
- 1,4713 bedrooms
- 2104 bedrooms
- 935+ bedrooms

- Cars and other vehicles available in Bangor in owner-occupied houses/condos
- 116no vehicle
- 2,2551 vehicle
- 3,2152 vehicles
- 6523 vehicles
- 4324 vehicles
- 515+ vehicles

- Cars and other vehicles available in Bangor in renter-occupied apartments
- 2,017no vehicle
- 3,7871 vehicle
- 1,7622 vehicles
- 1393 vehicles
- 324 vehicles
- 195+ vehicles

- Rooms in owner-occupied houses in Bangor, Maine
- 101 room
- 02 rooms
- 3763 rooms
- 6564 rooms
- 1,0005 rooms
- 1,0086 rooms
- 1,1077 rooms
- 1,0028 rooms
- 1,5609+ rooms

- Rooms in renter-occupied apartments in Bangor, Maine
- 4391 room
- 8182 rooms
- 1,8133 rooms
- 1,6854 rooms
- 1,4015 rooms
- 1,0046 rooms
- 2687 rooms
- 1748 rooms
- 1549+ rooms


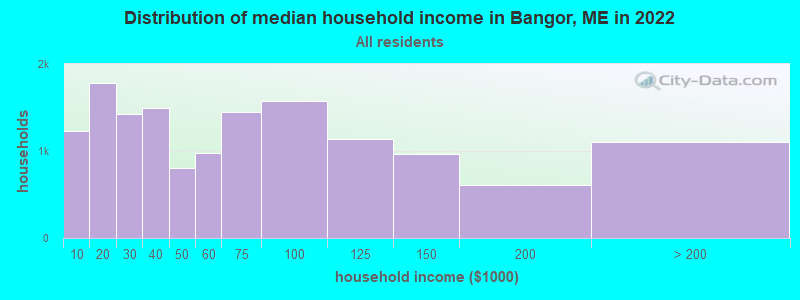
Bangor, ME household income distribution

- 1,234Less than $10,000
- 1,784$10,000 to $19,999
- 1,422$20,000 to $29,999
- 1,489$30,000 to $39,999
- 800$40,000 to $49,999
- 978$50,000 to $59,999
- 1,444$60,000 to $74,999
- 1,572$75,000 to $99,999
- 1,143$100,000 to $124,999
- 960$125,000 to $149,999
- 611$150,000 to $199,999
- 1,105$200,000 or more
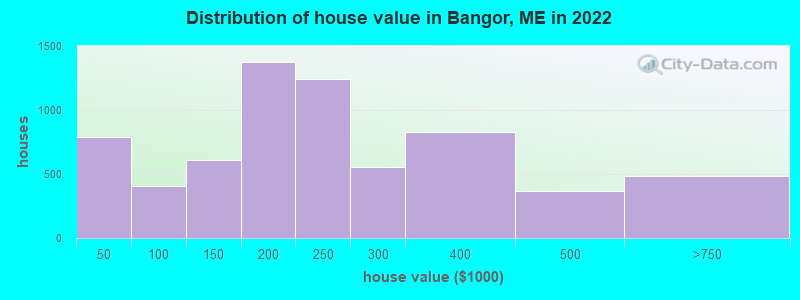
Home value of owner - occupied houses in 2022 in Bangor, ME
-
- 62Less than $10,000
- 91$10,000 to $14,999
- 65$15,000 to $19,999
- 40$20,000 to $24,999
- 135$25,000 to $29,999
- 106$30,000 to $34,999
- 87$35,000 to $39,999
- 196$40,000 to $49,999
- 28$50,000 to $59,999
- 25$60,000 to $69,999
- 8$70,000 to $79,999
- 84$80,000 to $89,999
- 65$90,000 to $99,999
- 243$100,000 to $124,999
- 365$125,000 to $149,999
- 753$150,000 to $174,999
- 622$175,000 to $199,999
- 1,241$200,000 to $249,999
- 552$250,000 to $299,999
- 832$300,000 to $399,999
- 369$400,000 to $499,999
- 474$500,000 to $749,999
- 14$1,000,000 to $1,499,999
Rent paid by renters in 2022 in Bangor, ME
-
- 78$150 to $199
- 24$200 to $249
- 213$250 to $299
- 201$300 to $349
- 121$350 to $399
- 158$400 to $449
- 189$450 to $499
- 53$500 to $549
- 100$550 to $599
- 387$600 to $649
- 165$650 to $699
- 590$700 to $749
- 334$750 to $799
- 1,503$800 to $899
- 1,161$900 to $999
- 1,366$1,000 to $1,249
- 577$1,250 to $1,499
- 457$1,500 to $1,999
- 39$2,000 to $2,499
- 63$2,500 to $2,999
- 13$3,000 to $3,499
- 78No cash rent


Percentage of workers working in this county: 93.5%
Number of people working at home: 1,474 (9.5% of all workers)
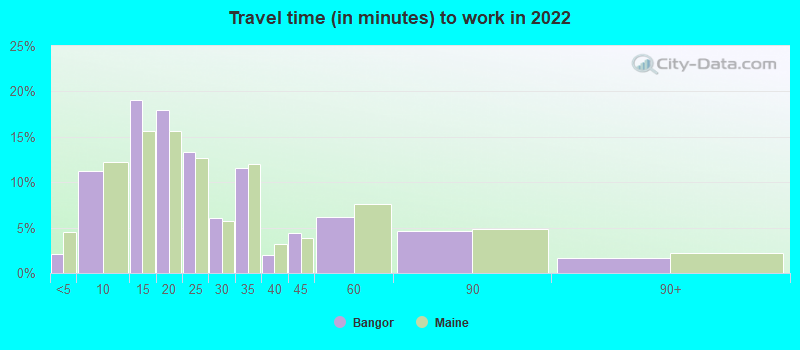
Travel time to work (commute)
- Less than 5 minutes: 408
- 5 to 9 minutes: 3,262
- 10 to 14 minutes: 4,792
- 15 to 19 minutes: 2,992
- 20 to 24 minutes: 928
- 25 to 29 minutes: 335
- 30 to 34 minutes: 612
- 35 to 39 minutes: 77
- 40 to 44 minutes: 75
- 45 to 59 minutes: 270
- 60 to 89 minutes: 264
- 90 or more minutes: 348
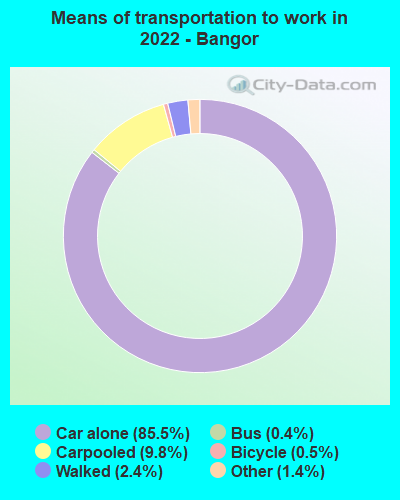
Means of transportation to work:
- Drove a car alone: 27,731 (80.2%)
- Carpooled: 3,191 (9.2%)
- Bus: 267 (0.8%)
- Taxi: 646 (1.9%)
- Bicycle: 291 (0.8%)
- Walked: 817 (2.4%)
- Worked at home: 1,474 (4.3%)

- Unemployment by race in 2022
- Unemployment rate for White non-Hispanic residents
- 4.0%Males
- 2.8%Females
- Unemployment rate for Black residents
- 7.6%Females
- Unemployment rate for two or more race residents
- 16.5%Males
- 7.2%Females

- Year of entry for the foreign-born population in Bangor, Maine
- 9392010 or later
- 3672000 to 2009
- 2021990 to 1999
- 1331980 to 1989
- 1011970 to 1979
- 367Before 1970
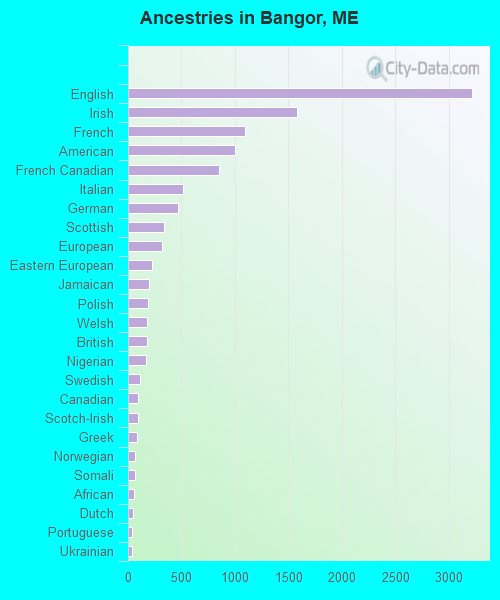
First ancestries reported:
- English: 3,214 (23.6%)
- Irish: 1,577 (11.6%)
- French: 1,096 (8.0%)
- American: 1,004 (7.4%)
- French Canadian: 848 (6.2%)
- Italian: 511 (3.8%)
- German: 468 (3.4%)
- Scottish: 339 (2.5%)
- European: 320 (2.3%)
- Eastern European: 227 (1.7%)
- Jamaican: 195 (1.4%)
- Polish: 183 (1.3%)
- Welsh: 179 (1.3%)
- British: 178 (1.3%)
- Nigerian: 165 (1.2%)
- Swedish: 110 (0.8%)
- Canadian: 91 (0.7%)
- Scotch-Irish: 90 (0.7%)
- Greek: 87 (0.6%)
- Norwegian: 70 (0.5%)
- Somali: 62 (0.5%)
- African: 52 (0.4%)
- Dutch: 47 (0.3%)
- Portuguese: 39 (0.3%)
- Ukrainian: 38 (0.3%)
- Scandinavian: 36 (0.3%)
- Russian: 30 (0.2%)
- Brazilian: 29 (0.2%)
- Ethiopian: 26 (0.2%)
- Celtic: 18 (0.1%)
- Albanian: 15 (0.1%)
- Bulgarian: 15 (0.1%)
- Swiss: 14 (0.1%)
- Arab: 11 (0.08%)
- Australian: 10 (0.07%)
- Hungarian: 7 (0.05%)
- Czech: 6 (0.04%)
- Trinidadian and Tobagonian: 6 (0.04%)
- Slovak: 4 (0.03%)
- Sudanese: 1 (0.01%)
- Haitian: 1 (0.01%)
Most common places of birth for foreign-born residents (%):
| Bangor: | 13.6% (226) |
| Maine: | 18.9% (9,810) |
| Bangor: | 11.4% (189) |
| Maine: | 1.8% (912) |
| Bangor: | 9.1% (151) |
| Maine: | 0.9% (446) |
| Bangor: | 7.6% (126) |
| Maine: | 1.2% (646) |
| Bangor: | 7.5% (124) |
| Maine: | 4.6% (2,392) |
| Bangor: | 5.4% (89) |
| Maine: | 0.4% (205) |
| Bangor: | 4.6% (77) |
| Maine: | 2.0% (1,031) |
| Bangor: | 4.1% (68) |
| Maine: | 4.0% (2,054) |
| Bangor: | 4.1% (68) |
| Maine: | 3.9% (2,005) |
| Bangor: | 3.4% (57) |
| Maine: | 1.1% (549) |
| Bangor: | 3.1% (52) |
| Maine: | 2.0% (1,031) |
| Bangor: | 2.7% (45) |
| Maine: | 0.8% (421) |
| Bangor: | 2.7% (45) |
| Maine: | 2.2% (1,146) |
| Bangor: | 1.9% (32) |
| Maine: | 0.2% (101) |
| Bangor: | 1.9% (32) |
| Maine: | 0.6% (306) |
| Bangor: | 1.5% (25) |
| Maine: | 1.1% (582) |
| Bangor: | 1.5% (25) |
| Maine: | 0.6% (286) |
Place of birth for U.S.-born residents:
- This state: 20,844
- Other state: 9,012
- Northeast: 5,552
- Midwest: 961
- South: 1,472
- West: 968
82.0% of Bangor residents lived in the same house 1 years ago.
Out of people who lived in different houses, 44.1% lived in this county.
Out of people who lived in different counties, 43.8% lived in Maine.
| Bangor: | 82.0% |
| State average: | 89.7% |
Education attainment for males 25 years and older:
- No schooling: 104
- Nursery to 4th grade: 1
- 5th and 6th grade: 22
- 7th and 8th grade: 36
- 9th grade: 107
- 10th grade: 112
- 11th grade: 68
- 12th grade, no diploma: 123
- High school graduate (or equivalency): 3,598
- Less than 1 year of college: 548
- Some college more than 1 year, no degree: 1,498
- Associate degree: 1,096
- Bachelor's degree: 2,390
- Master's degree: 699
- Professional school degree: 189
- Doctorate degree: 290

Education attainment for females 25 years and older:
- No schooling: 36
- Nursery to 4th grade: 6
- 5th and 6th grade: 4
- 7th and 8th grade: 29
- 9th grade: 131
- 10th grade: 42
- 11th grade: 173
- 12th grade, no diploma: 161
- High school graduate (or equivalency): 3,563
- Less than 1 year of college: 764
- Some college more than 1 year, no degree: 1,392
- Associate degree: 1,690
- Bachelor's degree: 2,585
- Master's degree: 1,162
- Professional school degree: 228
- Doctorate degree: 312


Housing units in structures:
- One, detached: 6,089
- One, attached: 710
- Two: 1,198
- 3 or 4: 2,983
- 5 to 9: 1,758
- 10 to 19: 474
- 20 to 49: 550
- 50 or more: 610
- Mobile homes: 1,163
Median worth of mobile homes: $44,911
Housing units lacking complete kitchen facilities in 2022: 3.8%
House/condo owner moved in on average 11 years ago
Renter moved in on average 3 years ago

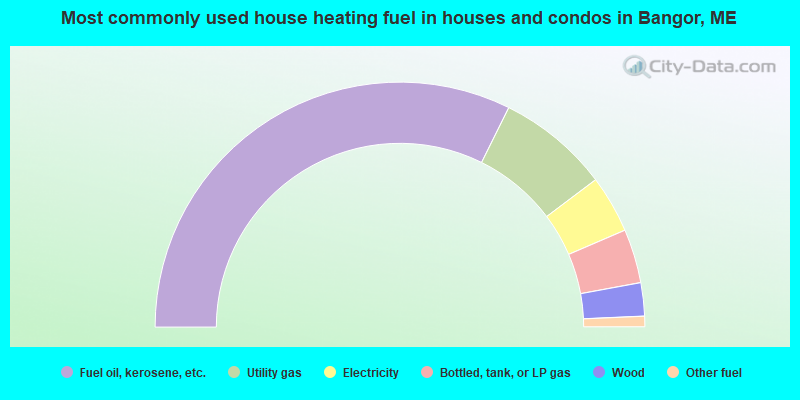
- 64.6%Fuel oil, kerosene, etc.
- 14.8%Utility gas
- 7.6%Electricity
- 7.1%Bottled, tank, or LP gas
- 4.4%Wood
- 1.4%Other fuel
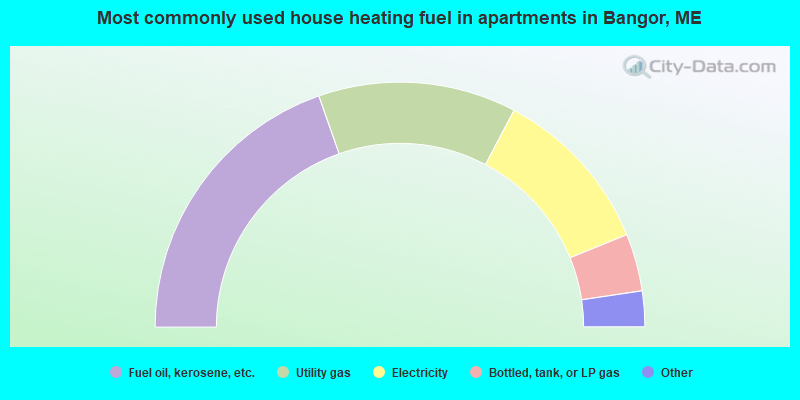
- 39.3%Fuel oil, kerosene, etc.
- 26.2%Utility gas
- 22.3%Electricity
- 7.6%Bottled, tank, or LP gas
- 2.5%No fuel used
- 1.9%Other fuel
- 0.3%Solar energy
Private vs. public school enrollment:
| Here: | 7.4% |
| Maine: | 12.7% |
| Here: | 8.7% |
| Maine: | 12.6% |
| Here: | 49.5% |
| Maine: | 34.5% |


