Baldwin, NY (New York) Houses and Residents
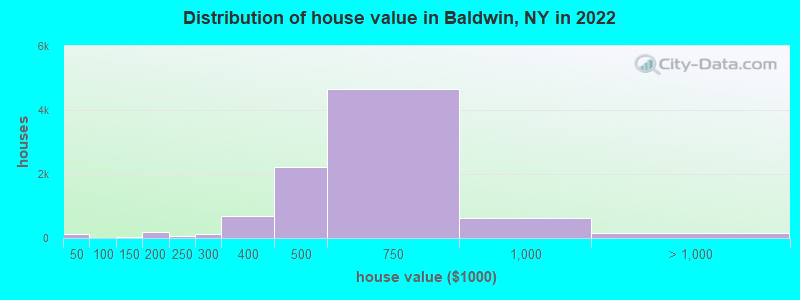
Estimated median house or condo value in 2022: $540,267 (it was $195,200 in 2000 )
Baldwin:
$540,267New York:
$400,400
Lower value quartile - upper value quartile: $461,711 - $678,483Mean price in 2022: Detached houses: $559,356 Here:
$559,356State:
$476,719
Townhouses or other attached units: $379,652 Here:
$379,652State:
$699,270
In 2-unit structures: $360,737 Here:
$360,737State:
$713,077
In 5-or-more-unit structures: $496,713 Here:
$496,713State:
$912,009
Total population: 24,033 (Urban population: 23,455, Rural population: 0)
Houses: 11,219 (10,874 occupied: 9,541 owner occupied, 1,313 renter occupied )
% of renters here:
12%State:
46%
Housing density: 3,805 houses/condos per square mile
Median price asked for vacant for-sale houses and condos in 2022: $475,383.
Median contract rent in 2022: $1,699 (lower quartile is $1,162, upper quartile is over $2,000)
Median rent asked for vacant for-rent units in 2022: $4,545
Median gross rent in Baldwin, NY in 2022: $1,769
Housing units in Baldwin with a mortgage: 7,173 (795 second mortgage, 0 home equity loan, 710 both second mortgage and home equity loan )Houses without a mortgage: 164
Median household income for houses/condos with a mortgage: $160,574
Median household income for apartments without a mortgage: $99,277
Median monthly housing costs: $2,840
Data:
Median house or condo value ($)
Median house or condo value ($ change since 2000)
Median house or condo value ($) - White
Median house or condo value ($) - Black or African American
Median house or condo value ($) - Asian
Median house or condo value ($) - Hispanic or Latino
Median house or condo value ($) - American Indian and Alaska Native
Median house or condo value ($) - Multirace
Median house or condo value ($) - Other Race
Median price asked for mobile homes ($)
Household density (households per square mile)
Mean house or condo value by units in structure - 1, detached ($)
Mean house or condo value by units in structure - 1, attached ($)
Mean house or condo value by units in structure - 2 ($)
Mean house or condo value by units in structure by units in structure - 3 or 4 ($)
Mean house or condo value by units in structure - 5 or more ($)
Mean house or condo value by units in structure - Boat, RV, van, etc. ($)
Mean house or condo value by units in structure - Mobile home ($)
Median contract rent ($)
Median contract rent - Lower quartile ($)
Median contract rent - Upper quartile ($)
Median gross rent ($)
Urban houses (%)
Rural houses (%)
Houses occupied (%)
Houses occupied (% change since 2000)
Houses owner occupied (%)
Houses owner occupied (% change since 2000)
Houses renter occupied (%)
Houses renter occupied (% change since 2000)
Vacant housing units - For rent (%)
Vacant housing units - For rent (% change since 2000)
Vacant housing units - For sale only (%)
Vacant housing units - For sale only (% change since 2000)
Vacant housing units - Rented or sold, not occupied (%)
Vacant housing units - Rented or sold, not occupied (% change since 2000)
Vacant housing units - For seasonal, recreational, or occasional use (%)
Vacant housing units - For seasonal, recreational, or occasional use (% change since 2000)
Vacant housing units - For migrant workers (%)
Vacant housing units - For migrant workers (% change since 2000)
Vacant housing units - Other vacant (%)
Vacant housing units - Other vacant (% change since 2000)
Median monthly housing costs ($)
Median household income for houses/condos with a mortgage ($)
Median household income for houses/condos without a mortgage ($)
Median household income ($)
Median household income ($) - White
Median household income ($) - Black or African American
Median household income ($) - Asian
Median household income ($) - Hispanic or Latino
Median household income ($) - American Indian and Alaska Native
Median household income ($) - Multirace
Median household income ($) - Other Race
Mortgage status - with mortgage (%)
Mortgage status - with second mortgage (%)
Mortgage status - with home equity loan (%)
Mortgage status - with both second mortgage and home equity loan (%)
Mortgage status - without a mortgage (%)
Median year house/condo built
Median year apartment built
Household type by relationship - Male householder living alone (%)
Household type by relationship - Male householder not living alone (%)
Household type by relationship - Female householder living alone (%)
Household type by relationship - Female householder not living alone (%)
Household type by relationship - Opposite-Sex spouse (%)
Household type by relationship - Same-Sex spouse (%)
Household type by relationship - Opposite-Sex unmarried partner (%)
Household type by relationship - Same-Sex unmarried partner (%)
Household type by relationship - In group quarters (%)
Size of family households - 2-person household (%)
Size of family households - 3-person household (%)
Size of family households - 4-person household (%)
Size of family households - 5-person household (%)
Size of family households - 6-person household (%)
Size of family households - 7-or-more-person household (%)
Size of nonfamily households - 1-person household (%)
Size of nonfamily households - 2-person household (%)
Size of nonfamily households - 3-person household (%)
Size of nonfamily households - 4-person household (%)
Size of nonfamily households - 5-person household (%)
Size of nonfamily households - 6-person household (%)
Size of nonfamily households - 7-or-moreperson household (%)
Year house built - Built 2010 or later (%)
Year house built - Built 2000 to 2009 (%)
Year house built - Built 1990 to 1999 (%)
Year house built - Built 1980 to 1989 (%)
Year house built - Built 1970 to 1979 (%)
Year house built - Built 1960 to 1969 (%)
Year house built - Built 1950 to 1959 (%)
Year house built - Built 1940 to 1949 (%)
Year house built - Built 1939 or earlier (%)
Median number of rooms in houses and condos
Median number of rooms in apartments
Median number of bedrooms in owner occupied houses
Mean number of bedrooms in owner occupied houses
Median number of bedrooms in renter occupied houses
Mean number of bedrooms in renter occupied houses
Median number of vehichles in owner occupied houses
Mean number of vehichles in owner occupied houses
Median number of vehichles in renter occupied houses
Mean number of vehichles in renter occupied houses
Rooms in owner-occupied houses - 1 room (%)
Rooms in owner-occupied houses - 2 rooms (%)
Rooms in owner-occupied houses - 3 rooms (%)
Rooms in owner-occupied houses - 4 rooms (%)
Rooms in owner-occupied houses - 5 rooms (%)
Rooms in owner-occupied houses - 6 rooms (%)
Rooms in owner-occupied houses - 7 rooms (%)
Rooms in owner-occupied houses - 8 rooms (%)
Rooms in owner-occupied houses - 9+ rooms (%)
Rooms in renter-occupied houses - 1 room (%)
Rooms in renter-occupied houses - 2 rooms (%)
Rooms in renter-occupied houses - 3 rooms (%)
Rooms in renter-occupied houses - 4 rooms (%)
Rooms in renter-occupied houses - 5 rooms (%)
Rooms in renter-occupied houses - 6 rooms (%)
Rooms in renter-occupied houses - 7 rooms (%)
Rooms in renter-occupied houses - 8 rooms (%)
Rooms in renter-occupied houses - 9+ rooms (%)
Bedrooms in owner-occupied houses - no bedrooms (%)
Bedrooms in owner-occupied houses - 1 bedroom (%)
Bedrooms in owner-occupied houses - 2 bedrooms (%)
Bedrooms in owner-occupied houses - 3 bedrooms (%)
Bedrooms in owner-occupied houses - 4 bedrooms (%)
Bedrooms in owner-occupied houses - 5+ bedrooms (%)
Bedrooms in renter-occupied houses - no bedrooms (%)
Bedrooms in renter-occupied houses - 1 bedroom (%)
Bedrooms in renter-occupied houses - 2 bedrooms (%)
Bedrooms in renter-occupied houses - 3 bedrooms (%)
Bedrooms in renter-occupied houses - 4 bedrooms (%)
Bedrooms in renter-occupied houses - 5+ bedrooms (%)
Vehicles available in owner-occupied houses - no vehicle available (%)
Vehicles available in owner-occupied houses - 1 vehicle available(%)
Vehicles available in owner-occupied houses - 2 Vehicles available (%)
Vehicles available in owner-occupied houses - 3 Vehicles available (%)
Vehicles available in owner-occupied houses - 4 Vehicles available (%)
Vehicles available in owner-occupied houses - 5+ Vehicles available (%)
Vehicles available in renter-occupied houses - no vehicle available (%)
Vehicles available in renter-occupied houses - 1 vehicle available (%)
Vehicles available in renter-occupied houses - 2 Vehicles available (%)
Vehicles available in renter-occupied houses - 3 Vehicles available (%)
Vehicles available in renter-occupied houses - 4 Vehicles available (%)
Vehicles available in renter-occupied houses - 5+ Vehicles available (%)
Housing units in structures - 1, detached (%)
Housing units in structures - 1, attached (%)
Housing units in structures - 2 (%)
Housing units in structures - 3 or 4 (%)
Housing units in structures - 5 to 9 (%)
Housing units in structures - 10 to 19 (%)
Housing units in structures - 20 to 49 (%)
Housing units in structures - 50 or more (%)
Housing units in structures - Mobile home (%)
Housing units in structures - Boat, RV, van, etc. (%)
Housing units in structures - Owners - 1, detached (%)
Housing units in structures - Owners - 1, attached (%)
Housing units in structures - Owners - 2 (%)
Housing units in structures - Owners - 3 or 4 (%)
Housing units in structures - Owners - 5 to 9 (%)
Housing units in structures - Owners - 10 to 19 (%)
Housing units in structures - Owners - 20 to 49 (%)
Housing units in structures - Owners - 50 or more (%)
Housing units in structures - Owners - Mobile home (%)
Housing units in structures - Owners - Boat, RV, van, etc. (%)
Housing units in structures - Renters - 1, detached (%)
Housing units in structures - Renters - 1, attached (%)
Housing units in structures - Renters - 2 (%)
Housing units in structures - Renters - 3 or 4 (%)
Housing units in structures - Renters - 5 to 9 (%)
Housing units in structures - Renters - 10 to 19 (%)
Housing units in structures - Renters - 20 to 49 (%)
Housing units in structures - Renters - 50 or more (%)
Housing units in structures - Renters - Mobile home (%)
Housing units in structures - Renters - Boat, RV, van, etc. (%)
House/condo owner moved in on average (years ago)
Renter moved in on average (years ago)
Year householder moved into unit - Moved in 1999 to March 2000 (%)
Year householder moved into unit - Moved in 1999 to March 2000 (%) - White
Year householder moved into unit - Moved in 1999 to March 2000 (%) - Black or African American
Year householder moved into unit - Moved in 1999 to March 2000 (%) - Asian
Year householder moved into unit - Moved in 1999 to March 2000 (%) - Hispanic or Latino
Year householder moved into unit - Moved in 1999 to March 2000 (%) - American Indian and Alaska Native
Year householder moved into unit - Moved in 1999 to March 2000 (%) - Multirace
Year householder moved into unit - Moved in 1999 to March 2000 (%) - Other Race
Year householder moved into unit - Moved in 1995 to 1998 (%)
Year householder moved into unit - Moved in 1995 to 1998 (%) - White
Year householder moved into unit - Moved in 1995 to 1998 (%) - Black or African American
Year householder moved into unit - Moved in 1995 to 1998 (%) - Asian
Year householder moved into unit - Moved in 1995 to 1998 (%) - Hispanic or Latino
Year householder moved into unit - Moved in 1995 to 1998 (%) - American Indian and Alaska Native
Year householder moved into unit - Moved in 1995 to 1998 (%) - Multirace
Year householder moved into unit - Moved in 1995 to 1998 (%) - Other Race
Year householder moved into unit - Moved in 1990 to 1994 (%)
Year householder moved into unit - Moved in 1990 to 1994 (%) - White
Year householder moved into unit - Moved in 1990 to 1994 (%) - Black or African American
Year householder moved into unit - Moved in 1990 to 1994 (%) - Asian
Year householder moved into unit - Moved in 1990 to 1994 (%) - Hispanic or Latino
Year householder moved into unit - Moved in 1990 to 1994 (%) - American Indian and Alaska Native
Year householder moved into unit - Moved in 1990 to 1994 (%) - Multirace
Year householder moved into unit - Moved in 1990 to 1994 (%) - Other Race
Year householder moved into unit - Moved in 1980 to 1989 (%)
Year householder moved into unit - Moved in 1980 to 1989 (%) - White
Year householder moved into unit - Moved in 1980 to 1989 (%) - Black or African American
Year householder moved into unit - Moved in 1980 to 1989 (%) - Asian
Year householder moved into unit - Moved in 1980 to 1989 (%) - Hispanic or Latino
Year householder moved into unit - Moved in 1980 to 1989 (%) - American Indian and Alaska Native
Year householder moved into unit - Moved in 1980 to 1989 (%) - Multirace
Year householder moved into unit - Moved in 1980 to 1989 (%) - Other Race
Year householder moved into unit - Moved in 1970 to 1979 (%)
Year householder moved into unit - Moved in 1970 to 1979 (%) - White
Year householder moved into unit - Moved in 1970 to 1979 (%) - Black or African American
Year householder moved into unit - Moved in 1970 to 1979 (%) - Asian
Year householder moved into unit - Moved in 1970 to 1979 (%) - Hispanic or Latino
Year householder moved into unit - Moved in 1970 to 1979 (%) - American Indian and Alaska Native
Year householder moved into unit - Moved in 1970 to 1979 (%) - Multirace
Year householder moved into unit - Moved in 1970 to 1979 (%) - Other Race
Year householder moved into unit - Moved in 1969 or earlier (%)
Year householder moved into unit - Moved in 1969 or earlier (%) - White
Year householder moved into unit - Moved in 1969 or earlier (%) - Black or African American
Year householder moved into unit - Moved in 1969 or earlier (%) - Asian
Year householder moved into unit - Moved in 1969 or earlier (%) - Hispanic or Latino
Year householder moved into unit - Moved in 1969 or earlier (%) - American Indian and Alaska Native
Year householder moved into unit - Moved in 1969 or earlier (%) - Multirace
Year householder moved into unit - Moved in 1969 or earlier (%) - Other Race
Housing units lacking complete plumbing facilities (%)
Housing units lacking complete kitchen facilities (%)
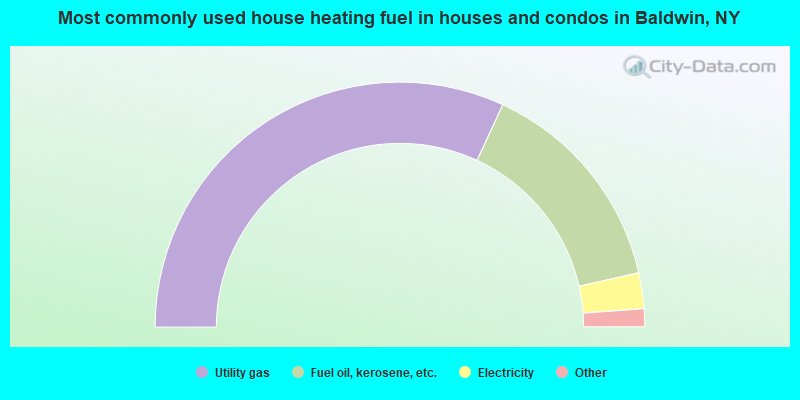
House heating fuel used in houses and condos - Utility gas (%)
House heating fuel used in houses and condos - Bottled, tank, or LP gas (%)
House heating fuel used in houses and condos - Electricity (%)
House heating fuel used in houses and condos - Fuel oil, kerosene, etc. (%)
House heating fuel used in houses and condos - Coal or coke (%)
House heating fuel used in houses and condos - Wood (%)
House heating fuel used in houses and condos - Solar energy (%)
House heating fuel used in houses and condos - Other fuel (%)
House heating fuel used in houses and condos - No fuel used (%)
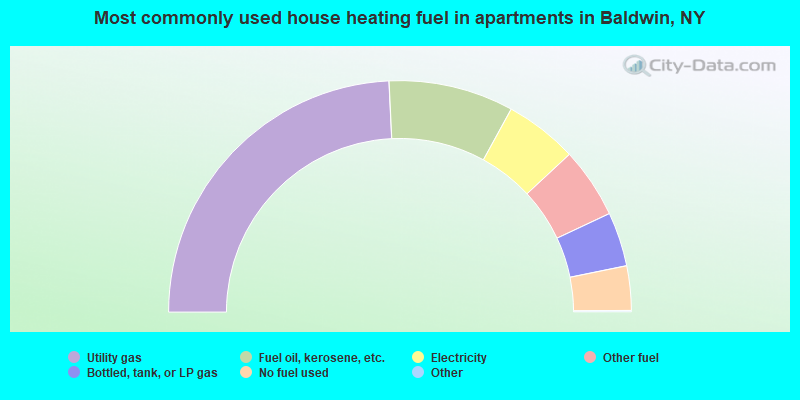
House heating fuel used in apartments - Utility gas (%)
House heating fuel used in apartments - Bottled, tank, or LP gas (%)
House heating fuel used in apartments - Electricity (%)
House heating fuel used in apartments - Fuel oil, kerosene, etc. (%)
House heating fuel used in apartments - Coal or coke (%)
House heating fuel used in apartments - Wood (%)
House heating fuel used in apartments - Solar energy (%)
House heating fuel used in apartments - Other fuel (%)
House heating fuel used in apartments - No fuel used (%)
Latest news about housing in Baldwin, NY collected exclusively by city-data.com from local newspapers, TV, and radio stations
Median year house/condo built: 1950Median year apartment built: 1948Household type by relationship:
Households: 33,643
Male householders: 5,054 (557 living alone ), Female householders: 5,726 (1,173 living alone )6,346 spouses (6,261 opposite-sex spouses ), 725 unmarried partners , (714 opposite-sex unmarried partners ), 11,911 children (11,489 natural , 136 adopted , 284 stepchildren ), 902 grandchildren , 322 brothers or sisters , 980 parents , 0 foster children , 1,143 other relatives , 425 non-relatives In group quarters: 106
Size of family households: 2,420 2-persons , 2,134 3-persons , 2,515 4-persons , 920 5-persons , 409 6-persons , 229 7-or-more-persons .
Size of nonfamily households: 1,805 1-person , 363 2-persons , 14 3-persons , 5 4-persons , 2 6-persons .
4,258 married couples with children. single-parent households (215 men , 1,216 women ).
73.0% of residents of Baldwin speak English at home. of residents speak Spanish at home (55% speak English very well , 22% speak English well , 21% speak English not well , 1% don't speak English at all ).of residents speak other Indo-European language at home (78% speak English very well , 18% speak English well , 2% speak English not well , 2% don't speak English at all ).of residents speak Asian or Pacific Island language at home (78% speak English very well , 4% speak English well , 18% speak English not well ).of residents speak other language at home (80% speak English very well , 6% speak English well , 14% speak English not well ).
Foreign born population: 8,928 (26.5%)of them are naturalized citizens )
Median number of rooms in houses and condos:
Median number of rooms in apartments
Baldwin, NY household income distribution 168 Less than $10,000502 $10,000 to $19,999371 $20,000 to $29,999303 $30,000 to $39,999332 $40,000 to $49,999125 $50,000 to $59,999739 $60,000 to $74,9991,586 $75,000 to $99,999987 $100,000 to $124,9991,020 $125,000 to $149,9991,775 $150,000 to $199,9992,986 $200,000 or more
Home value of owner - occupied houses in 2022 in Baldwin, NY 103 Less than $10,00016 $15,000 to $19,99911 $30,000 to $34,9993 $40,000 to $49,9993 $50,000 to $59,99925 $100,000 to $124,99919 $125,000 to $149,999111 $150,000 to $174,99977 $175,000 to $199,99963 $200,000 to $249,999124 $250,000 to $299,999676 $300,000 to $399,9992,212 $400,000 to $499,9994,670 $500,000 to $749,999622 $750,000 to $999,999132 $1,000,000 to $1,499,99916 $1,500,000 to $1,999,99915 $2,000,000 or moreRent paid by renters in 2022 in Baldwin, NY 25 Less than $10036 $100 to $14918 $200 to $24912 $250 to $29967 $600 to $64915 $900 to $999114 $1,000 to $1,24944 $1,250 to $1,499425 $1,500 to $1,999185 $2,000 to $2,49948 $2,500 to $2,99973 $3,000 to $3,499253 No cash rent
Percentage of workers working in this county: 57.7%Number of people working at home: 1,945 (10.6% of all workers )
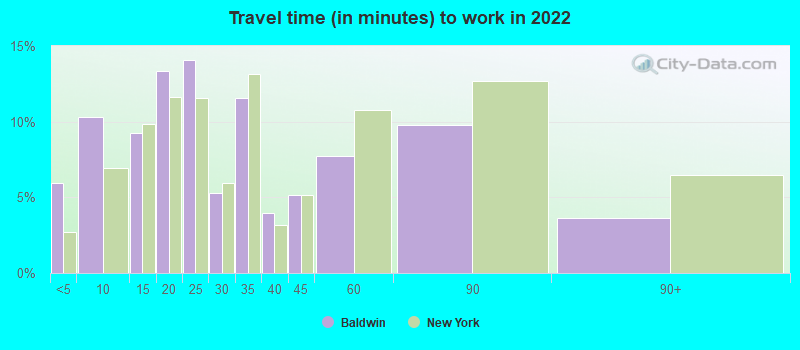
Travel time to work (commute)
Less than 5 minutes: 3565 to 9 minutes: 54010 to 14 minutes: 81615 to 19 minutes: 1,81120 to 24 minutes: 2,00325 to 29 minutes: 55430 to 34 minutes: 2,47235 to 39 minutes: 37840 to 44 minutes: 1,03445 to 59 minutes: 2,15160 to 89 minutes: 2,95390 or more minutes: 1,321
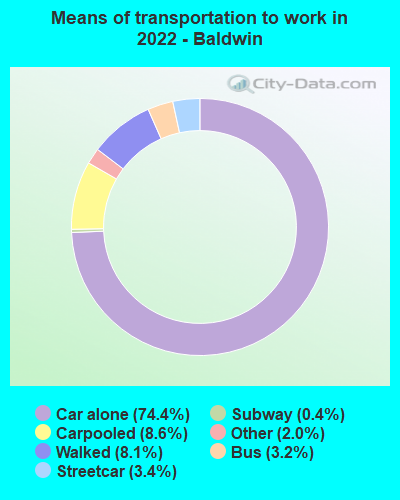
Means of transportation to work:
Drove a car alone: 3,149 (52.2%)Carpooled: 352 (5.8%)Bus : 129 (2.1%)Subway or elevated rail : 125 (2.1%)Long-distance train or commuter rail : 15 (0.2%)Taxi: 119 (2.0%)Walked: 371 (6.2%)Worked at home: 1,945 (32.3%)
Unemployment by race in 2022
Unemployment rate for White non-Hispanic residents 5.8% Males1.8% FemalesUnemployment rate for Black residents 3.6% Males3.0% FemalesUnemployment rate for Asian residents 1.0% MalesUnemployment rate for other race residents 11.7% FemalesUnemployment rate for two or more race residents 6.9% Males0.9% FemalesUnemployment rate for Hispanic or Latino residents 4.5% Males7.3% Females
Year of entry for the foreign-born population in Baldwin, New York
862 2010 or later 1,915 2000 to 2009 1,910 1990 to 1999 1,451 1980 to 1989 1,112 1970 to 1979 1,295 Before 1970
First ancestries reported:
Jamaican: 1,965 (10.5%)
Haitian: 1,793 (9.6%)
Italian: 1,352 (7.2%)
American: 818 (4.4%)
West Indian: 755 (4.0%)
Irish: 719 (3.8%)
Nigerian: 429 (2.3%)
Trinidadian and Tobagonian: 328 (1.8%)
German: 305 (1.6%)
African: 248 (1.3%)
English: 222 (1.2%)
Guyanese: 185 (1.0%)
Polish: 158 (0.8%)
European: 109 (0.6%)
British West Indian: 96 (0.5%)
Turkish: 86 (0.5%)
Romanian: 68 (0.4%)
Ghanaian: 62 (0.3%)
Eastern European: 56 (0.3%)
Armenian: 54 (0.3%)
Belizean: 53 (0.3%)
Lithuanian: 48 (0.3%)
Russian: 45 (0.2%)
Dutch: 27 (0.1%)
Scotch-Irish: 23 (0.1%)
Hungarian: 23 (0.1%)
French Canadian: 23 (0.1%)
Barbadian: 22 (0.1%)
Danish: 21 (0.1%)
Norwegian: 19 (0.1%)
Austrian: 18 (0.10%)
Portuguese: 17 (0.09%)
Ukrainian: 14 (0.07%)
Croatian: 13 (0.07%)
Slovene: 13 (0.07%)
Scottish: 11 (0.06%)
Greek: 11 (0.06%)
Pennsylvania German: 9 (0.05%)
Welsh: 9 (0.05%)
Israeli: 8 (0.04%)
Iranian: 8 (0.04%)
Scandinavian: 6 (0.03%)
Serbian: 5 (0.03%)
Swiss: 5 (0.03%) Most common places of birth for foreign-born residents (%): Jamaica Baldwin:
19.1% (1,646)New York:
5.0% (227,557)
Haiti Baldwin:
16.0% (1,378)New York:
2.8% (126,936)
Dominican Republic Baldwin:
11.6% (1,001)New York:
11.1% (501,040)
Trinidad and Tobago Baldwin:
4.6% (399)New York:
2.0% (91,428)
Guyana Baldwin:
4.2% (366)New York:
3.8% (172,129)
El Salvador Baldwin:
3.9% (335)New York:
2.4% (108,067)
Peru Baldwin:
3.2% (273)New York:
1.2% (54,759)
Nigeria Baldwin:
2.8% (243)New York:
0.7% (33,746)
Argentina Baldwin:
2.6% (222)New York:
0.5% (21,928)
Colombia Baldwin:
2.1% (182)New York:
2.5% (111,920)
Philippines Baldwin:
2.1% (181)New York:
2.0% (91,070)
Ecuador Baldwin:
1.9% (162)New York:
3.9% (177,448)
Italy Baldwin:
1.8% (155)New York:
1.8% (81,374)
Other Caribbean Baldwin:
1.6% (136)New York:
0.4% (18,080)
Honduras Baldwin:
1.6% (135)New York:
1.2% (55,571)
Place of birth for U.S.-born residents:
This state: 21,208Other state: 2,405Northeast: 761Midwest: 184South: 1,216West: 219 93.9% of Baldwin residents lived in the same house 1 years ago.
Out of people who lived in different houses, 37.8% lived in this county.
Out of people who lived in different counties, 89.9% lived in New York.
Baldwin:
93.9%State average:
89.6%
Education attainment for males 25 years and older:
No schooling: 194Nursery to 4th grade: 485th and 6th grade: 867th and 8th grade: 1029th grade: 3610th grade: 1311th grade: 17112th grade, no diploma: 176High school graduate (or equivalency): 2,251Less than 1 year of college: 874Some college more than 1 year, no degree: 1,743Associate degree: 1,190Bachelor's degree: 2,659Master's degree: 1,228Professional school degree: 476Doctorate degree: 190
Education attainment for females 25 years and older:
No schooling: 422Nursery to 4th grade: 235th and 6th grade: 657th and 8th grade: 2319th grade: 4310th grade: 1811th grade: 2212th grade, no diploma: 67High school graduate (or equivalency): 2,569Less than 1 year of college: 736Some college more than 1 year, no degree: 1,315Associate degree: 1,074Bachelor's degree: 2,983Master's degree: 2,038Professional school degree: 484Doctorate degree: 296
Housing units in structures:
One, detached: 9,862One, attached: 141Two: 2533 or 4: 1315 to 9: 13210 to 19: 16520 to 49: 10250 or more: 430Housing units lacking complete plumbing facilities in 2022: 0.3%Housing units lacking complete kitchen facilities in 2022: 0.2%House/condo owner moved in on average 15 years ago
Renter moved in on average 4 years ago
Private vs. public school enrollment:
Students in private schools in grades 1 to 8 (elementary and middle school): 372 Students in private schools in grades 9 to 12 (high school): 158 Students in private undergraduate colleges: 759