Avenel, NJ (New Jersey) Houses and Residents
| Avenel: | $348,988 |
| New Jersey: | $428,900 |
Mean price in 2022:
Detached houses: $382,976
Here: $382,976 State: $537,591 Townhouses or other attached units: $320,414
Here: $320,414 State: $381,113 In 2-unit structures: $437,233
Here: $437,233 State: $444,476 In 5-or-more-unit structures: $324,649
Here: $324,649 State: $368,745 Mobile homes: $51,642
Here: $51,642 State: $119,788
Total population: 17,011 (All urban)
Houses: 5,580 (5,437 occupied: 2,847 owner occupied, 2,635 renter occupied)
| % of renters here: | 48% |
| State: | 35% |
Housing density: 1,621 houses/condos per square mile
Median price asked for vacant for-sale houses and condos in 2022: $1,030,737.
Median contract rent in 2022: $1,492 (lower quartile is $1,230, upper quartile is $1,993)
Median rent asked for vacant for-rent units in 2022: $2,308
Median gross rent in Avenel, NJ in 2022: $1,652
Housing units in Avenel with a mortgage: 1,827 (121 second mortgage, 0 home equity loan, 117 both second mortgage and home equity loan)
Houses without a mortgage: 25
Median household income for houses/condos with a mortgage: $122,061
Median household income for apartments without a mortgage: $58,776
Median monthly housing costs: $1,653
Compare current foreclosures in Avenel, NJ:
| Photo | Address | Area | Beds / Baths | Price | Details |
|---|---|---|---|---|---|

|
#1
Chestnut St
Avenel, NJ 07001
|
- sq. feet
|
- baths - beds |
show details | |

|
#2
S Inman Ave
Avenel, NJ 07001
|
1,152 sq. feet
|
- baths - beds |
show details | |

|
#3
Hyatt St
Avenel, NJ 07001
|
1,352 sq. feet
|
- baths - beds |
show details | |

|
#4
Burnet St
Avenel, NJ 07001
|
1,242 sq. feet
|
- baths - beds |
show details | |

|
#5
Avenel St
Avenel, NJ 07001
|
- sq. feet
|
- baths - beds |
show details | |

|
#6
Rahway Ave
Avenel, NJ 07001
|
- sq. feet
|
- baths - beds |
show details | |

|
#7
Station Dr, Apt 722
Avenel, NJ 07001
|
- sq. feet
|
- baths - beds |
show details | |

|
#8
Station Dr, Apt 203
Avenel, NJ 07001
|
- sq. feet
|
- baths - beds |
show details | |

|
#9
E Woodbridge Ave
Avenel, NJ 07001
|
1,802 sq. feet
|
- baths - beds |
show details | |

|
#10
Village Dr
Avenel, NJ 07001
|
- sq. feet
|
- baths - beds |
show details |
| Photo | Address | Area | Beds / Baths | Price | Details |
|---|---|---|---|---|---|

|
#11
E Woodbridge Ave
Avenel, NJ 07001
|
- sq. feet
|
- baths - beds |
show details | |

|
#12
Yale Ave # 1
Avenel, NJ 07001
|
- sq. feet
|
- baths - beds |
show details | |

|
#13
Madaline Dr
Avenel, NJ 07001
|
1,000 sq. feet
|
- baths - beds |
show details | |

|
#14
Cornell St
Avenel, NJ 07001
|
1,071 sq. feet
|
- baths - beds |
show details | |

|
#15
Evergreen Forest Blvd
Avenel, NJ 07001
|
- sq. feet
|
- baths - beds |
show details | |

|
#16
Rahway Ave
Avenel, NJ 07001
|
- sq. feet
|
- baths - beds |
show details | |

|
#17
Madaline Dr
Avenel, NJ 07001
|
- sq. feet
|
- baths - beds |
show details | |

|
#18
Minna Ave
Avenel, NJ 07001
|
- sq. feet
|
- baths - beds |
show details | |

|
#19
Remsen Ave
Avenel, NJ 07001
|
- sq. feet
|
- baths - beds |
show details | |

|
#20
Peach St
Avenel, NJ 07001
|
- sq. feet
|
- baths - beds |
show details |
| Photo | Address | Area | Beds / Baths | Price | Details |
|---|---|---|---|---|---|

|
#21
Harvard Ave
Avenel, NJ 07001
|
- sq. feet
|
- baths - beds |
show details | |

|
#22
Homestead Ave
Avenel, NJ 07001
|
- sq. feet
|
- baths - beds |
show details | |

|
#23
Ave
Avenel, NJ 07001
|
- sq. feet
|
- baths - beds |
show details | |

|
#24
Saint Georges Ave # 2
Avenel, NJ 07001
|
- sq. feet
|
- baths - beds |
show details | |

|
#25
Hudson Blvd
Avenel, NJ 07001
|
- sq. feet
|
- baths - beds |
show details | |

|
#26
Yale Ave
Avenel, NJ 07001
|
- sq. feet
|
- baths - beds |
show details | |

|
#27
Woodruff Ave
Avenel, NJ 07001
|
- sq. feet
|
- baths - beds |
show details | |

|
#28
Hudson Blvd
Avenel, NJ 07001
|
- sq. feet
|
- baths - beds |
show details | |

|
#29
Manhattan Ave
Avenel, NJ 07001
|
- sq. feet
|
- baths - beds |
show details | |

|
#30
Doreen Dr
Avenel, NJ 07001
|
- sq. feet
|
- baths - beds |
show details |
| Photo | Address | Area | Beds / Baths | Price | Details |
|---|---|---|---|---|---|

|
#31
Hart St
Avenel, NJ 07001
|
- sq. feet
|
- baths - beds |
show details | |

|
#32
Tappen St
Avenel, NJ 07001
|
- sq. feet
|
- baths - beds |
show details | |

|
#33
Chase Ave
Avenel, NJ 07001
|
- sq. feet
|
- baths - beds |
show details | |

|
#34
Woodruff Ave
Avenel, NJ 07001
|
- sq. feet
|
- baths - beds |
show details | |

|
#35
Cornell St
Avenel, NJ 07001
|
- sq. feet
|
- baths - beds |
show details | |

|
#36
Thayer Ave
Avenel, NJ 07001
|
- sq. feet
|
- baths - beds |
show details | |

|
#37
Remsen Ave
Avenel, NJ 07001
|
- sq. feet
|
- baths - beds |
show details | |

|
#38
Meinzer St
Avenel, NJ 07001
|
- sq. feet
|
- baths - beds |
show details | |

|
#39
George St
Avenel, NJ 07001
|
- sq. feet
|
- baths - beds |
show details | |

|
#40
Minna Ave
Avenel, NJ 07001
|
- sq. feet
|
- baths - beds |
show details |
| Photo | Address | Area | Beds / Baths | Price | Details |
|---|---|---|---|---|---|

|
#41
Oak St
Avenel, NJ 07001
|
- sq. feet
|
- baths - beds |
show details | |

|
Check over 1 million property listings on Foreclosure.com!
|
browse all offers | |||

Latest news about housing in Avenel, NJ collected exclusively by city-data.com from local newspapers, TV, and radio stations


Median year apartment built: 1987
Household type by relationship:
Households: 17,236- Male householders: 2,724 (806 living alone), Female householders: 2,677 (826 living alone)
2,546 spouses (2,492 opposite-sex spouses), 246 unmarried partners, (173 opposite-sex unmarried partners), 4,537 children (4,339 natural, 60 adopted, 138 stepchildren), 210 grandchildren, 149 brothers or sisters, 357 parents, 0 foster children, 278 other relatives, 210 non-relatives
- In group quarters: 3,297
Size of family households: 1,235 2-persons, 980 3-persons, 778 4-persons, 338 5-persons, 198 6-persons, 33 7-or-more-persons.
Size of nonfamily households: 1,659 1-person, 242 2-persons.
2,179 married couples with children.
949 single-parent households (40 men, 909 women).
58.3% of residents of Avenel speak English at home.
14.4% of residents speak Spanish at home (65% speak English very well, 13% speak English well, 17% speak English not well, 6% don't speak English at all).
16.0% of residents speak other Indo-European language at home (75% speak English very well, 14% speak English well, 10% speak English not well, 1% don't speak English at all).
7.4% of residents speak Asian or Pacific Island language at home (57% speak English very well, 30% speak English well, 13% speak English not well).
3.1% of residents speak other language at home (74% speak English very well, 20% speak English well, 6% speak English not well).
Foreign born population: 5,383 (31.2%)
(53.4% of them are naturalized citizens)
| Here: | 5.9 |
| State: | 6.8 |
| Here: | 3.5 |
| State: | 3.9 |

- Bedrooms in owner-occupied houses and condos in Avenel, New Jersey
- 15no bedroom
- 551 bedroom
- 8642 bedrooms
- 1,0683 bedrooms
- 6874 bedrooms
- 1585+ bedrooms

- Bedrooms in renter-occupied apartments in Avenel, New Jersey
- 112no bedroom
- 1,3101 bedroom
- 8242 bedrooms
- 2673 bedrooms
- 1224 bedrooms
- 05+ bedrooms

- Cars and other vehicles available in Avenel in owner-occupied houses/condos
- 40no vehicle
- 1,0851 vehicle
- 9672 vehicles
- 5703 vehicles
- 1524 vehicles
- 345+ vehicles

- Cars and other vehicles available in Avenel in renter-occupied apartments
- 188no vehicle
- 1,6001 vehicle
- 7812 vehicles
- 673 vehicles
- 04 vehicles
- 05+ vehicles

- Rooms in owner-occupied houses in Avenel, New Jersey
- 151 room
- 02 rooms
- 1433 rooms
- 6114 rooms
- 3985 rooms
- 6036 rooms
- 4507 rooms
- 2858 rooms
- 3429+ rooms

- Rooms in renter-occupied apartments in Avenel, New Jersey
- 1031 room
- 1352 rooms
- 1,0103 rooms
- 8594 rooms
- 2305 rooms
- 2016 rooms
- 647 rooms
- 348 rooms
- 09+ rooms


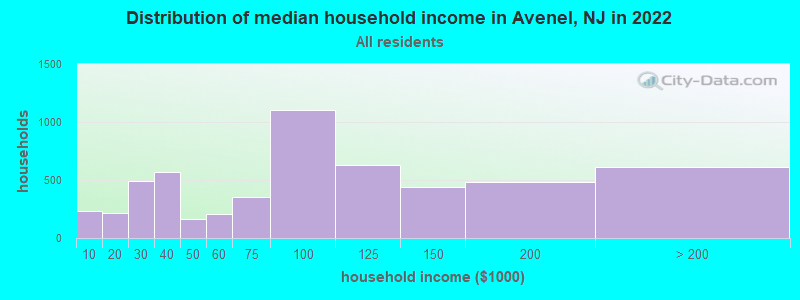
Avenel, NJ household income distribution

- 232Less than $10,000
- 212$10,000 to $19,999
- 488$20,000 to $29,999
- 565$30,000 to $39,999
- 162$40,000 to $49,999
- 203$50,000 to $59,999
- 352$60,000 to $74,999
- 1,107$75,000 to $99,999
- 632$100,000 to $124,999
- 441$125,000 to $149,999
- 483$150,000 to $199,999
- 616$200,000 or more
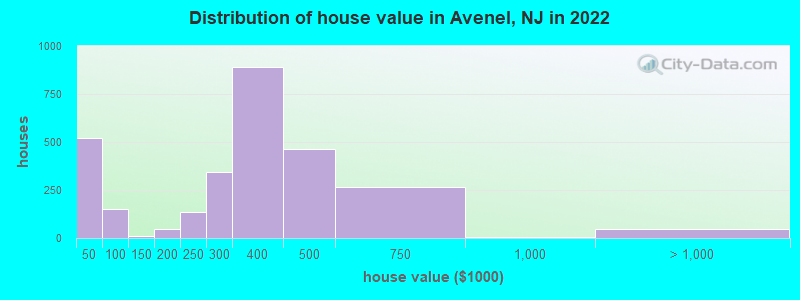
Home value of owner - occupied houses in 2022 in Avenel, NJ
-
- 206Less than $10,000
- 45$15,000 to $19,999
- 36$20,000 to $24,999
- 120$30,000 to $34,999
- 11$35,000 to $39,999
- 100$40,000 to $49,999
- 44$50,000 to $59,999
- 8$70,000 to $79,999
- 9$100,000 to $124,999
- 19$150,000 to $174,999
- 25$175,000 to $199,999
- 133$200,000 to $249,999
- 342$250,000 to $299,999
- 891$300,000 to $399,999
- 464$400,000 to $499,999
- 263$500,000 to $749,999
- 4$750,000 to $999,999
- 49$2,000,000 or more
Rent paid by renters in 2022 in Avenel, NJ
-
- 32Less than $100
- 36$350 to $399
- 52$550 to $599
- 77$700 to $749
- 55$800 to $899
- 233$1,000 to $1,249
- 665$1,250 to $1,499
- 600$1,500 to $1,999
- 489$2,000 to $2,499
- 18$3,000 to $3,499
- 143No cash rent


Percentage of workers working in this county: 45.8%
Number of people working at home: 767 (11.0% of all workers)
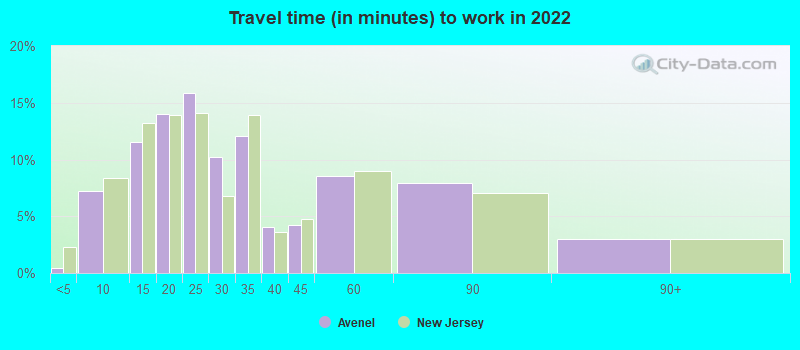
Travel time to work (commute)
- Less than 5 minutes: 54
- 5 to 9 minutes: 463
- 10 to 14 minutes: 660
- 15 to 19 minutes: 817
- 20 to 24 minutes: 724
- 25 to 29 minutes: 376
- 30 to 34 minutes: 1,246
- 35 to 39 minutes: 114
- 40 to 44 minutes: 226
- 45 to 59 minutes: 673
- 60 to 89 minutes: 468
- 90 or more minutes: 289
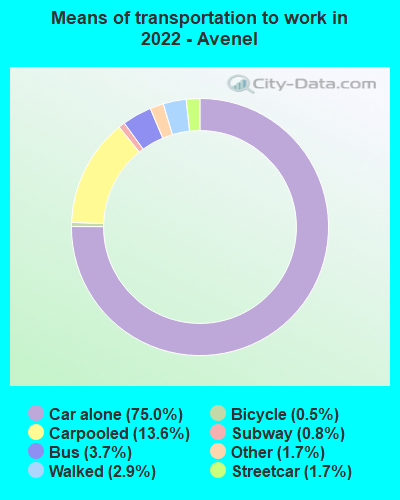
Means of transportation to work:
- Drove a car alone: 5,934 (65.0%)
- Carpooled: 1,275 (14.0%)
- Bus: 129 (1.4%)
- Subway or elevated rail: 197 (2.2%)
- Long-distance train or commuter rail: 55 (0.6%)
- Taxi: 182 (2.0%)
- Bicycle: 42 (0.5%)
- Walked: 337 (3.7%)
- Worked at home: 767 (8.4%)

- Unemployment by race in 2022
- Unemployment rate for White non-Hispanic residents
- 3.5%Males
- 6.8%Females
- Unemployment rate for Black residents
- 2.6%Males
- Unemployment rate for Asian residents
- 6.4%Males
- 11.2%Females
- Unemployment rate for other race residents
- 0.6%Males
- 7.9%Females
- Unemployment rate for Hispanic or Latino residents
- 7.6%Males
- 3.1%Females

- Year of entry for the foreign-born population in Avenel, New Jersey
- 2,0032010 or later
- 1,7242000 to 2009
- 7801990 to 1999
- 1,0891980 to 1989
- 3351970 to 1979
- 304Before 1970
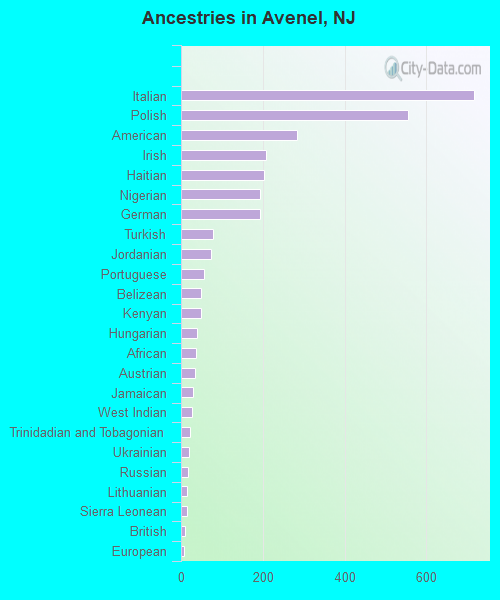
First ancestries reported:
- Italian: 717 (7.8%)
- Polish: 556 (6.0%)
- American: 283 (3.1%)
- Irish: 207 (2.3%)
- Haitian: 204 (2.2%)
- Nigerian: 194 (2.1%)
- German: 192 (2.1%)
- Turkish: 79 (0.9%)
- Jordanian: 74 (0.8%)
- Portuguese: 57 (0.6%)
- Belizean: 50 (0.5%)
- Kenyan: 48 (0.5%)
- Hungarian: 38 (0.4%)
- African: 36 (0.4%)
- Austrian: 33 (0.4%)
- Jamaican: 29 (0.3%)
- West Indian: 26 (0.3%)
- Trinidadian and Tobagonian: 21 (0.2%)
- Ukrainian: 19 (0.2%)
- Russian: 17 (0.2%)
- Lithuanian: 15 (0.2%)
- Sierra Leonean: 15 (0.2%)
- British: 10 (0.1%)
- European: 7 (0.08%)
Most common places of birth for foreign-born residents (%):
| Avenel: | 37.0% (1,940) |
| New Jersey: | 12.8% (274,609) |
| Avenel: | 5.2% (270) |
| New Jersey: | 1.3% (27,580) |
| Avenel: | 5.1% (266) |
| New Jersey: | 2.7% (58,563) |
| Avenel: | 4.3% (227) |
| New Jersey: | 2.3% (48,811) |
| Avenel: | 3.3% (172) |
| New Jersey: | 1.6% (33,678) |
| Avenel: | 3.1% (161) |
| New Jersey: | 4.4% (95,275) |
| Avenel: | 2.8% (147) |
| New Jersey: | 3.3% (70,512) |
| Avenel: | 2.5% (130) |
| New Jersey: | 1.2% (25,213) |
| Avenel: | 2.5% (129) |
| New Jersey: | 0.8% (16,778) |
| Avenel: | 2.4% (127) |
| New Jersey: | 0.1% (2,004) |
| Avenel: | 2.4% (126) |
| New Jersey: | 0.2% (4,399) |
| Avenel: | 2.0% (104) |
| New Jersey: | 2.2% (47,365) |
| Avenel: | 1.8% (96) |
| New Jersey: | 0.0% (655) |
| Avenel: | 1.7% (90) |
| New Jersey: | 4.2% (90,817) |
| Avenel: | 1.7% (88) |
| New Jersey: | 4.0% (85,934) |
| Avenel: | 1.7% (87) |
| New Jersey: | 4.8% (102,527) |
| Avenel: | 1.5% (81) |
| New Jersey: | 9.7% (209,055) |
Place of birth for U.S.-born residents:
- This state: 8,467
- Other state: 2,904
- Northeast: 1,869
- Midwest: 295
- South: 633
- West: 42
78.6% of Avenel residents lived in the same house 1 years ago.
Out of people who lived in different houses, 30.5% lived in this county.
Out of people who lived in different counties, 68.3% lived in New Jersey.
| Avenel: | 78.6% |
| State average: | 90.4% |
Education attainment for males 25 years and older:
- No schooling: 216
- Nursery to 4th grade: 10
- 5th and 6th grade: 33
- 7th and 8th grade: 50
- 9th grade: 90
- 10th grade: 86
- 11th grade: 204
- 12th grade, no diploma: 154
- High school graduate (or equivalency): 3,409
- Less than 1 year of college: 467
- Some college more than 1 year, no degree: 457
- Associate degree: 329
- Bachelor's degree: 1,155
- Master's degree: 759
- Professional school degree: 79
- Doctorate degree: 15

Education attainment for females 25 years and older:
- No schooling: 145
- Nursery to 4th grade: 35
- 5th and 6th grade: 22
- 7th and 8th grade: 16
- 9th grade: 87
- 10th grade: 0
- 11th grade: 126
- 12th grade, no diploma: 220
- High school graduate (or equivalency): 1,429
- Less than 1 year of college: 423
- Some college more than 1 year, no degree: 446
- Associate degree: 639
- Bachelor's degree: 772
- Master's degree: 698
- Professional school degree: 53
- Doctorate degree: 9


Housing units in structures:
- One, detached: 2,302
- One, attached: 297
- Two: 430
- 3 or 4: 177
- 5 to 9: 365
- 10 to 19: 875
- 20 to 49: 457
- 50 or more: 338
- Mobile homes: 334
Median worth of mobile homes: $36,730
Housing units lacking complete kitchen facilities in 2022: 5.3%
House/condo owner moved in on average 16 years ago
Renter moved in on average 2 years ago

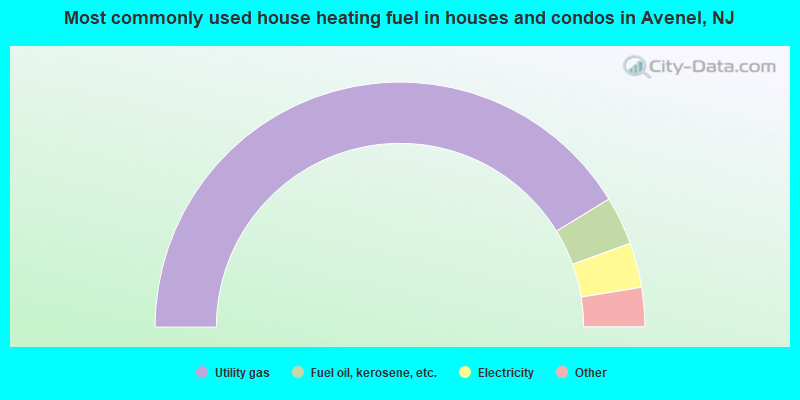
- 82.6%Utility gas
- 6.4%Fuel oil, kerosene, etc.
- 5.9%Electricity
- 3.8%Bottled, tank, or LP gas
- 0.8%Other fuel
- 0.5%Coal or coke
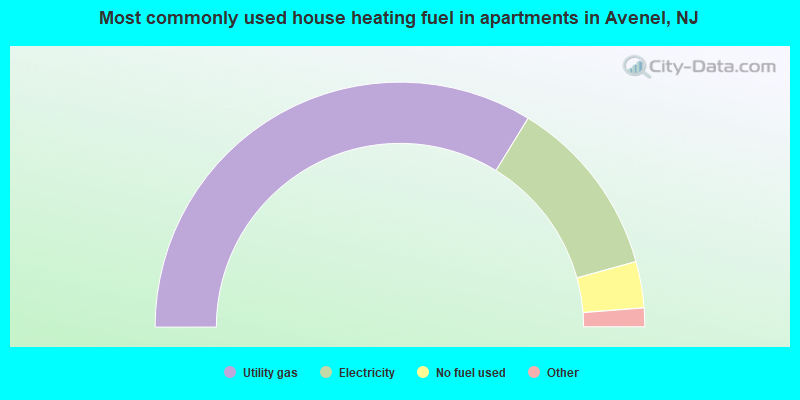
- 67.6%Utility gas
- 23.9%Electricity
- 6.1%No fuel used
- 1.0%Bottled, tank, or LP gas
- 1.0%Fuel oil, kerosene, etc.
- 0.5%Other fuel
Private vs. public school enrollment:
| Here: | 4.0% |
| New Jersey: | 12.3% |
| Here: | 0.0% |
| New Jersey: | 13.1% |
| Here: | 21.2% |
| New Jersey: | 33.2% |


