Arbutus, MD (Maryland) Houses and Residents
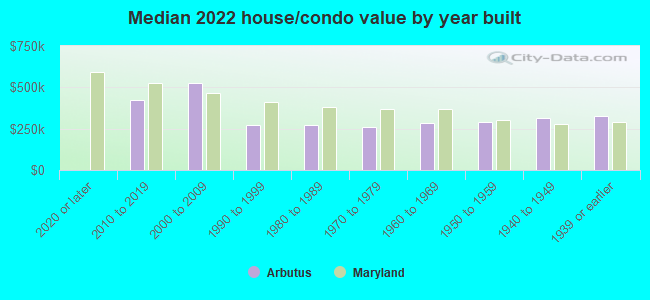
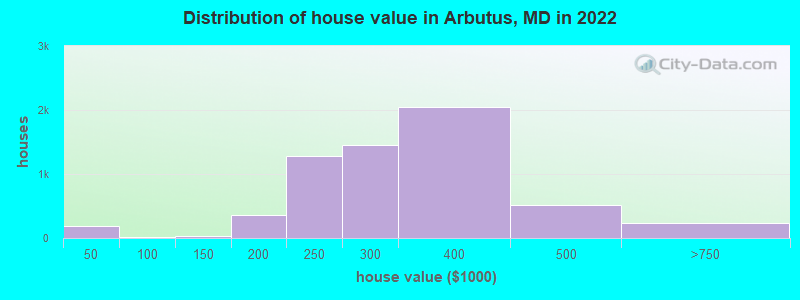
Estimated median house or condo value in 2022: $299,694 (it was $112,400 in 2000 )
Arbutus:
$299,694Maryland:
$398,100
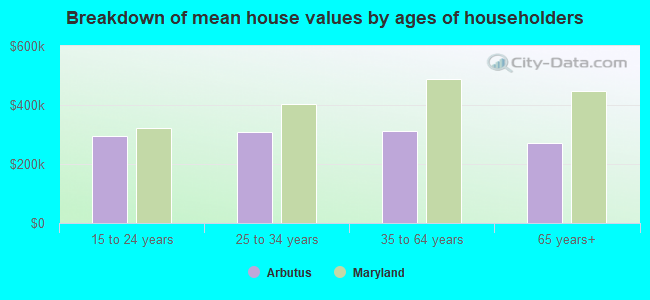
Lower value quartile - upper value quartile: $241,972 - $365,585Mean price in 2022: Detached houses: $326,645 Here:
$326,645State:
$526,819
Townhouses or other attached units: $236,427 Here:
$236,427State:
$328,305
In 2-unit structures: $249,226 Here:
$249,226State:
$346,599
In 3-to-4-unit structures: $352,263 Here:
$352,263State:
$295,378
In 5-or-more-unit structures: $251,307 Here:
$251,307State:
$350,378
Total population: 20,483 (Urban population: 20,116, Rural population: 0)
Houses: 8,550 (8,013 occupied: 6,132 owner occupied, 2,060 renter occupied )
% of renters here:
25%State:
32%
Housing density: 1,315 houses/condos per square mile
Median price asked for vacant for-sale houses and condos in 2022: $653,173.
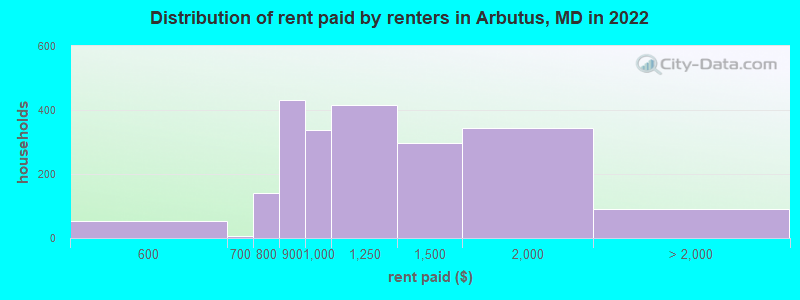
Median contract rent in 2022: $1,098 (lower quartile is $870, upper quartile is $1,392)
Median rent asked for vacant for-rent units in 2022: $689
Median gross rent in Arbutus, MD in 2022: $1,232
Housing units in Arbutus with a mortgage: 4,671 (460 second mortgage, 0 home equity loan, 413 both second mortgage and home equity loan )Houses without a mortgage: 206
Median household income for houses/condos with a mortgage: $128,449
Median household income for apartments without a mortgage: $81,075
Median monthly housing costs: $1,500
Data:
Median house or condo value ($)
Median house or condo value ($ change since 2000)
Median house or condo value ($) - White
Median house or condo value ($) - Black or African American
Median house or condo value ($) - Asian
Median house or condo value ($) - Hispanic or Latino
Median house or condo value ($) - American Indian and Alaska Native
Median house or condo value ($) - Multirace
Median house or condo value ($) - Other Race
Median price asked for mobile homes ($)
Household density (households per square mile)
Mean house or condo value by units in structure - 1, detached ($)
Mean house or condo value by units in structure - 1, attached ($)
Mean house or condo value by units in structure - 2 ($)
Mean house or condo value by units in structure by units in structure - 3 or 4 ($)
Mean house or condo value by units in structure - 5 or more ($)
Mean house or condo value by units in structure - Boat, RV, van, etc. ($)
Mean house or condo value by units in structure - Mobile home ($)
Median contract rent ($)
Median contract rent - Lower quartile ($)
Median contract rent - Upper quartile ($)
Median gross rent ($)
Urban houses (%)
Rural houses (%)
Houses occupied (%)
Houses occupied (% change since 2000)
Houses owner occupied (%)
Houses owner occupied (% change since 2000)
Houses renter occupied (%)
Houses renter occupied (% change since 2000)
Vacant housing units - For rent (%)
Vacant housing units - For rent (% change since 2000)
Vacant housing units - For sale only (%)
Vacant housing units - For sale only (% change since 2000)
Vacant housing units - Rented or sold, not occupied (%)
Vacant housing units - Rented or sold, not occupied (% change since 2000)
Vacant housing units - For seasonal, recreational, or occasional use (%)
Vacant housing units - For seasonal, recreational, or occasional use (% change since 2000)
Vacant housing units - For migrant workers (%)
Vacant housing units - For migrant workers (% change since 2000)
Vacant housing units - Other vacant (%)
Vacant housing units - Other vacant (% change since 2000)
Median monthly housing costs ($)
Median household income for houses/condos with a mortgage ($)
Median household income for houses/condos without a mortgage ($)
Median household income ($)
Median household income ($) - White
Median household income ($) - Black or African American
Median household income ($) - Asian
Median household income ($) - Hispanic or Latino
Median household income ($) - American Indian and Alaska Native
Median household income ($) - Multirace
Median household income ($) - Other Race
Mortgage status - with mortgage (%)
Mortgage status - with second mortgage (%)
Mortgage status - with home equity loan (%)
Mortgage status - with both second mortgage and home equity loan (%)
Mortgage status - without a mortgage (%)
Median year house/condo built
Median year apartment built
Household type by relationship - Male householder living alone (%)
Household type by relationship - Male householder not living alone (%)
Household type by relationship - Female householder living alone (%)
Household type by relationship - Female householder not living alone (%)
Household type by relationship - Opposite-Sex spouse (%)
Household type by relationship - Same-Sex spouse (%)
Household type by relationship - Opposite-Sex unmarried partner (%)
Household type by relationship - Same-Sex unmarried partner (%)
Household type by relationship - In group quarters (%)
Size of family households - 2-person household (%)
Size of family households - 3-person household (%)
Size of family households - 4-person household (%)
Size of family households - 5-person household (%)
Size of family households - 6-person household (%)
Size of family households - 7-or-more-person household (%)
Size of nonfamily households - 1-person household (%)
Size of nonfamily households - 2-person household (%)
Size of nonfamily households - 3-person household (%)
Size of nonfamily households - 4-person household (%)
Size of nonfamily households - 5-person household (%)
Size of nonfamily households - 6-person household (%)
Size of nonfamily households - 7-or-moreperson household (%)
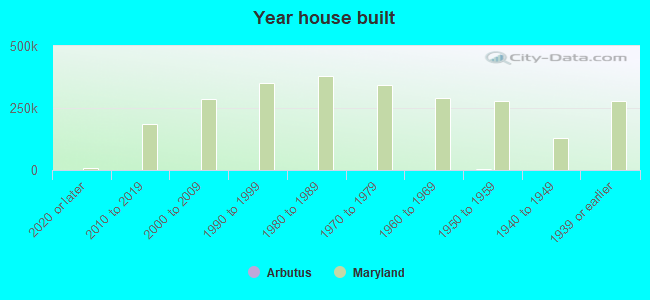
Year house built - Built 2010 or later (%)
Year house built - Built 2000 to 2009 (%)
Year house built - Built 1990 to 1999 (%)
Year house built - Built 1980 to 1989 (%)
Year house built - Built 1970 to 1979 (%)
Year house built - Built 1960 to 1969 (%)
Year house built - Built 1950 to 1959 (%)
Year house built - Built 1940 to 1949 (%)
Year house built - Built 1939 or earlier (%)
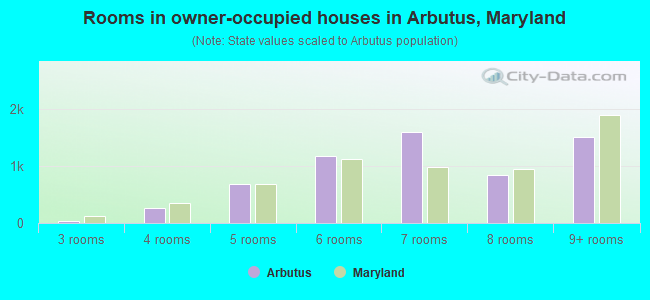
Median number of rooms in houses and condos
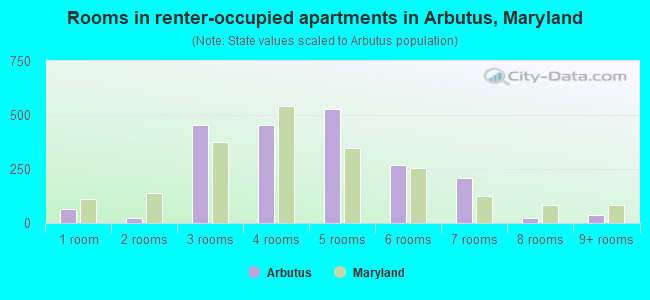
Median number of rooms in apartments
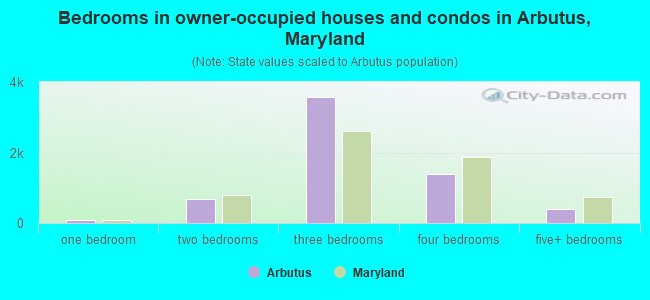
Median number of bedrooms in owner occupied houses
Mean number of bedrooms in owner occupied houses
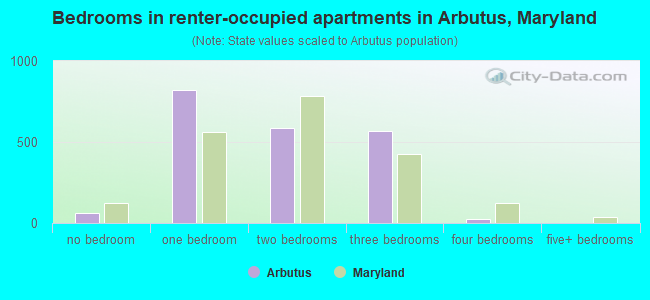
Median number of bedrooms in renter occupied houses
Mean number of bedrooms in renter occupied houses
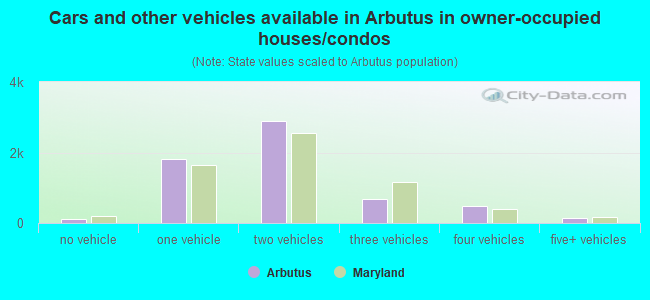
Median number of vehichles in owner occupied houses
Mean number of vehichles in owner occupied houses
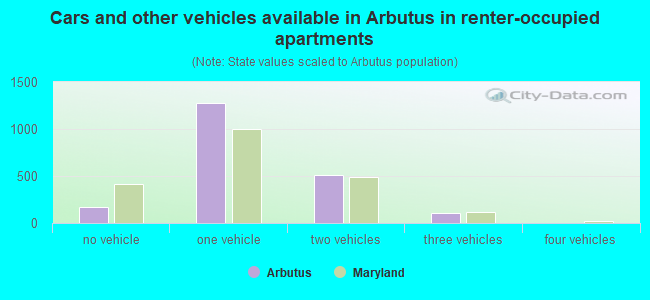
Median number of vehichles in renter occupied houses
Mean number of vehichles in renter occupied houses
Rooms in owner-occupied houses - 1 room (%)
Rooms in owner-occupied houses - 2 rooms (%)
Rooms in owner-occupied houses - 3 rooms (%)
Rooms in owner-occupied houses - 4 rooms (%)
Rooms in owner-occupied houses - 5 rooms (%)
Rooms in owner-occupied houses - 6 rooms (%)
Rooms in owner-occupied houses - 7 rooms (%)
Rooms in owner-occupied houses - 8 rooms (%)
Rooms in owner-occupied houses - 9+ rooms (%)
Rooms in renter-occupied houses - 1 room (%)
Rooms in renter-occupied houses - 2 rooms (%)
Rooms in renter-occupied houses - 3 rooms (%)
Rooms in renter-occupied houses - 4 rooms (%)
Rooms in renter-occupied houses - 5 rooms (%)
Rooms in renter-occupied houses - 6 rooms (%)
Rooms in renter-occupied houses - 7 rooms (%)
Rooms in renter-occupied houses - 8 rooms (%)
Rooms in renter-occupied houses - 9+ rooms (%)
Bedrooms in owner-occupied houses - no bedrooms (%)
Bedrooms in owner-occupied houses - 1 bedroom (%)
Bedrooms in owner-occupied houses - 2 bedrooms (%)
Bedrooms in owner-occupied houses - 3 bedrooms (%)
Bedrooms in owner-occupied houses - 4 bedrooms (%)
Bedrooms in owner-occupied houses - 5+ bedrooms (%)
Bedrooms in renter-occupied houses - no bedrooms (%)
Bedrooms in renter-occupied houses - 1 bedroom (%)
Bedrooms in renter-occupied houses - 2 bedrooms (%)
Bedrooms in renter-occupied houses - 3 bedrooms (%)
Bedrooms in renter-occupied houses - 4 bedrooms (%)
Bedrooms in renter-occupied houses - 5+ bedrooms (%)
Vehicles available in owner-occupied houses - no vehicle available (%)
Vehicles available in owner-occupied houses - 1 vehicle available(%)
Vehicles available in owner-occupied houses - 2 Vehicles available (%)
Vehicles available in owner-occupied houses - 3 Vehicles available (%)
Vehicles available in owner-occupied houses - 4 Vehicles available (%)
Vehicles available in owner-occupied houses - 5+ Vehicles available (%)
Vehicles available in renter-occupied houses - no vehicle available (%)
Vehicles available in renter-occupied houses - 1 vehicle available (%)
Vehicles available in renter-occupied houses - 2 Vehicles available (%)
Vehicles available in renter-occupied houses - 3 Vehicles available (%)
Vehicles available in renter-occupied houses - 4 Vehicles available (%)
Vehicles available in renter-occupied houses - 5+ Vehicles available (%)
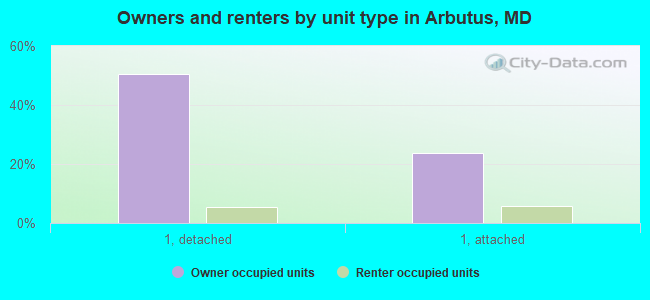
Housing units in structures - 1, detached (%)
Housing units in structures - 1, attached (%)
Housing units in structures - 2 (%)
Housing units in structures - 3 or 4 (%)
Housing units in structures - 5 to 9 (%)
Housing units in structures - 10 to 19 (%)
Housing units in structures - 20 to 49 (%)
Housing units in structures - 50 or more (%)
Housing units in structures - Mobile home (%)
Housing units in structures - Boat, RV, van, etc. (%)
Housing units in structures - Owners - 1, detached (%)
Housing units in structures - Owners - 1, attached (%)
Housing units in structures - Owners - 2 (%)
Housing units in structures - Owners - 3 or 4 (%)
Housing units in structures - Owners - 5 to 9 (%)
Housing units in structures - Owners - 10 to 19 (%)
Housing units in structures - Owners - 20 to 49 (%)
Housing units in structures - Owners - 50 or more (%)
Housing units in structures - Owners - Mobile home (%)
Housing units in structures - Owners - Boat, RV, van, etc. (%)
Housing units in structures - Renters - 1, detached (%)
Housing units in structures - Renters - 1, attached (%)
Housing units in structures - Renters - 2 (%)
Housing units in structures - Renters - 3 or 4 (%)
Housing units in structures - Renters - 5 to 9 (%)
Housing units in structures - Renters - 10 to 19 (%)
Housing units in structures - Renters - 20 to 49 (%)
Housing units in structures - Renters - 50 or more (%)
Housing units in structures - Renters - Mobile home (%)
Housing units in structures - Renters - Boat, RV, van, etc. (%)
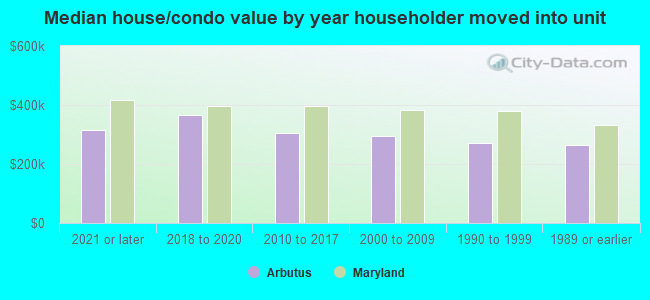
House/condo owner moved in on average (years ago)
Renter moved in on average (years ago)
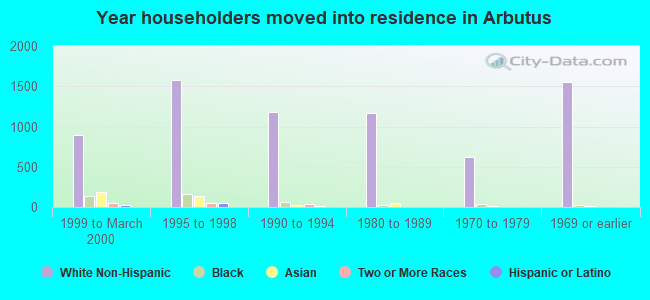
Year householder moved into unit - Moved in 1999 to March 2000 (%)
Year householder moved into unit - Moved in 1999 to March 2000 (%) - White
Year householder moved into unit - Moved in 1999 to March 2000 (%) - Black or African American
Year householder moved into unit - Moved in 1999 to March 2000 (%) - Asian
Year householder moved into unit - Moved in 1999 to March 2000 (%) - Hispanic or Latino
Year householder moved into unit - Moved in 1999 to March 2000 (%) - American Indian and Alaska Native
Year householder moved into unit - Moved in 1999 to March 2000 (%) - Multirace
Year householder moved into unit - Moved in 1999 to March 2000 (%) - Other Race
Year householder moved into unit - Moved in 1995 to 1998 (%)
Year householder moved into unit - Moved in 1995 to 1998 (%) - White
Year householder moved into unit - Moved in 1995 to 1998 (%) - Black or African American
Year householder moved into unit - Moved in 1995 to 1998 (%) - Asian
Year householder moved into unit - Moved in 1995 to 1998 (%) - Hispanic or Latino
Year householder moved into unit - Moved in 1995 to 1998 (%) - American Indian and Alaska Native
Year householder moved into unit - Moved in 1995 to 1998 (%) - Multirace
Year householder moved into unit - Moved in 1995 to 1998 (%) - Other Race
Year householder moved into unit - Moved in 1990 to 1994 (%)
Year householder moved into unit - Moved in 1990 to 1994 (%) - White
Year householder moved into unit - Moved in 1990 to 1994 (%) - Black or African American
Year householder moved into unit - Moved in 1990 to 1994 (%) - Asian
Year householder moved into unit - Moved in 1990 to 1994 (%) - Hispanic or Latino
Year householder moved into unit - Moved in 1990 to 1994 (%) - American Indian and Alaska Native
Year householder moved into unit - Moved in 1990 to 1994 (%) - Multirace
Year householder moved into unit - Moved in 1990 to 1994 (%) - Other Race
Year householder moved into unit - Moved in 1980 to 1989 (%)
Year householder moved into unit - Moved in 1980 to 1989 (%) - White
Year householder moved into unit - Moved in 1980 to 1989 (%) - Black or African American
Year householder moved into unit - Moved in 1980 to 1989 (%) - Asian
Year householder moved into unit - Moved in 1980 to 1989 (%) - Hispanic or Latino
Year householder moved into unit - Moved in 1980 to 1989 (%) - American Indian and Alaska Native
Year householder moved into unit - Moved in 1980 to 1989 (%) - Multirace
Year householder moved into unit - Moved in 1980 to 1989 (%) - Other Race
Year householder moved into unit - Moved in 1970 to 1979 (%)
Year householder moved into unit - Moved in 1970 to 1979 (%) - White
Year householder moved into unit - Moved in 1970 to 1979 (%) - Black or African American
Year householder moved into unit - Moved in 1970 to 1979 (%) - Asian
Year householder moved into unit - Moved in 1970 to 1979 (%) - Hispanic or Latino
Year householder moved into unit - Moved in 1970 to 1979 (%) - American Indian and Alaska Native
Year householder moved into unit - Moved in 1970 to 1979 (%) - Multirace
Year householder moved into unit - Moved in 1970 to 1979 (%) - Other Race
Year householder moved into unit - Moved in 1969 or earlier (%)
Year householder moved into unit - Moved in 1969 or earlier (%) - White
Year householder moved into unit - Moved in 1969 or earlier (%) - Black or African American
Year householder moved into unit - Moved in 1969 or earlier (%) - Asian
Year householder moved into unit - Moved in 1969 or earlier (%) - Hispanic or Latino
Year householder moved into unit - Moved in 1969 or earlier (%) - American Indian and Alaska Native
Year householder moved into unit - Moved in 1969 or earlier (%) - Multirace
Year householder moved into unit - Moved in 1969 or earlier (%) - Other Race
Housing units lacking complete plumbing facilities (%)
Housing units lacking complete kitchen facilities (%)
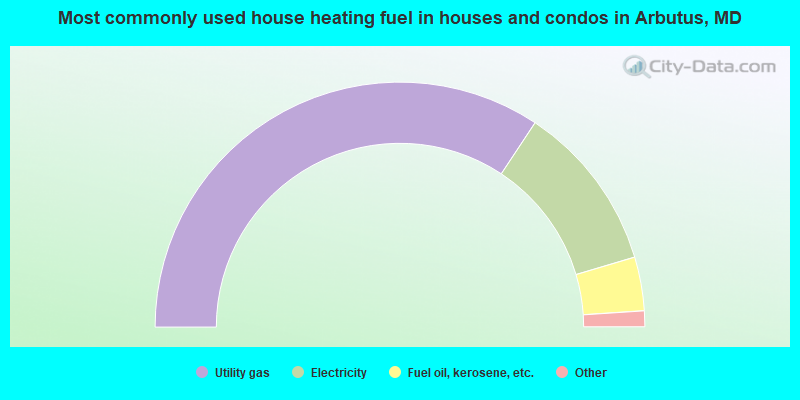
House heating fuel used in houses and condos - Utility gas (%)
House heating fuel used in houses and condos - Bottled, tank, or LP gas (%)
House heating fuel used in houses and condos - Electricity (%)
House heating fuel used in houses and condos - Fuel oil, kerosene, etc. (%)
House heating fuel used in houses and condos - Coal or coke (%)
House heating fuel used in houses and condos - Wood (%)
House heating fuel used in houses and condos - Solar energy (%)
House heating fuel used in houses and condos - Other fuel (%)
House heating fuel used in houses and condos - No fuel used (%)
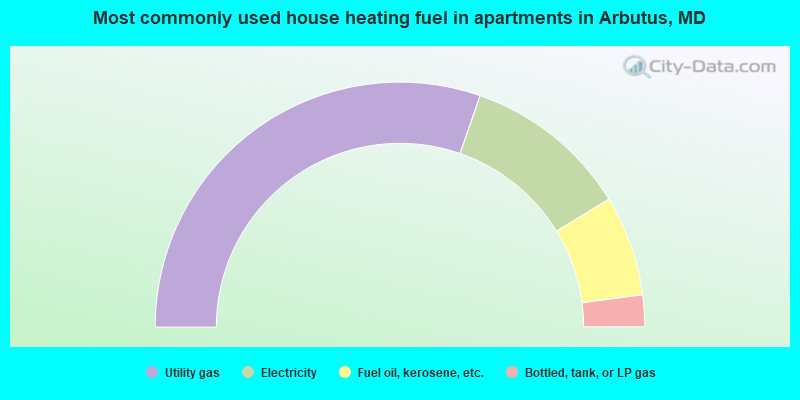
House heating fuel used in apartments - Utility gas (%)
House heating fuel used in apartments - Bottled, tank, or LP gas (%)
House heating fuel used in apartments - Electricity (%)
House heating fuel used in apartments - Fuel oil, kerosene, etc. (%)
House heating fuel used in apartments - Coal or coke (%)
House heating fuel used in apartments - Wood (%)
House heating fuel used in apartments - Solar energy (%)
House heating fuel used in apartments - Other fuel (%)
House heating fuel used in apartments - No fuel used (%)
Latest news about housing in Arbutus, MD collected exclusively by city-data.com from local newspapers, TV, and radio stations
Median year house/condo built: 1954Median year apartment built: 1958Household type by relationship:
Households: 20,026
Male householders: 3,948 (1,294 living alone ), Female householders: 3,984 (1,211 living alone )3,795 spouses (3,624 opposite-sex spouses ), 509 unmarried partners , (509 opposite-sex unmarried partners ), 5,631 children (5,250 natural , 19 adopted , 361 stepchildren ), 304 grandchildren , 415 brothers or sisters , 235 parents , 76 foster children , 193 other relatives , 805 non-relatives In group quarters: 125
Size of family households: 1,798 2-persons , 1,488 3-persons , 1,006 4-persons , 402 5-persons , 244 6-persons , 57 7-or-more-persons .
Size of nonfamily households: 2,609 1-person , 528 2-persons , 37 3-persons , 14 4-persons , 2 5-persons .
2,874 married couples with children. single-parent households (184 men , 564 women ).
87.3% of residents of Arbutus speak English at home. of residents speak Spanish at home (55% speak English very well , 30% speak English well , 7% speak English not well , 8% don't speak English at all ).of residents speak other Indo-European language at home (78% speak English very well , 19% speak English well , 3% speak English not well ).of residents speak Asian or Pacific Island language at home (38% speak English very well , 17% speak English well , 28% speak English not well , 17% don't speak English at all ).of residents speak other language at home (100% speak English very well ).
Foreign born population: 2,024 (10.1%)of them are naturalized citizens )
Median number of rooms in houses and condos:
Median number of rooms in apartments
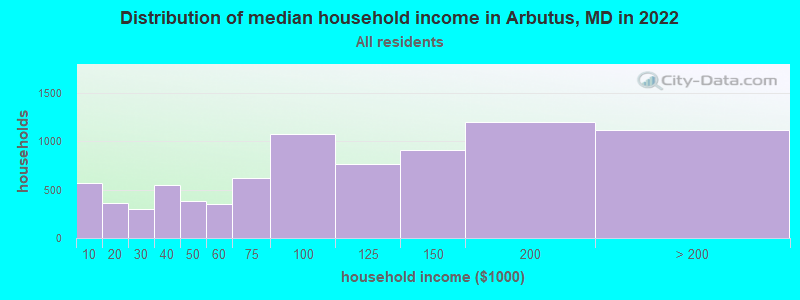
Arbutus, MD household income distribution 568 Less than $10,000364 $10,000 to $19,999301 $20,000 to $29,999546 $30,000 to $39,999383 $40,000 to $49,999352 $50,000 to $59,999622 $60,000 to $74,9991,076 $75,000 to $99,999767 $100,000 to $124,999909 $125,000 to $149,9991,202 $150,000 to $199,9991,118 $200,000 or more
Home value of owner - occupied houses in 2022 in Arbutus, MD 50 Less than $10,00011 $15,000 to $19,99920 $20,000 to $24,99928 $25,000 to $29,99969 $35,000 to $39,9998 $40,000 to $49,99926 $125,000 to $149,999117 $150,000 to $174,999242 $175,000 to $199,9991,289 $200,000 to $249,9991,459 $250,000 to $299,9992,042 $300,000 to $399,999522 $400,000 to $499,999219 $500,000 to $749,9995 $750,000 to $999,99914 $1,000,000 to $1,499,999Rent paid by renters in 2022 in Arbutus, MD 34 $500 to $54917 $550 to $5997 $600 to $64987 $700 to $74954 $750 to $799431 $800 to $899336 $900 to $999417 $1,000 to $1,249298 $1,250 to $1,499344 $1,500 to $1,99924 $2,000 to $2,49967 No cash rent
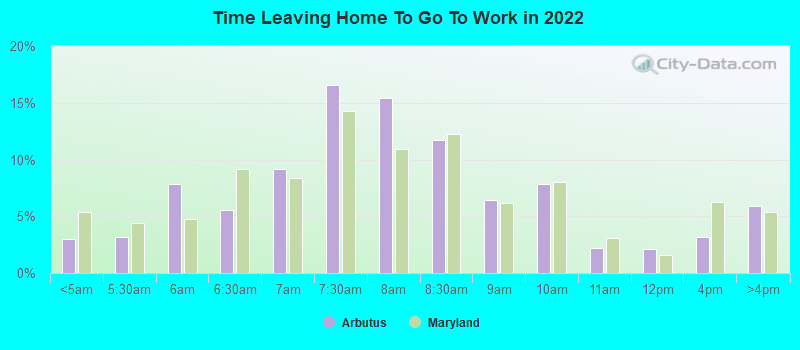
Percentage of workers working in this county: 46.3%Number of people working at home: 1,743 (15.7% of all workers )
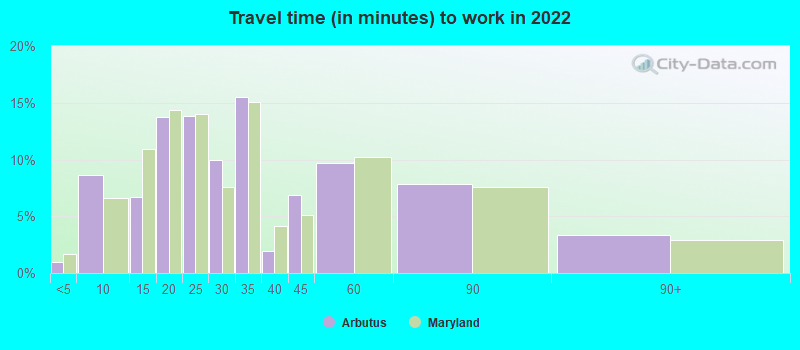
Travel time to work (commute)
Less than 5 minutes: 725 to 9 minutes: 89310 to 14 minutes: 82615 to 19 minutes: 2,09220 to 24 minutes: 1,76125 to 29 minutes: 1,00930 to 34 minutes: 1,69435 to 39 minutes: 29440 to 44 minutes: 25645 to 59 minutes: 29560 to 89 minutes: 36690 or more minutes: 40
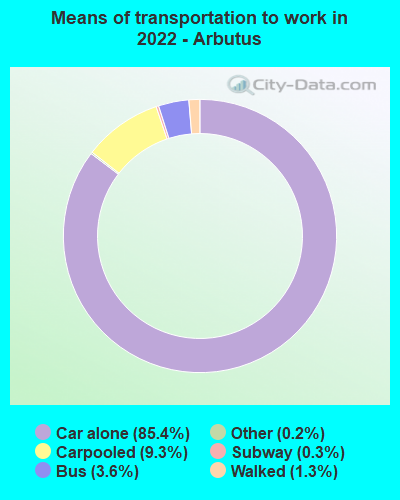
Means of transportation to work:
Drove a car alone: 8,199 (71.0%)Carpooled: 1,021 (8.8%)Bus : 210 (1.8%)Long-distance train or commuter rail : 55 (0.5%)Taxi: 18 (0.2%)Walked: 139 (1.2%)Worked at home: 1,743 (15.1%)
Unemployment by race in 2022
Unemployment rate for White non-Hispanic residents 5.2% Males3.2% FemalesUnemployment rate for Black residents 14.0% MalesUnemployment rate for Asian residents 3.8% FemalesUnemployment rate for two or more race residents 13.1% Males5.9% FemalesUnemployment rate for Hispanic or Latino residents 7.6% Males10.7% Females
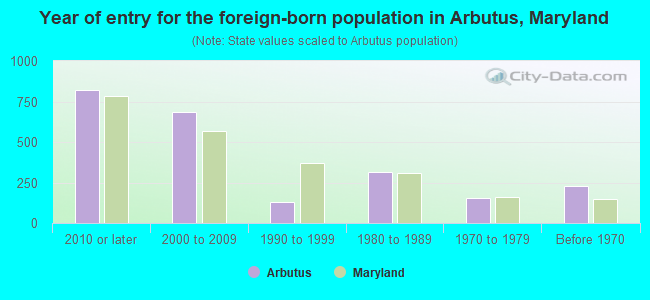
Year of entry for the foreign-born population in Arbutus, Maryland
818 2010 or later 687 2000 to 2009 127 1990 to 1999 317 1980 to 1989 155 1970 to 1979 231 Before 1970
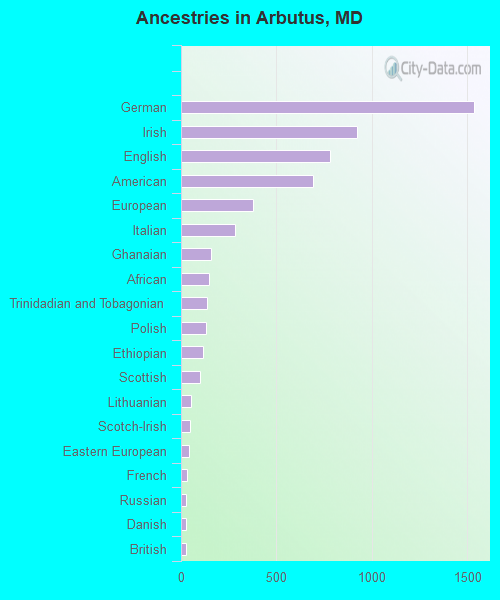
First ancestries reported:
German: 1,536 (17.1%)
Irish: 924 (10.3%)
English: 781 (8.7%)
American: 693 (7.7%)
European: 378 (4.2%)
Italian: 281 (3.1%)
Ghanaian: 156 (1.7%)
African: 146 (1.6%)
Trinidadian and Tobagonian: 138 (1.5%)
Polish: 131 (1.5%)
Ethiopian: 117 (1.3%)
Scottish: 99 (1.1%)
Lithuanian: 52 (0.6%)
Scotch-Irish: 46 (0.5%)
Eastern European: 42 (0.5%)
French: 32 (0.4%)
Russian: 27 (0.3%)
Danish: 26 (0.3%)
British: 25 (0.3%)
Swedish: 13 (0.1%)
Greek: 12 (0.1%)
Portuguese: 12 (0.1%)
Hungarian: 11 (0.1%)
Jamaican: 10 (0.1%)
Czechoslovakian: 6 (0.07%)
French Canadian: 5 (0.06%)
West Indian: 5 (0.06%)
Belizean: 3 (0.03%) Most common places of birth for foreign-born residents (%): Burma (Myanmar) Arbutus:
23.4% (477)Maryland:
0.5% (4,888)
China, excluding Hong Kong and Taiwan Arbutus:
9.7% (197)Maryland:
4.6% (44,742)
El Salvador Arbutus:
7.2% (147)Maryland:
12.0% (115,412)
Trinidad and Tobago Arbutus:
6.8% (138)Maryland:
1.2% (11,481)
Colombia Arbutus:
6.6% (134)Maryland:
1.3% (12,898)
Ethiopia Arbutus:
5.3% (109)Maryland:
3.2% (30,870)
Other Eastern Africa Arbutus:
4.0% (81)Maryland:
0.2% (2,108)
Bolivia Arbutus:
3.5% (72)Maryland:
0.7% (7,000)
Philippines Arbutus:
3.4% (69)Maryland:
3.8% (36,698)
India Arbutus:
3.3% (67)Maryland:
6.4% (61,725)
Sri Lanka Arbutus:
2.8% (58)Maryland:
0.4% (3,410)
Honduras Arbutus:
2.6% (52)Maryland:
2.5% (24,026)
Place of birth for U.S.-born residents:
This state: 13,924Other state: 3,942Northeast: 1,586Midwest: 476South: 1,438West: 401 84.2% of Arbutus residents lived in the same house 1 years ago.
Out of people who lived in different houses, 20.8% lived in this county.
Out of people who lived in different counties, 75.1% lived in Maryland.
Arbutus:
84.2%State average:
88.5%
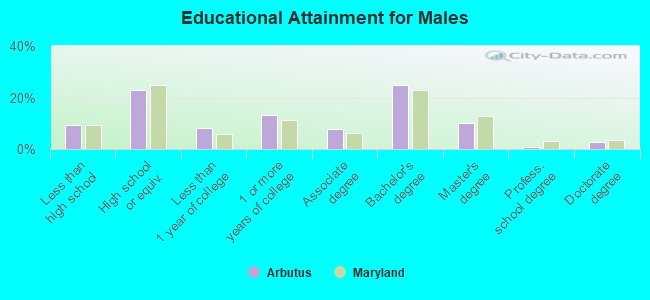
Education attainment for males 25 years and older:
No schooling: 66Nursery to 4th grade: 75th and 6th grade: 157th and 8th grade: 589th grade: 15610th grade: 11011th grade: 4512th grade, no diploma: 217High school graduate (or equivalency): 1,643Less than 1 year of college: 589Some college more than 1 year, no degree: 950Associate degree: 572Bachelor's degree: 1,805Master's degree: 743Professional school degree: 57Doctorate degree: 191
Education attainment for females 25 years and older:
No schooling: 234Nursery to 4th grade: 445th and 6th grade: 217th and 8th grade: 519th grade: 10510th grade: 1111th grade: 2312th grade, no diploma: 11High school graduate (or equivalency): 1,796Less than 1 year of college: 715Some college more than 1 year, no degree: 728Associate degree: 362Bachelor's degree: 1,601Master's degree: 1,073Professional school degree: 237Doctorate degree: 48
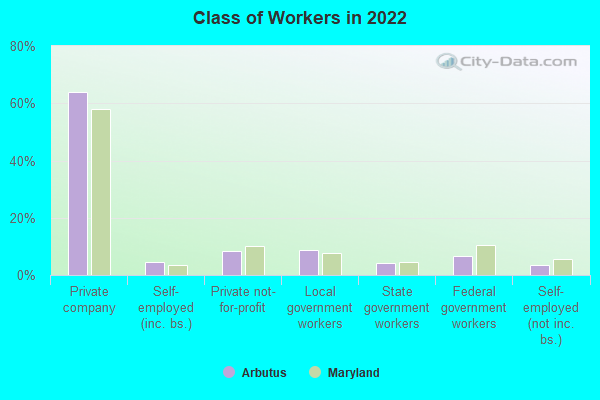
Housing units in structures:
One, detached: 4,641One, attached: 2,574Two: 2823 or 4: 4035 to 9: 43610 to 19: 13020 to 49: 6950 or more: 12Housing units lacking complete kitchen facilities in 2022: 1.7%House/condo owner moved in on average 12 years ago
Renter moved in on average 2 years ago
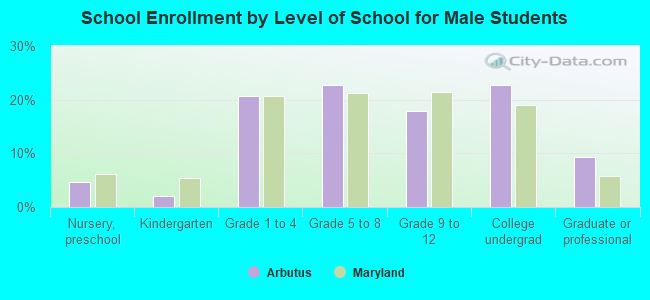
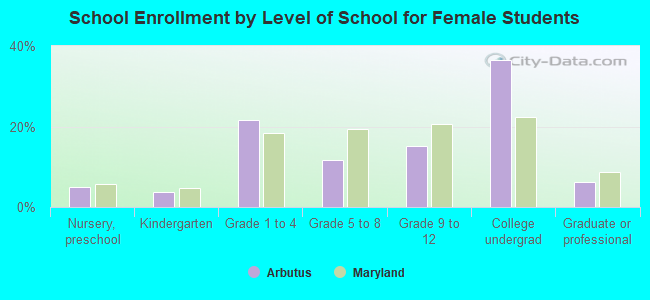
Private vs. public school enrollment:
Students in private schools in grades 1 to 8 (elementary and middle school): 174 Students in private schools in grades 9 to 12 (high school): 104 Students in private undergraduate colleges: 168