Apple Valley, MN (Minnesota) Houses and Residents
Estimated median house or condo value in 2022: $356,451 (it was $149,900 in 2000 )
Apple Valley:
$356,451Minnesota:
$314,600
Lower value quartile - upper value quartile: $269,507 - $468,583Mean price in 2022: Detached houses: $440,726 Here:
$440,726State:
$374,552
Townhouses or other attached units: $265,017 Here:
$265,017State:
$312,049
In 2-unit structures: $413,234 Here:
$413,234State:
$323,045
In 3-to-4-unit structures: $246,296 Here:
$246,296State:
$238,971
In 5-or-more-unit structures: $199,320 Here:
$199,320State:
$258,516
Mobile homes: $474,502 Here:
$474,502State:
$94,605
Total population: 50,487 (Urban population: 44,695, Rural population: 832 (all nonfarm) )
Houses: 22,438 (21,945 occupied: 16,646 owner occupied, 5,386 renter occupied )
% of renters here:
24%State:
28%
Housing density: 1,294 houses/condos per square mile
Median price asked for vacant for-sale houses and condos in 2022: $284,882.
Median contract rent in 2022: $1,443 (lower quartile is $1,117, upper quartile is $1,827)
Median rent asked for vacant for-rent units in 2022: $663
Median gross rent in Apple Valley, MN in 2022: $1,661
Housing units in Apple Valley with a mortgage: 11,309 (1,471 second mortgage, 0 home equity loan, 1,174 both second mortgage and home equity loan )Houses without a mortgage: 171
Median household income for houses/condos with a mortgage: $124,305
Median household income for apartments without a mortgage: $86,141
Median monthly housing costs: $1,579
Data:
Median house or condo value ($)
Median house or condo value ($ change since 2000)
Median house or condo value ($) - White
Median house or condo value ($) - Black or African American
Median house or condo value ($) - Asian
Median house or condo value ($) - Hispanic or Latino
Median house or condo value ($) - American Indian and Alaska Native
Median house or condo value ($) - Multirace
Median house or condo value ($) - Other Race
Median price asked for mobile homes ($)
Household density (households per square mile)
Mean house or condo value by units in structure - 1, detached ($)
Mean house or condo value by units in structure - 1, attached ($)
Mean house or condo value by units in structure - 2 ($)
Mean house or condo value by units in structure by units in structure - 3 or 4 ($)
Mean house or condo value by units in structure - 5 or more ($)
Mean house or condo value by units in structure - Boat, RV, van, etc. ($)
Mean house or condo value by units in structure - Mobile home ($)
Median contract rent ($)
Median contract rent - Lower quartile ($)
Median contract rent - Upper quartile ($)
Median gross rent ($)
Urban houses (%)
Rural houses (%)
Houses occupied (%)
Houses occupied (% change since 2000)
Houses owner occupied (%)
Houses owner occupied (% change since 2000)
Houses renter occupied (%)
Houses renter occupied (% change since 2000)
Vacant housing units - For rent (%)
Vacant housing units - For rent (% change since 2000)
Vacant housing units - For sale only (%)
Vacant housing units - For sale only (% change since 2000)
Vacant housing units - Rented or sold, not occupied (%)
Vacant housing units - Rented or sold, not occupied (% change since 2000)
Vacant housing units - For seasonal, recreational, or occasional use (%)
Vacant housing units - For seasonal, recreational, or occasional use (% change since 2000)
Vacant housing units - For migrant workers (%)
Vacant housing units - For migrant workers (% change since 2000)
Vacant housing units - Other vacant (%)
Vacant housing units - Other vacant (% change since 2000)
Median monthly housing costs ($)
Median household income for houses/condos with a mortgage ($)
Median household income for houses/condos without a mortgage ($)
Median household income ($)
Median household income ($) - White
Median household income ($) - Black or African American
Median household income ($) - Asian
Median household income ($) - Hispanic or Latino
Median household income ($) - American Indian and Alaska Native
Median household income ($) - Multirace
Median household income ($) - Other Race
Mortgage status - with mortgage (%)
Mortgage status - with second mortgage (%)
Mortgage status - with home equity loan (%)
Mortgage status - with both second mortgage and home equity loan (%)
Mortgage status - without a mortgage (%)
Median year house/condo built
Median year apartment built
Household type by relationship - Male householder living alone (%)
Household type by relationship - Male householder not living alone (%)
Household type by relationship - Female householder living alone (%)
Household type by relationship - Female householder not living alone (%)
Household type by relationship - Opposite-Sex spouse (%)
Household type by relationship - Same-Sex spouse (%)
Household type by relationship - Opposite-Sex unmarried partner (%)
Household type by relationship - Same-Sex unmarried partner (%)
Household type by relationship - In group quarters (%)
Size of family households - 2-person household (%)
Size of family households - 3-person household (%)
Size of family households - 4-person household (%)
Size of family households - 5-person household (%)
Size of family households - 6-person household (%)
Size of family households - 7-or-more-person household (%)
Size of nonfamily households - 1-person household (%)
Size of nonfamily households - 2-person household (%)
Size of nonfamily households - 3-person household (%)
Size of nonfamily households - 4-person household (%)
Size of nonfamily households - 5-person household (%)
Size of nonfamily households - 6-person household (%)
Size of nonfamily households - 7-or-moreperson household (%)
Year house built - Built 2010 or later (%)
Year house built - Built 2000 to 2009 (%)
Year house built - Built 1990 to 1999 (%)
Year house built - Built 1980 to 1989 (%)
Year house built - Built 1970 to 1979 (%)
Year house built - Built 1960 to 1969 (%)
Year house built - Built 1950 to 1959 (%)
Year house built - Built 1940 to 1949 (%)
Year house built - Built 1939 or earlier (%)
Median number of rooms in houses and condos
Median number of rooms in apartments
Median number of bedrooms in owner occupied houses
Mean number of bedrooms in owner occupied houses
Median number of bedrooms in renter occupied houses
Mean number of bedrooms in renter occupied houses
Median number of vehichles in owner occupied houses
Mean number of vehichles in owner occupied houses
Median number of vehichles in renter occupied houses
Mean number of vehichles in renter occupied houses
Rooms in owner-occupied houses - 1 room (%)
Rooms in owner-occupied houses - 2 rooms (%)
Rooms in owner-occupied houses - 3 rooms (%)
Rooms in owner-occupied houses - 4 rooms (%)
Rooms in owner-occupied houses - 5 rooms (%)
Rooms in owner-occupied houses - 6 rooms (%)
Rooms in owner-occupied houses - 7 rooms (%)
Rooms in owner-occupied houses - 8 rooms (%)
Rooms in owner-occupied houses - 9+ rooms (%)
Rooms in renter-occupied houses - 1 room (%)
Rooms in renter-occupied houses - 2 rooms (%)
Rooms in renter-occupied houses - 3 rooms (%)
Rooms in renter-occupied houses - 4 rooms (%)
Rooms in renter-occupied houses - 5 rooms (%)
Rooms in renter-occupied houses - 6 rooms (%)
Rooms in renter-occupied houses - 7 rooms (%)
Rooms in renter-occupied houses - 8 rooms (%)
Rooms in renter-occupied houses - 9+ rooms (%)
Bedrooms in owner-occupied houses - no bedrooms (%)
Bedrooms in owner-occupied houses - 1 bedroom (%)
Bedrooms in owner-occupied houses - 2 bedrooms (%)
Bedrooms in owner-occupied houses - 3 bedrooms (%)
Bedrooms in owner-occupied houses - 4 bedrooms (%)
Bedrooms in owner-occupied houses - 5+ bedrooms (%)
Bedrooms in renter-occupied houses - no bedrooms (%)
Bedrooms in renter-occupied houses - 1 bedroom (%)
Bedrooms in renter-occupied houses - 2 bedrooms (%)
Bedrooms in renter-occupied houses - 3 bedrooms (%)
Bedrooms in renter-occupied houses - 4 bedrooms (%)
Bedrooms in renter-occupied houses - 5+ bedrooms (%)
Vehicles available in owner-occupied houses - no vehicle available (%)
Vehicles available in owner-occupied houses - 1 vehicle available(%)
Vehicles available in owner-occupied houses - 2 Vehicles available (%)
Vehicles available in owner-occupied houses - 3 Vehicles available (%)
Vehicles available in owner-occupied houses - 4 Vehicles available (%)
Vehicles available in owner-occupied houses - 5+ Vehicles available (%)
Vehicles available in renter-occupied houses - no vehicle available (%)
Vehicles available in renter-occupied houses - 1 vehicle available (%)
Vehicles available in renter-occupied houses - 2 Vehicles available (%)
Vehicles available in renter-occupied houses - 3 Vehicles available (%)
Vehicles available in renter-occupied houses - 4 Vehicles available (%)
Vehicles available in renter-occupied houses - 5+ Vehicles available (%)
Housing units in structures - 1, detached (%)
Housing units in structures - 1, attached (%)
Housing units in structures - 2 (%)
Housing units in structures - 3 or 4 (%)
Housing units in structures - 5 to 9 (%)
Housing units in structures - 10 to 19 (%)
Housing units in structures - 20 to 49 (%)
Housing units in structures - 50 or more (%)
Housing units in structures - Mobile home (%)
Housing units in structures - Boat, RV, van, etc. (%)
Housing units in structures - Owners - 1, detached (%)
Housing units in structures - Owners - 1, attached (%)
Housing units in structures - Owners - 2 (%)
Housing units in structures - Owners - 3 or 4 (%)
Housing units in structures - Owners - 5 to 9 (%)
Housing units in structures - Owners - 10 to 19 (%)
Housing units in structures - Owners - 20 to 49 (%)
Housing units in structures - Owners - 50 or more (%)
Housing units in structures - Owners - Mobile home (%)
Housing units in structures - Owners - Boat, RV, van, etc. (%)
Housing units in structures - Renters - 1, detached (%)
Housing units in structures - Renters - 1, attached (%)
Housing units in structures - Renters - 2 (%)
Housing units in structures - Renters - 3 or 4 (%)
Housing units in structures - Renters - 5 to 9 (%)
Housing units in structures - Renters - 10 to 19 (%)
Housing units in structures - Renters - 20 to 49 (%)
Housing units in structures - Renters - 50 or more (%)
Housing units in structures - Renters - Mobile home (%)
Housing units in structures - Renters - Boat, RV, van, etc. (%)
House/condo owner moved in on average (years ago)
Renter moved in on average (years ago)
Year householder moved into unit - Moved in 1999 to March 2000 (%)
Year householder moved into unit - Moved in 1999 to March 2000 (%) - White
Year householder moved into unit - Moved in 1999 to March 2000 (%) - Black or African American
Year householder moved into unit - Moved in 1999 to March 2000 (%) - Asian
Year householder moved into unit - Moved in 1999 to March 2000 (%) - Hispanic or Latino
Year householder moved into unit - Moved in 1999 to March 2000 (%) - American Indian and Alaska Native
Year householder moved into unit - Moved in 1999 to March 2000 (%) - Multirace
Year householder moved into unit - Moved in 1999 to March 2000 (%) - Other Race
Year householder moved into unit - Moved in 1995 to 1998 (%)
Year householder moved into unit - Moved in 1995 to 1998 (%) - White
Year householder moved into unit - Moved in 1995 to 1998 (%) - Black or African American
Year householder moved into unit - Moved in 1995 to 1998 (%) - Asian
Year householder moved into unit - Moved in 1995 to 1998 (%) - Hispanic or Latino
Year householder moved into unit - Moved in 1995 to 1998 (%) - American Indian and Alaska Native
Year householder moved into unit - Moved in 1995 to 1998 (%) - Multirace
Year householder moved into unit - Moved in 1995 to 1998 (%) - Other Race
Year householder moved into unit - Moved in 1990 to 1994 (%)
Year householder moved into unit - Moved in 1990 to 1994 (%) - White
Year householder moved into unit - Moved in 1990 to 1994 (%) - Black or African American
Year householder moved into unit - Moved in 1990 to 1994 (%) - Asian
Year householder moved into unit - Moved in 1990 to 1994 (%) - Hispanic or Latino
Year householder moved into unit - Moved in 1990 to 1994 (%) - American Indian and Alaska Native
Year householder moved into unit - Moved in 1990 to 1994 (%) - Multirace
Year householder moved into unit - Moved in 1990 to 1994 (%) - Other Race
Year householder moved into unit - Moved in 1980 to 1989 (%)
Year householder moved into unit - Moved in 1980 to 1989 (%) - White
Year householder moved into unit - Moved in 1980 to 1989 (%) - Black or African American
Year householder moved into unit - Moved in 1980 to 1989 (%) - Asian
Year householder moved into unit - Moved in 1980 to 1989 (%) - Hispanic or Latino
Year householder moved into unit - Moved in 1980 to 1989 (%) - American Indian and Alaska Native
Year householder moved into unit - Moved in 1980 to 1989 (%) - Multirace
Year householder moved into unit - Moved in 1980 to 1989 (%) - Other Race
Year householder moved into unit - Moved in 1970 to 1979 (%)
Year householder moved into unit - Moved in 1970 to 1979 (%) - White
Year householder moved into unit - Moved in 1970 to 1979 (%) - Black or African American
Year householder moved into unit - Moved in 1970 to 1979 (%) - Asian
Year householder moved into unit - Moved in 1970 to 1979 (%) - Hispanic or Latino
Year householder moved into unit - Moved in 1970 to 1979 (%) - American Indian and Alaska Native
Year householder moved into unit - Moved in 1970 to 1979 (%) - Multirace
Year householder moved into unit - Moved in 1970 to 1979 (%) - Other Race
Year householder moved into unit - Moved in 1969 or earlier (%)
Year householder moved into unit - Moved in 1969 or earlier (%) - White
Year householder moved into unit - Moved in 1969 or earlier (%) - Black or African American
Year householder moved into unit - Moved in 1969 or earlier (%) - Asian
Year householder moved into unit - Moved in 1969 or earlier (%) - Hispanic or Latino
Year householder moved into unit - Moved in 1969 or earlier (%) - American Indian and Alaska Native
Year householder moved into unit - Moved in 1969 or earlier (%) - Multirace
Year householder moved into unit - Moved in 1969 or earlier (%) - Other Race
Housing units lacking complete plumbing facilities (%)
Housing units lacking complete kitchen facilities (%)
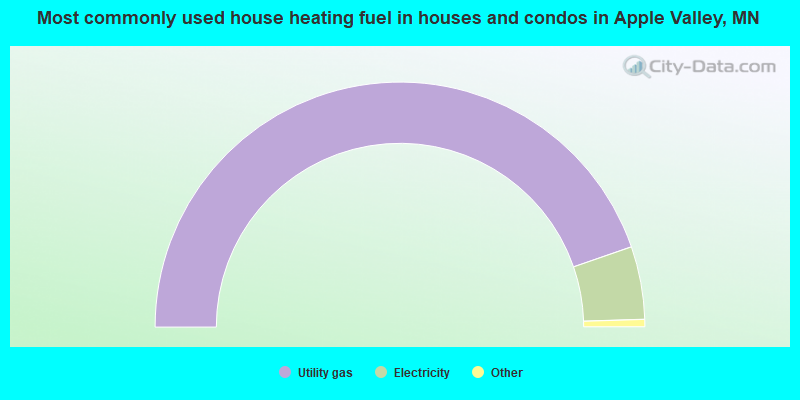
House heating fuel used in houses and condos - Utility gas (%)
House heating fuel used in houses and condos - Bottled, tank, or LP gas (%)
House heating fuel used in houses and condos - Electricity (%)
House heating fuel used in houses and condos - Fuel oil, kerosene, etc. (%)
House heating fuel used in houses and condos - Coal or coke (%)
House heating fuel used in houses and condos - Wood (%)
House heating fuel used in houses and condos - Solar energy (%)
House heating fuel used in houses and condos - Other fuel (%)
House heating fuel used in houses and condos - No fuel used (%)
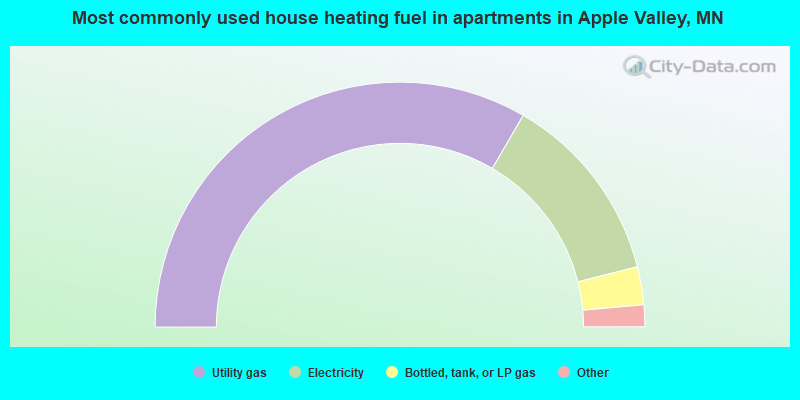
House heating fuel used in apartments - Utility gas (%)
House heating fuel used in apartments - Bottled, tank, or LP gas (%)
House heating fuel used in apartments - Electricity (%)
House heating fuel used in apartments - Fuel oil, kerosene, etc. (%)
House heating fuel used in apartments - Coal or coke (%)
House heating fuel used in apartments - Wood (%)
House heating fuel used in apartments - Solar energy (%)
House heating fuel used in apartments - Other fuel (%)
House heating fuel used in apartments - No fuel used (%)
Median year house/condo built: 1988Median year apartment built: 2000Household type by relationship:
Households: 56,120
Male householders: 10,000 (1,638 living alone ), Female householders: 11,512 (3,661 living alone )11,550 spouses (11,346 opposite-sex spouses ), 1,686 unmarried partners , (1,666 opposite-sex unmarried partners ), 17,463 children (15,984 natural , 620 adopted , 859 stepchildren ), 816 grandchildren , 473 brothers or sisters , 362 parents , 14 foster children , 578 other relatives , 1,248 non-relatives In group quarters: 412
Size of family households: 6,829 2-persons , 3,136 3-persons , 2,828 4-persons , 1,176 5-persons , 440 6-persons , 349 7-or-more-persons .
Size of nonfamily households: 5,324 1-person , 1,634 2-persons , 180 3-persons , 149 4-persons .
10,598 married couples with children. single-parent households (1,004 men , 1,779 women ).
84.0% of residents of Apple Valley speak English at home. of residents speak Spanish at home (50% speak English very well , 19% speak English well , 29% speak English not well , 3% don't speak English at all ).of residents speak other Indo-European language at home (64% speak English very well , 17% speak English well , 12% speak English not well , 7% don't speak English at all ).of residents speak Asian or Pacific Island language at home (60% speak English very well , 26% speak English well , 12% speak English not well , 2% don't speak English at all ).of residents speak other language at home (70% speak English very well , 23% speak English well , 6% speak English not well , 1% don't speak English at all ).
Foreign born population: 7,223 (12.9%)of them are naturalized citizens )
Median number of rooms in houses and condos:
Median number of rooms in apartments
Owner-occupied Renter-occupied
Rooms in owner-occupied houses in Apple Valley, Minnesota
0 1 room 3 2 rooms 515 3 rooms 1,234 4 rooms 1,867 5 rooms 2,178 6 rooms 2,376 7 rooms 2,677 8 rooms 5,796 9+ rooms
Rooms in renter-occupied apartments in Apple Valley, Minnesota
305 1 room 332 2 rooms 1,014 3 rooms 1,186 4 rooms 930 5 rooms 883 6 rooms 392 7 rooms 247 8 rooms 97 9+ rooms
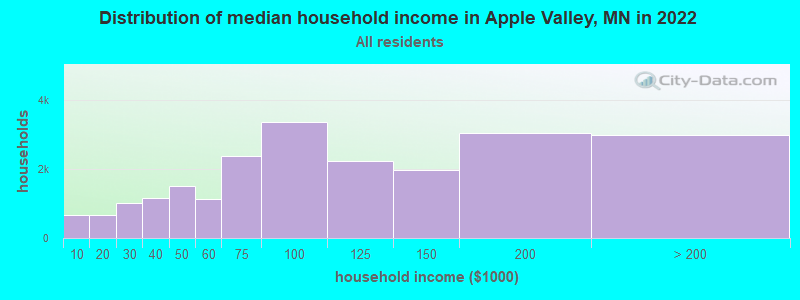
Apple Valley, MN household income distribution 662 Less than $10,000674 $10,000 to $19,9991,013 $20,000 to $29,9991,151 $30,000 to $39,9991,502 $40,000 to $49,9991,135 $50,000 to $59,9992,370 $60,000 to $74,9993,361 $75,000 to $99,9992,228 $100,000 to $124,9991,975 $125,000 to $149,9993,030 $150,000 to $199,9992,995 $200,000 or more
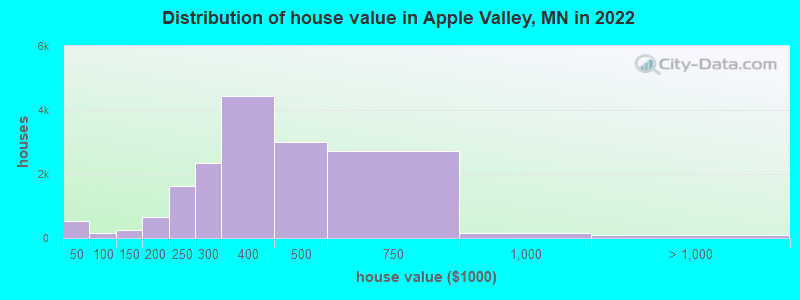
Home value of owner - occupied houses in 2022 in Apple Valley, MN 97 Less than $10,00033 $10,000 to $14,99985 $15,000 to $19,99917 $20,000 to $24,999110 $25,000 to $29,99990 $30,000 to $34,99976 $35,000 to $39,9997 $40,000 to $49,99912 $50,000 to $59,99915 $60,000 to $69,99912 $70,000 to $79,99985 $80,000 to $89,99911 $90,000 to $99,999107 $100,000 to $124,999140 $125,000 to $149,999184 $150,000 to $174,999459 $175,000 to $199,9991,637 $200,000 to $249,9992,346 $250,000 to $299,9994,445 $300,000 to $399,9992,994 $400,000 to $499,9992,730 $500,000 to $749,999162 $750,000 to $999,99979 $1,000,000 to $1,499,99918 $2,000,000 or moreRent paid by renters in 2022 in Apple Valley, MN 34 $200 to $2497 $250 to $29928 $300 to $34935 $350 to $39937 $400 to $44915 $450 to $49983 $500 to $54959 $550 to $59910 $700 to $74987 $750 to $799393 $800 to $899395 $900 to $999725 $1,000 to $1,2491,433 $1,250 to $1,4991,672 $1,500 to $1,999447 $2,000 to $2,49991 $2,500 to $2,99976 $3,000 to $3,499206 $3,500 or more161 No cash rent
Percentage of workers working in this county: 61.0%Number of people working at home: 6,639 (22.9% of all workers )
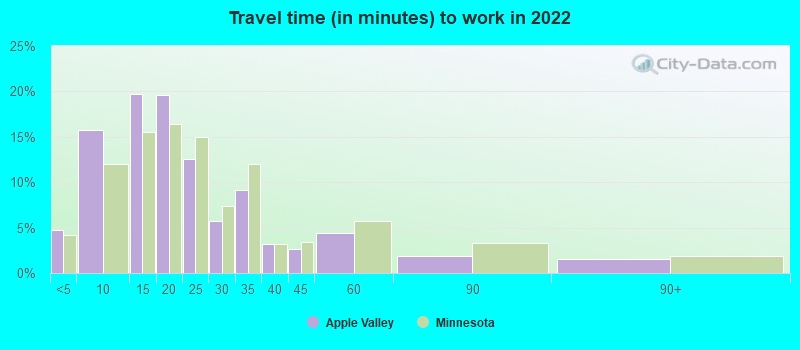
Travel time to work (commute)
Less than 5 minutes: 5985 to 9 minutes: 1,57310 to 14 minutes: 3,02415 to 19 minutes: 3,74220 to 24 minutes: 3,70725 to 29 minutes: 2,23930 to 34 minutes: 3,18435 to 39 minutes: 85940 to 44 minutes: 89045 to 59 minutes: 1,58460 to 89 minutes: 44790 or more minutes: 500
Means of transportation to work:
Drove a car alone: 11,198 (56.9%)Carpooled: 1,461 (7.4%)Bus : 166 (0.8%)Taxi: 431 (2.2%)Bicycle: 73 (0.4%)Walked: 301 (1.5%)Worked at home: 6,639 (33.8%)
Unemployment by race in 2022
Unemployment rate for White non-Hispanic residents 3.1% Males2.7% FemalesUnemployment rate for Black residents 10.9% Males0.8% FemalesUnemployment rate for Asian residents 1.0% FemalesUnemployment rate for other race residents 6.1% MalesUnemployment rate for two or more race residents 8.5% Males12.7% FemalesUnemployment rate for Hispanic or Latino residents 7.1% Males9.2% Females
Year of entry for the foreign-born population in Apple Valley, Minnesota
2,908 2010 or later 1,609 2000 to 2009 1,770 1990 to 1999 776 1980 to 1989 342 1970 to 1979 293 Before 1970
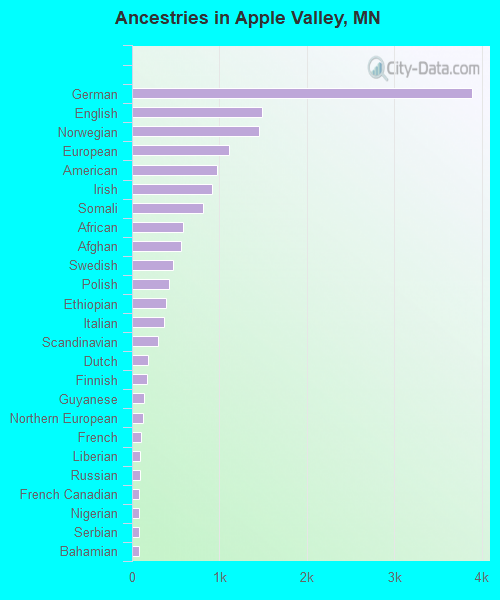
First ancestries reported:
German: 3,886 (17.4%)
English: 1,484 (6.6%)
Norwegian: 1,450 (6.5%)
European: 1,104 (4.9%)
American: 970 (4.3%)
Irish: 913 (4.1%)
Somali: 813 (3.6%)
African: 582 (2.6%)
Afghan: 556 (2.5%)
Swedish: 464 (2.1%)
Polish: 427 (1.9%)
Ethiopian: 393 (1.8%)
Italian: 369 (1.6%)
Scandinavian: 297 (1.3%)
Dutch: 188 (0.8%)
Finnish: 166 (0.7%)
Guyanese: 139 (0.6%)
Northern European: 129 (0.6%)
French: 104 (0.5%)
Liberian: 94 (0.4%)
Russian: 90 (0.4%)
French Canadian: 85 (0.4%)
Nigerian: 84 (0.4%)
Serbian: 83 (0.4%)
Bahamian: 81 (0.4%)
Swiss: 70 (0.3%)
British: 66 (0.3%)
Czech: 65 (0.3%)
Scotch-Irish: 62 (0.3%)
Syrian: 56 (0.3%)
Danish: 54 (0.2%)
Austrian: 49 (0.2%)
Slovak: 46 (0.2%)
Jamaican: 43 (0.2%)
New Zealander: 41 (0.2%)
Eastern European: 38 (0.2%)
Welsh: 38 (0.2%)
Turkish: 34 (0.2%)
Ukrainian: 32 (0.1%)
Greek: 30 (0.1%)
Portuguese: 29 (0.1%)
Kenyan: 28 (0.1%)
Czechoslovakian: 27 (0.1%)
Bulgarian: 22 (0.10%)
Slovene: 18 (0.08%)
Hungarian: 14 (0.06%)
Scottish: 12 (0.05%)
Romanian: 12 (0.05%)
Moroccan: 12 (0.05%)
Slavic: 4 (0.02%)
Most common places of birth for foreign-born residents (%): Mexico Apple Valley:
12.3% (863)Minnesota:
12.1% (58,312)
Ethiopia Apple Valley:
11.5% (808)Minnesota:
5.1% (24,630)
Afghanistan Apple Valley:
8.6% (604)Minnesota:
0.2% (1,107)
India Apple Valley:
8.1% (570)Minnesota:
6.7% (32,141)
Somalia Apple Valley:
7.3% (511)Minnesota:
8.0% (38,461)
Vietnam Apple Valley:
4.8% (338)Minnesota:
3.8% (18,442)
Philippines Apple Valley:
4.5% (320)Minnesota:
2.0% (9,850)
Kenya Apple Valley:
3.0% (211)Minnesota:
3.3% (15,701)
Nigeria Apple Valley:
2.2% (153)Minnesota:
1.7% (8,263)
China, excluding Hong Kong and Taiwan Apple Valley:
1.9% (133)Minnesota:
3.6% (17,119)
Dominican Republic Apple Valley:
1.8% (129)Minnesota:
0.3% (1,665)
Canada Apple Valley:
1.6% (116)Minnesota:
2.5% (11,939)
Japan Apple Valley:
1.5% (109)Minnesota:
0.5% (2,345)
Trinidad and Tobago Apple Valley:
1.5% (108)Minnesota:
0.2% (804)
Place of birth for U.S.-born residents:
This state: 32,360Other state: 15,814Northeast: 1,155Midwest: 9,472South: 3,011West: 2,235 86.6% of Apple Valley residents lived in the same house 1 years ago.
Out of people who lived in different houses, 31.6% lived in this county.
Out of people who lived in different counties, 85.8% lived in Minnesota.
Apple Valley:
86.6%State average:
87.4%
Education attainment for males 25 years and older:
No schooling: 294Nursery to 4th grade: 05th and 6th grade: 07th and 8th grade: 799th grade: 010th grade: 1011th grade: 4012th grade, no diploma: 178High school graduate (or equivalency): 3,409Less than 1 year of college: 1,273Some college more than 1 year, no degree: 2,513Associate degree: 1,650Bachelor's degree: 5,801Master's degree: 1,988Professional school degree: 433Doctorate degree: 191
Education attainment for females 25 years and older:
No schooling: 182Nursery to 4th grade: 755th and 6th grade: 497th and 8th grade: 599th grade: 10610th grade: 2411th grade: 16512th grade, no diploma: 234High school graduate (or equivalency): 3,601Less than 1 year of college: 1,108Some college more than 1 year, no degree: 2,442Associate degree: 2,220Bachelor's degree: 6,147Master's degree: 2,478Professional school degree: 455Doctorate degree: 290
Housing units in structures:
One, detached: 11,812One, attached: 5,890Two: 233 or 4: 3155 to 9: 26110 to 19: 40920 to 49: 1,01150 or more: 2,210Mobile homes: 503Median worth of mobile homes: $26,013
Housing units lacking complete plumbing facilities in 2022: 0.1%Housing units lacking complete kitchen facilities in 2022: 0.7%House/condo owner moved in on average 11 years ago
Renter moved in on average 1 years ago
Private vs. public school enrollment:
Students in private schools in grades 1 to 8 (elementary and middle school): 503 Students in private schools in grades 9 to 12 (high school): 168 Students in private undergraduate colleges: 484 Here:
24.2%Minnesota:
26.2%