Annapolis, MD (Maryland) Houses and Residents
Estimated median house or condo value in 2022: $496,974 (it was $161,700 in 2000 )
Annapolis:
$496,974Maryland:
$398,100
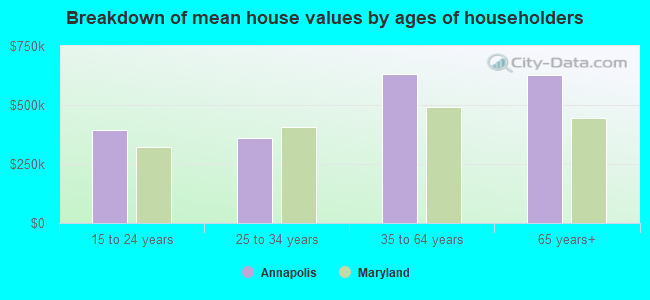
Lower value quartile - upper value quartile: $339,427 - $744,758Mean price in 2022: Detached houses: $867,207 Here:
$867,207State:
$526,819
Townhouses or other attached units: $504,835 Here:
$504,835State:
$328,305
In 2-unit structures: $553,629 Here:
$553,629State:
$346,599
In 3-to-4-unit structures: $704,155 Here:
$704,155State:
$295,378
In 5-or-more-unit structures: $488,683 Here:
$488,683State:
$350,378
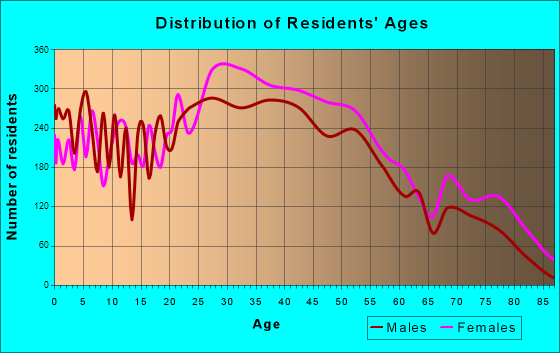
Total population: 38,856 (Urban population: 35,806, Rural population: 0)
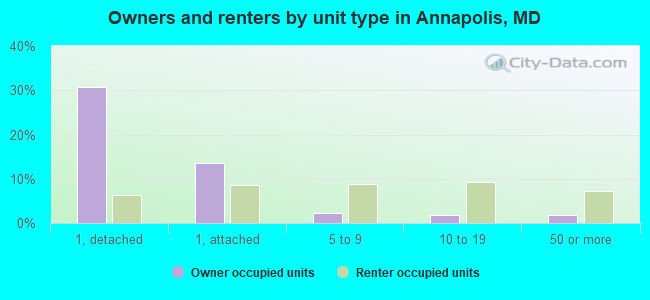
Houses: 18,662 (17,210 occupied: 10,350 owner occupied, 6,969 renter occupied )
% of renters here:
40%State:
32%
Housing density: 2,773 houses/condos per square mile
Median price asked for vacant for-sale houses and condos in 2022: $854,982.
Median contract rent in 2022: $1,559 (lower quartile is $1,010, upper quartile is $1,989)
Median rent asked for vacant for-rent units in 2022: $1,990
Median gross rent in Annapolis, MD in 2022: $1,651
Housing units in Annapolis with a mortgage: 7,181 (717 second mortgage, 0 home equity loan, 694 both second mortgage and home equity loan )Houses without a mortgage: 230
Median household income for houses/condos with a mortgage: $141,156
Median household income for apartments without a mortgage: $95,840
Median monthly housing costs: $1,753
Data:
Median house or condo value ($)
Median house or condo value ($ change since 2000)
Median house or condo value ($) - White
Median house or condo value ($) - Black or African American
Median house or condo value ($) - Asian
Median house or condo value ($) - Hispanic or Latino
Median house or condo value ($) - American Indian and Alaska Native
Median house or condo value ($) - Multirace
Median house or condo value ($) - Other Race
Median price asked for mobile homes ($)
Household density (households per square mile)
Mean house or condo value by units in structure - 1, detached ($)
Mean house or condo value by units in structure - 1, attached ($)
Mean house or condo value by units in structure - 2 ($)
Mean house or condo value by units in structure by units in structure - 3 or 4 ($)
Mean house or condo value by units in structure - 5 or more ($)
Mean house or condo value by units in structure - Boat, RV, van, etc. ($)
Mean house or condo value by units in structure - Mobile home ($)
Median contract rent ($)
Median contract rent - Lower quartile ($)
Median contract rent - Upper quartile ($)
Median gross rent ($)
Urban houses (%)
Rural houses (%)
Houses occupied (%)
Houses occupied (% change since 2000)
Houses owner occupied (%)
Houses owner occupied (% change since 2000)
Houses renter occupied (%)
Houses renter occupied (% change since 2000)
Vacant housing units - For rent (%)
Vacant housing units - For rent (% change since 2000)
Vacant housing units - For sale only (%)
Vacant housing units - For sale only (% change since 2000)
Vacant housing units - Rented or sold, not occupied (%)
Vacant housing units - Rented or sold, not occupied (% change since 2000)
Vacant housing units - For seasonal, recreational, or occasional use (%)
Vacant housing units - For seasonal, recreational, or occasional use (% change since 2000)
Vacant housing units - For migrant workers (%)
Vacant housing units - For migrant workers (% change since 2000)
Vacant housing units - Other vacant (%)
Vacant housing units - Other vacant (% change since 2000)
Median monthly housing costs ($)
Median household income for houses/condos with a mortgage ($)
Median household income for houses/condos without a mortgage ($)
Median household income ($)
Median household income ($) - White
Median household income ($) - Black or African American
Median household income ($) - Asian
Median household income ($) - Hispanic or Latino
Median household income ($) - American Indian and Alaska Native
Median household income ($) - Multirace
Median household income ($) - Other Race
Mortgage status - with mortgage (%)
Mortgage status - with second mortgage (%)
Mortgage status - with home equity loan (%)
Mortgage status - with both second mortgage and home equity loan (%)
Mortgage status - without a mortgage (%)
Median year house/condo built
Median year apartment built
Household type by relationship - Male householder living alone (%)
Household type by relationship - Male householder not living alone (%)
Household type by relationship - Female householder living alone (%)
Household type by relationship - Female householder not living alone (%)
Household type by relationship - Opposite-Sex spouse (%)
Household type by relationship - Same-Sex spouse (%)
Household type by relationship - Opposite-Sex unmarried partner (%)
Household type by relationship - Same-Sex unmarried partner (%)
Household type by relationship - In group quarters (%)
Size of family households - 2-person household (%)
Size of family households - 3-person household (%)
Size of family households - 4-person household (%)
Size of family households - 5-person household (%)
Size of family households - 6-person household (%)
Size of family households - 7-or-more-person household (%)
Size of nonfamily households - 1-person household (%)
Size of nonfamily households - 2-person household (%)
Size of nonfamily households - 3-person household (%)
Size of nonfamily households - 4-person household (%)
Size of nonfamily households - 5-person household (%)
Size of nonfamily households - 6-person household (%)
Size of nonfamily households - 7-or-moreperson household (%)
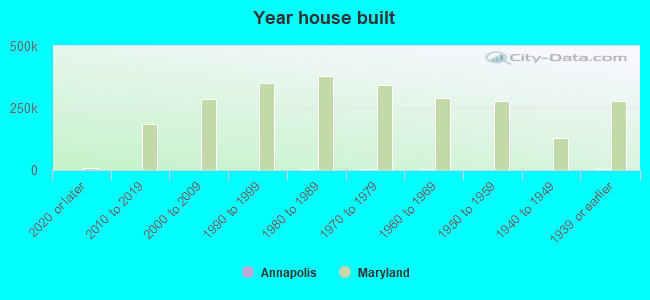
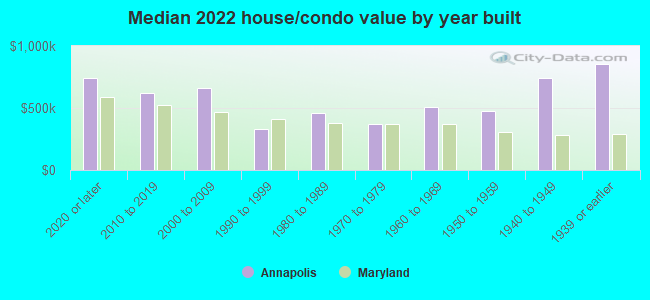
Year house built - Built 2010 or later (%)
Year house built - Built 2000 to 2009 (%)
Year house built - Built 1990 to 1999 (%)
Year house built - Built 1980 to 1989 (%)
Year house built - Built 1970 to 1979 (%)
Year house built - Built 1960 to 1969 (%)
Year house built - Built 1950 to 1959 (%)
Year house built - Built 1940 to 1949 (%)
Year house built - Built 1939 or earlier (%)
Median number of rooms in houses and condos
Median number of rooms in apartments
Median number of bedrooms in owner occupied houses
Mean number of bedrooms in owner occupied houses
Median number of bedrooms in renter occupied houses
Mean number of bedrooms in renter occupied houses
Median number of vehichles in owner occupied houses
Mean number of vehichles in owner occupied houses
Median number of vehichles in renter occupied houses
Mean number of vehichles in renter occupied houses
Rooms in owner-occupied houses - 1 room (%)
Rooms in owner-occupied houses - 2 rooms (%)
Rooms in owner-occupied houses - 3 rooms (%)
Rooms in owner-occupied houses - 4 rooms (%)
Rooms in owner-occupied houses - 5 rooms (%)
Rooms in owner-occupied houses - 6 rooms (%)
Rooms in owner-occupied houses - 7 rooms (%)
Rooms in owner-occupied houses - 8 rooms (%)
Rooms in owner-occupied houses - 9+ rooms (%)
Rooms in renter-occupied houses - 1 room (%)
Rooms in renter-occupied houses - 2 rooms (%)
Rooms in renter-occupied houses - 3 rooms (%)
Rooms in renter-occupied houses - 4 rooms (%)
Rooms in renter-occupied houses - 5 rooms (%)
Rooms in renter-occupied houses - 6 rooms (%)
Rooms in renter-occupied houses - 7 rooms (%)
Rooms in renter-occupied houses - 8 rooms (%)
Rooms in renter-occupied houses - 9+ rooms (%)
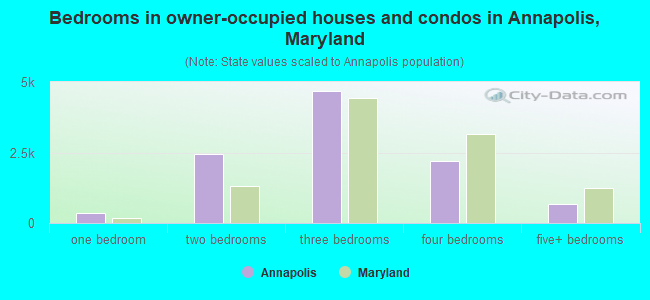
Bedrooms in owner-occupied houses - no bedrooms (%)
Bedrooms in owner-occupied houses - 1 bedroom (%)
Bedrooms in owner-occupied houses - 2 bedrooms (%)
Bedrooms in owner-occupied houses - 3 bedrooms (%)
Bedrooms in owner-occupied houses - 4 bedrooms (%)
Bedrooms in owner-occupied houses - 5+ bedrooms (%)
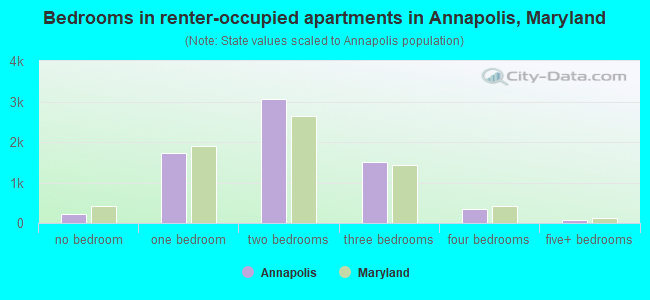
Bedrooms in renter-occupied houses - no bedrooms (%)
Bedrooms in renter-occupied houses - 1 bedroom (%)
Bedrooms in renter-occupied houses - 2 bedrooms (%)
Bedrooms in renter-occupied houses - 3 bedrooms (%)
Bedrooms in renter-occupied houses - 4 bedrooms (%)
Bedrooms in renter-occupied houses - 5+ bedrooms (%)
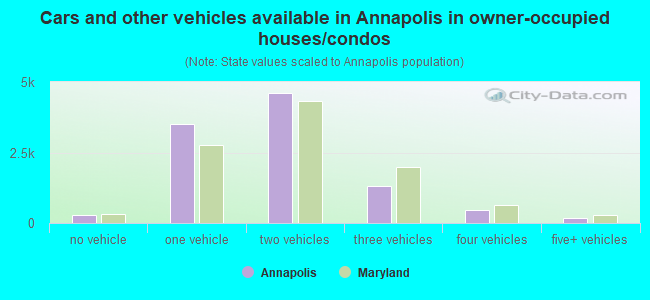
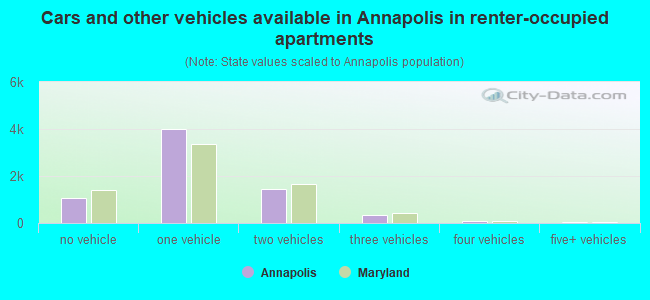
Vehicles available in owner-occupied houses - no vehicle available (%)
Vehicles available in owner-occupied houses - 1 vehicle available(%)
Vehicles available in owner-occupied houses - 2 Vehicles available (%)
Vehicles available in owner-occupied houses - 3 Vehicles available (%)
Vehicles available in owner-occupied houses - 4 Vehicles available (%)
Vehicles available in owner-occupied houses - 5+ Vehicles available (%)
Vehicles available in renter-occupied houses - no vehicle available (%)
Vehicles available in renter-occupied houses - 1 vehicle available (%)
Vehicles available in renter-occupied houses - 2 Vehicles available (%)
Vehicles available in renter-occupied houses - 3 Vehicles available (%)
Vehicles available in renter-occupied houses - 4 Vehicles available (%)
Vehicles available in renter-occupied houses - 5+ Vehicles available (%)
Housing units in structures - 1, detached (%)
Housing units in structures - 1, attached (%)
Housing units in structures - 2 (%)
Housing units in structures - 3 or 4 (%)
Housing units in structures - 5 to 9 (%)
Housing units in structures - 10 to 19 (%)
Housing units in structures - 20 to 49 (%)
Housing units in structures - 50 or more (%)
Housing units in structures - Mobile home (%)
Housing units in structures - Boat, RV, van, etc. (%)
Housing units in structures - Owners - 1, detached (%)
Housing units in structures - Owners - 1, attached (%)
Housing units in structures - Owners - 2 (%)
Housing units in structures - Owners - 3 or 4 (%)
Housing units in structures - Owners - 5 to 9 (%)
Housing units in structures - Owners - 10 to 19 (%)
Housing units in structures - Owners - 20 to 49 (%)
Housing units in structures - Owners - 50 or more (%)
Housing units in structures - Owners - Mobile home (%)
Housing units in structures - Owners - Boat, RV, van, etc. (%)
Housing units in structures - Renters - 1, detached (%)
Housing units in structures - Renters - 1, attached (%)
Housing units in structures - Renters - 2 (%)
Housing units in structures - Renters - 3 or 4 (%)
Housing units in structures - Renters - 5 to 9 (%)
Housing units in structures - Renters - 10 to 19 (%)
Housing units in structures - Renters - 20 to 49 (%)
Housing units in structures - Renters - 50 or more (%)
Housing units in structures - Renters - Mobile home (%)
Housing units in structures - Renters - Boat, RV, van, etc. (%)
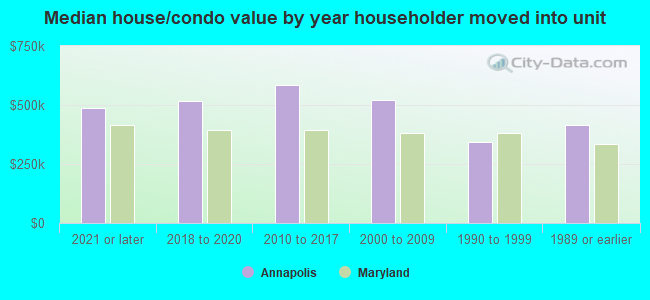
House/condo owner moved in on average (years ago)
Renter moved in on average (years ago)
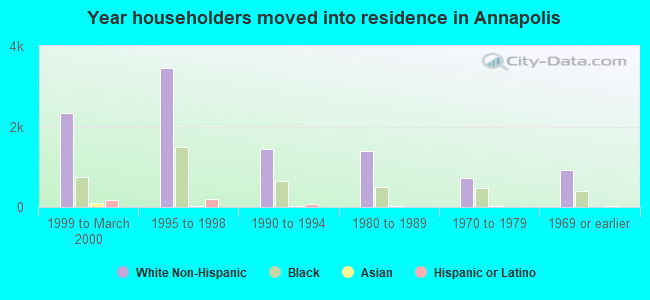
Year householder moved into unit - Moved in 1999 to March 2000 (%)
Year householder moved into unit - Moved in 1999 to March 2000 (%) - White
Year householder moved into unit - Moved in 1999 to March 2000 (%) - Black or African American
Year householder moved into unit - Moved in 1999 to March 2000 (%) - Asian
Year householder moved into unit - Moved in 1999 to March 2000 (%) - Hispanic or Latino
Year householder moved into unit - Moved in 1999 to March 2000 (%) - American Indian and Alaska Native
Year householder moved into unit - Moved in 1999 to March 2000 (%) - Multirace
Year householder moved into unit - Moved in 1999 to March 2000 (%) - Other Race
Year householder moved into unit - Moved in 1995 to 1998 (%)
Year householder moved into unit - Moved in 1995 to 1998 (%) - White
Year householder moved into unit - Moved in 1995 to 1998 (%) - Black or African American
Year householder moved into unit - Moved in 1995 to 1998 (%) - Asian
Year householder moved into unit - Moved in 1995 to 1998 (%) - Hispanic or Latino
Year householder moved into unit - Moved in 1995 to 1998 (%) - American Indian and Alaska Native
Year householder moved into unit - Moved in 1995 to 1998 (%) - Multirace
Year householder moved into unit - Moved in 1995 to 1998 (%) - Other Race
Year householder moved into unit - Moved in 1990 to 1994 (%)
Year householder moved into unit - Moved in 1990 to 1994 (%) - White
Year householder moved into unit - Moved in 1990 to 1994 (%) - Black or African American
Year householder moved into unit - Moved in 1990 to 1994 (%) - Asian
Year householder moved into unit - Moved in 1990 to 1994 (%) - Hispanic or Latino
Year householder moved into unit - Moved in 1990 to 1994 (%) - American Indian and Alaska Native
Year householder moved into unit - Moved in 1990 to 1994 (%) - Multirace
Year householder moved into unit - Moved in 1990 to 1994 (%) - Other Race
Year householder moved into unit - Moved in 1980 to 1989 (%)
Year householder moved into unit - Moved in 1980 to 1989 (%) - White
Year householder moved into unit - Moved in 1980 to 1989 (%) - Black or African American
Year householder moved into unit - Moved in 1980 to 1989 (%) - Asian
Year householder moved into unit - Moved in 1980 to 1989 (%) - Hispanic or Latino
Year householder moved into unit - Moved in 1980 to 1989 (%) - American Indian and Alaska Native
Year householder moved into unit - Moved in 1980 to 1989 (%) - Multirace
Year householder moved into unit - Moved in 1980 to 1989 (%) - Other Race
Year householder moved into unit - Moved in 1970 to 1979 (%)
Year householder moved into unit - Moved in 1970 to 1979 (%) - White
Year householder moved into unit - Moved in 1970 to 1979 (%) - Black or African American
Year householder moved into unit - Moved in 1970 to 1979 (%) - Asian
Year householder moved into unit - Moved in 1970 to 1979 (%) - Hispanic or Latino
Year householder moved into unit - Moved in 1970 to 1979 (%) - American Indian and Alaska Native
Year householder moved into unit - Moved in 1970 to 1979 (%) - Multirace
Year householder moved into unit - Moved in 1970 to 1979 (%) - Other Race
Year householder moved into unit - Moved in 1969 or earlier (%)
Year householder moved into unit - Moved in 1969 or earlier (%) - White
Year householder moved into unit - Moved in 1969 or earlier (%) - Black or African American
Year householder moved into unit - Moved in 1969 or earlier (%) - Asian
Year householder moved into unit - Moved in 1969 or earlier (%) - Hispanic or Latino
Year householder moved into unit - Moved in 1969 or earlier (%) - American Indian and Alaska Native
Year householder moved into unit - Moved in 1969 or earlier (%) - Multirace
Year householder moved into unit - Moved in 1969 or earlier (%) - Other Race
Housing units lacking complete plumbing facilities (%)
Housing units lacking complete kitchen facilities (%)
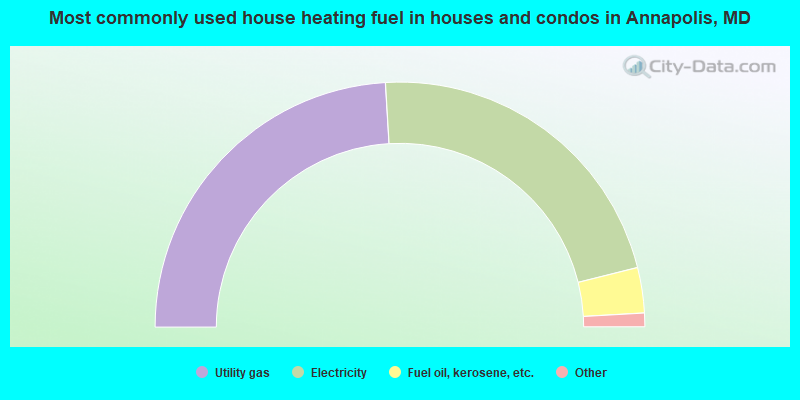
House heating fuel used in houses and condos - Utility gas (%)
House heating fuel used in houses and condos - Bottled, tank, or LP gas (%)
House heating fuel used in houses and condos - Electricity (%)
House heating fuel used in houses and condos - Fuel oil, kerosene, etc. (%)
House heating fuel used in houses and condos - Coal or coke (%)
House heating fuel used in houses and condos - Wood (%)
House heating fuel used in houses and condos - Solar energy (%)
House heating fuel used in houses and condos - Other fuel (%)
House heating fuel used in houses and condos - No fuel used (%)
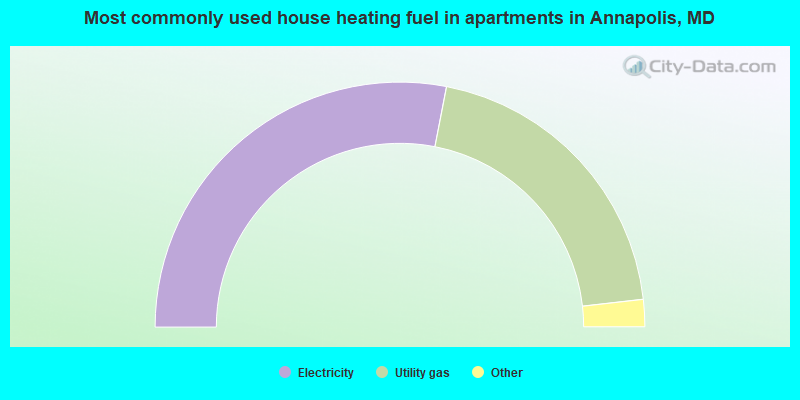
House heating fuel used in apartments - Utility gas (%)
House heating fuel used in apartments - Bottled, tank, or LP gas (%)
House heating fuel used in apartments - Electricity (%)
House heating fuel used in apartments - Fuel oil, kerosene, etc. (%)
House heating fuel used in apartments - Coal or coke (%)
House heating fuel used in apartments - Wood (%)
House heating fuel used in apartments - Solar energy (%)
House heating fuel used in apartments - Other fuel (%)
House heating fuel used in apartments - No fuel used (%)
Latest news about housing in Annapolis, MD collected exclusively by city-data.com from local newspapers, TV, and radio stations
Median year house/condo built: 1976Median year apartment built: 1973Household type by relationship:
Households: 41,077
Male householders: 7,889 (2,704 living alone ), Female householders: 9,228 (3,626 living alone )7,053 spouses (6,963 opposite-sex spouses ), 1,064 unmarried partners , (861 opposite-sex unmarried partners ), 10,474 children (10,038 natural , 167 adopted , 268 stepchildren ), 1,144 grandchildren , 488 brothers or sisters , 386 parents , 50 foster children , 1,340 other relatives , 1,307 non-relatives In group quarters: 648
Size of family households: 4,966 2-persons , 1,478 3-persons , 2,032 4-persons , 663 5-persons , 219 6-persons , 196 7-or-more-persons .
Size of nonfamily households: 6,633 1-person , 1,044 2-persons , 202 3-persons , 14 4-persons .
4,983 married couples with children. single-parent households (757 men , 2,125 women ).
83.0% of residents of Annapolis speak English at home. of residents speak Spanish at home (56% speak English very well , 20% speak English well , 17% speak English not well , 7% don't speak English at all ).of residents speak other Indo-European language at home (75% speak English very well , 16% speak English well , 10% speak English not well ).of residents speak Asian or Pacific Island language at home (75% speak English very well , 21% speak English well , 5% speak English not well ).of residents speak other language at home (89% speak English very well , 11% speak English well ).
Foreign born population: 4,413 (10.7%)of them are naturalized citizens )
Median number of rooms in houses and condos:
Median number of rooms in apartments
Owner-occupied Renter-occupied
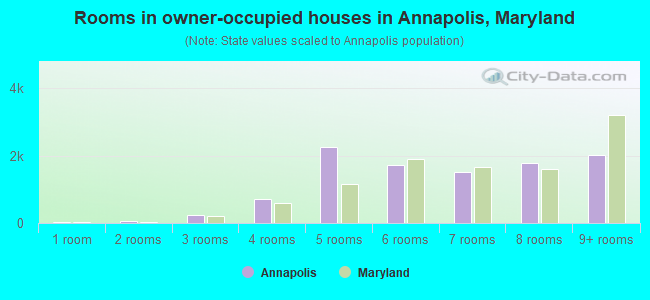
Rooms in owner-occupied houses in Annapolis, Maryland
33 1 room 69 2 rooms 234 3 rooms 715 4 rooms 2,252 5 rooms 1,726 6 rooms 1,520 7 rooms 1,773 8 rooms 2,029 9+ rooms
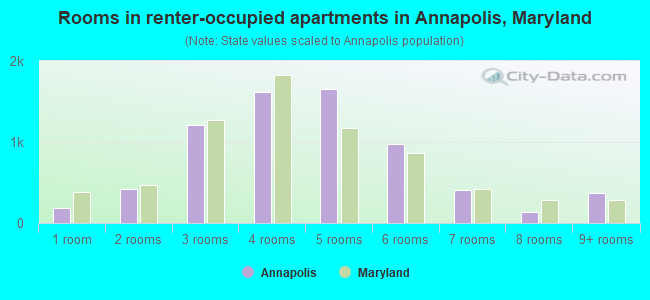
Rooms in renter-occupied apartments in Annapolis, Maryland
185 1 room 414 2 rooms 1,206 3 rooms 1,614 4 rooms 1,657 5 rooms 980 6 rooms 407 7 rooms 141 8 rooms 365 9+ rooms
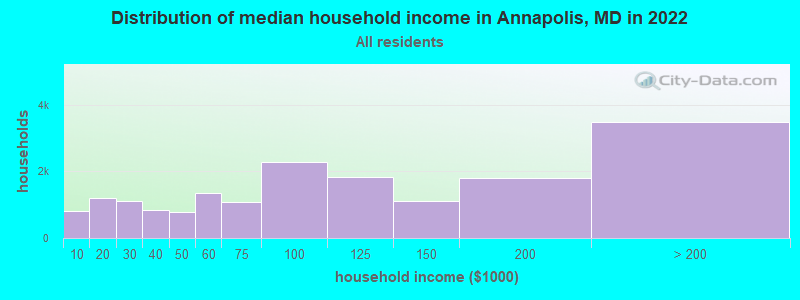
Annapolis, MD household income distribution 813 Less than $10,0001,195 $10,000 to $19,9991,114 $20,000 to $29,999847 $30,000 to $39,999777 $40,000 to $49,9991,358 $50,000 to $59,9991,087 $60,000 to $74,9992,274 $75,000 to $99,9991,843 $100,000 to $124,9991,100 $125,000 to $149,9991,785 $150,000 to $199,9993,479 $200,000 or more
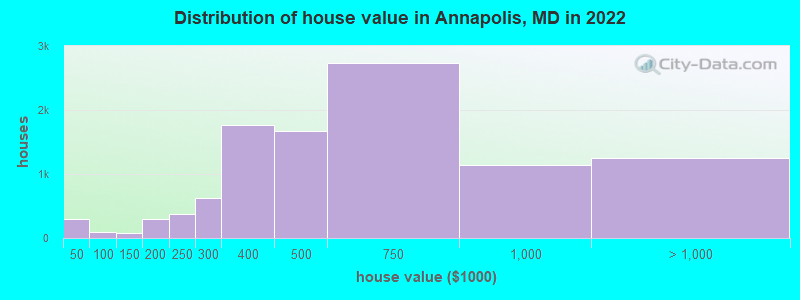
Home value of owner - occupied houses in 2022 in Annapolis, MD 141 Less than $10,00027 $10,000 to $14,99921 $20,000 to $24,99964 $25,000 to $29,9995 $35,000 to $39,99934 $40,000 to $49,99930 $70,000 to $79,99932 $80,000 to $89,99949 $100,000 to $124,99932 $125,000 to $149,999150 $150,000 to $174,999149 $175,000 to $199,999377 $200,000 to $249,999620 $250,000 to $299,9991,772 $300,000 to $399,9991,670 $400,000 to $499,9992,740 $500,000 to $749,9991,146 $750,000 to $999,999640 $1,000,000 to $1,499,999377 $1,500,000 to $1,999,999225 $2,000,000 or moreRent paid by renters in 2022 in Annapolis, MD 51 Less than $10070 $100 to $149220 $150 to $199227 $200 to $24985 $250 to $29949 $300 to $349181 $350 to $3999 $400 to $44973 $500 to $54911 $550 to $599128 $600 to $6494 $650 to $69942 $700 to $74982 $750 to $79960 $800 to $899197 $900 to $999944 $1,000 to $1,249675 $1,250 to $1,4991,984 $1,500 to $1,9991,018 $2,000 to $2,499344 $2,500 to $2,999194 $3,000 to $3,49962 $3,500 or more95 No cash rent
Percentage of workers working in this county: 76.3%Number of people working at home: 4,243 (19.8% of all workers )
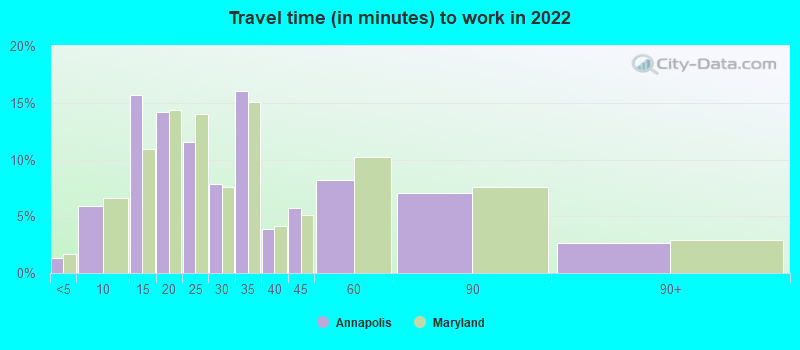
Travel time to work (commute)
Less than 5 minutes: 5115 to 9 minutes: 1,44710 to 14 minutes: 4,18215 to 19 minutes: 2,09920 to 24 minutes: 1,08225 to 29 minutes: 62930 to 34 minutes: 1,84835 to 39 minutes: 56440 to 44 minutes: 66945 to 59 minutes: 1,71360 to 89 minutes: 1,51190 or more minutes: 732
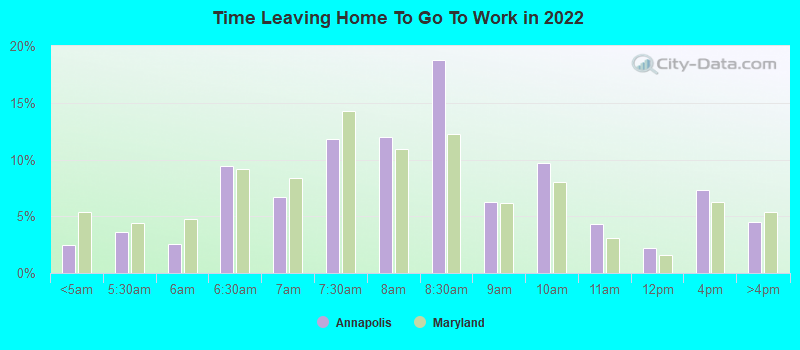
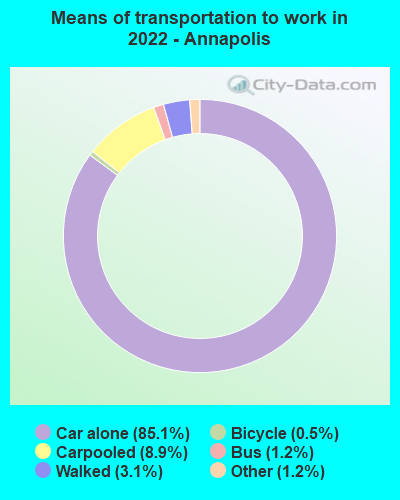
Means of transportation to work:
Drove a car alone: 21,795 (72.2%)Carpooled: 2,281 (7.6%)Bus : 168 (0.6%)Subway or elevated rail : 15 (0.0%)Taxi: 381 (1.3%)Bicycle: 146 (0.5%)Walked: 803 (2.7%)Worked at home: 4,243 (14.0%)
Unemployment by race in 2022
Unemployment rate for White non-Hispanic residents 4.2% Males1.7% FemalesUnemployment rate for Black residents 8.1% Males4.2% FemalesUnemployment rate for other race residents 0.7% Males13.4% FemalesUnemployment rate for two or more race residents 4.3% FemalesUnemployment rate for Hispanic or Latino residents 0.3% Males4.1% Females
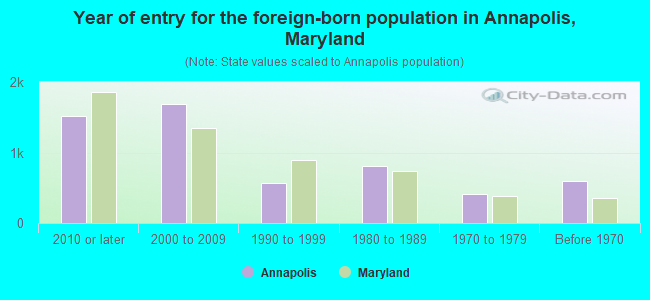
Year of entry for the foreign-born population in Annapolis, Maryland
1,512 2010 or later 1,686 2000 to 2009 570 1990 to 1999 802 1980 to 1989 406 1970 to 1979 598 Before 1970
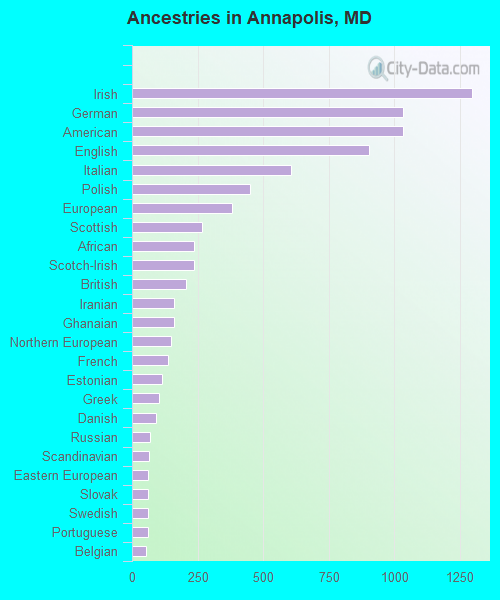
First ancestries reported:
Irish: 1,297 (7.4%)
German: 1,034 (5.9%)
American: 1,033 (5.9%)
English: 903 (5.1%)
Italian: 607 (3.5%)
Polish: 450 (2.6%)
European: 382 (2.2%)
Scottish: 268 (1.5%)
African: 236 (1.3%)
Scotch-Irish: 235 (1.3%)
British: 206 (1.2%)
Iranian: 161 (0.9%)
Ghanaian: 161 (0.9%)
Northern European: 148 (0.8%)
French: 138 (0.8%)
Estonian: 115 (0.7%)
Greek: 103 (0.6%)
Danish: 93 (0.5%)
Russian: 68 (0.4%)
Scandinavian: 63 (0.4%)
Eastern European: 62 (0.4%)
Slovak: 61 (0.3%)
Swedish: 61 (0.3%)
Portuguese: 60 (0.3%)
Belgian: 55 (0.3%)
Hungarian: 53 (0.3%)
Norwegian: 50 (0.3%)
Albanian: 45 (0.3%)
Welsh: 45 (0.3%)
French Canadian: 43 (0.2%)
West Indian: 31 (0.2%)
Armenian: 31 (0.2%)
Dutch: 30 (0.2%)
Austrian: 26 (0.1%)
British West Indian: 24 (0.1%)
Croatian: 19 (0.1%)
Alsatian: 18 (0.1%)
Lithuanian: 18 (0.1%)
South African: 17 (0.10%)
Sudanese: 17 (0.10%)
Canadian: 16 (0.09%)
Brazilian: 13 (0.07%)
Czech: 10 (0.06%)
Afghan: 9 (0.05%)
Ethiopian: 9 (0.05%)
Syrian: 9 (0.05%)
Serbian: 8 (0.05%)
Jamaican: 8 (0.05%)
Most common places of birth for foreign-born residents (%): El Salvador Annapolis:
26.7% (1,220)Maryland:
12.0% (115,412)
Mexico Annapolis:
19.2% (876)Maryland:
3.5% (34,065)
Philippines Annapolis:
8.1% (368)Maryland:
3.8% (36,698)
Ecuador Annapolis:
4.6% (211)Maryland:
0.6% (6,211)
United Kingdom, excluding England and Scotland Annapolis:
4.3% (194)Maryland:
0.7% (6,724)
Cuba Annapolis:
3.7% (171)Maryland:
0.3% (3,238)
Nepal Annapolis:
3.4% (156)Maryland:
1.1% (10,205)
Iran Annapolis:
3.3% (150)Maryland:
1.3% (12,074)
Thailand Annapolis:
2.8% (127)Maryland:
0.4% (3,874)
Ghana Annapolis:
2.6% (117)Maryland:
1.8% (17,774)
Korea Annapolis:
2.0% (90)Maryland:
3.4% (32,635)
Dominican Republic Annapolis:
1.9% (85)Maryland:
1.4% (13,947)
Place of birth for U.S.-born residents:
This state: 19,985Other state: 15,493Northeast: 4,873Midwest: 2,491South: 6,629West: 1,423 85.7% of Annapolis residents lived in the same house 1 years ago.
Out of people who lived in different houses, 36.6% lived in this county.
Out of people who lived in different counties, 41.9% lived in Maryland.
Annapolis:
85.7%State average:
88.5%
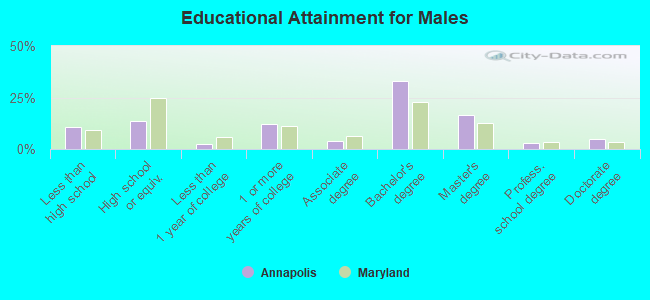
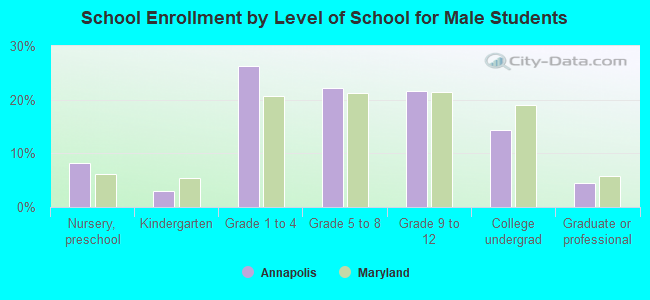
Education attainment for males 25 years and older:
No schooling: 564Nursery to 4th grade: 195th and 6th grade: 127th and 8th grade: 2829th grade: 3110th grade: 9011th grade: 19712th grade, no diploma: 236High school graduate (or equivalency): 1,839Less than 1 year of college: 338Some college more than 1 year, no degree: 1,638Associate degree: 520Bachelor's degree: 4,478Master's degree: 2,204Professional school degree: 409Doctorate degree: 655
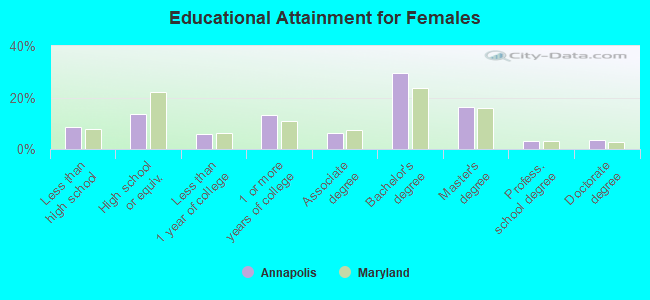
Education attainment for females 25 years and older:
No schooling: 244Nursery to 4th grade: 455th and 6th grade: 687th and 8th grade: 799th grade: 16410th grade: 24511th grade: 27712th grade, no diploma: 149High school graduate (or equivalency): 2,038Less than 1 year of college: 905Some college more than 1 year, no degree: 2,015Associate degree: 947Bachelor's degree: 4,475Master's degree: 2,496Professional school degree: 497Doctorate degree: 539
Housing units in structures:
One, detached: 7,156One, attached: 4,750Two: 3593 or 4: 5615 to 9: 1,57710 to 19: 2,07120 to 49: 64350 or more: 1,531Boats, RVs, vans, etc.: 11Housing units lacking complete plumbing facilities in 2022: 0.1%Housing units lacking complete kitchen facilities in 2022: 0.3%House/condo owner moved in on average 10 years ago
Renter moved in on average 5 years ago
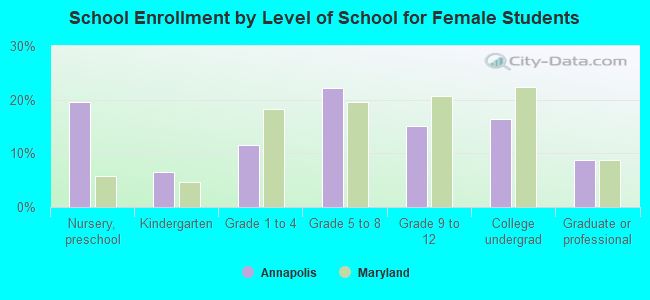
Private vs. public school enrollment:
Students in private schools in grades 1 to 8 (elementary and middle school): 1,080 Students in private schools in grades 9 to 12 (high school): 261 Students in private undergraduate colleges: 359