Andover, FL (Florida) Houses and Residents
| Andover: | $321,555 |
| Florida: | $354,100 |
Total population: 9,221 (Urban population: 8,658, Rural population: 0)
Houses: 3,979 (3,539 occupied: 1,698 owner occupied, 1,841 renter occupied)
| % of renters here: | 52% |
| State: | 33% |
Housing density: 2,374 houses/condos per square mile
Median price asked for vacant for-sale houses and condos in 2022 in this county: $886,894.
Median contract rent in 2022: $1,444 (lower quartile is $993, upper quartile is $1,821)
Median rent asked for vacant for-rent units in 2022: $1,681
Median gross rent in Andover, FL in 2022: $1,587
Housing units in Andover with a mortgage: 781 (75 second mortgage, 40 home equity loan, 16 both second mortgage and home equity loan)
Houses without a mortgage: 107
Compare current foreclosures near Andover, FL:
| Photo | Address | Area | Beds / Baths | Price | Details |
|---|---|---|---|---|---|

|
#1
NE 35th St
Fort Lauderdale, FL 33306
|
4,419 sq. feet
|
4 baths 6 beds |
$1,821,600
|
show details |

|
#2
Radice Crt Apt 805
Fort Lauderdale, FL 33319
|
1,149 sq. feet
|
2 baths 1 beds |
$155,000
|
show details |

|
#3
Washington St Apt 110e
Hollywood, FL 33021
|
968 sq. feet
|
2 baths 2 beds |
$170,000
|
show details |

|
#4
Sunrise Lakes Dr N Apt 312
Fort Lauderdale, FL 33322
|
850 sq. feet
|
2 baths 2 beds |
$155,000
|
show details |

|
#5
SW 97th Ave
Hollywood, FL 33025
|
3,191 sq. feet
|
2 baths 5 beds |
$574,900
|
show details |

|
#6
174th St Apt 1818
North Miami Beach, FL 33160
|
1,275 sq. feet
|
2 baths 2 beds |
$425,000
|
show details |

|
#7
Parkview Dr Apt 804
Hallandale, FL 33009
|
1,075 sq. feet
|
1 baths 1 beds |
$259,900
|
show details |

|
#8
NW 104th Ave Apt 405
Fort Lauderdale, FL 33322
|
965 sq. feet
|
2 baths 2 beds |
$112,000
|
show details |

|
#9
NE 11th St Apt 310
Fort Lauderdale, FL 33304
|
976 sq. feet
|
1 baths 1 beds |
$206,550
|
show details |

|
#10
SW 27th St
Hollywood, FL 33029
|
3,611 sq. feet
|
2 baths 4 beds |
$665,600
|
show details |
| Photo | Address | Area | Beds / Baths | Price | Details |
|---|---|---|---|---|---|

|
#11
SW 38th Ct
Miami, FL 33134
|
2,823 sq. feet
|
4 baths 6 beds |
$1,100,000
|
show details |

|
#12
E 35th St
Hialeah, FL 33013
|
1,690 sq. feet
|
1 baths 2 beds |
$436,000
|
show details |

|
#13
NE 1st Ave Unit #2200
Miami, FL 33132
|
- sq. feet
|
2 baths 1 beds |
$715,000
|
show details |

|
#14
Ft Lauderdale Beach
Fort Lauderdale, FL 33304
|
1,308 sq. feet
|
1 baths 1 beds |
$339,900
|
show details |

|
#15
NW 19th Ave
Fort Lauderdale, FL 33311
|
- sq. feet
|
2 baths 3 beds |
$338,000
|
show details |

|
#16
Sunrise Lakes Blvd Apt 408
Fort Lauderdale, FL 33322
|
810 sq. feet
|
2 baths 2 beds |
show details | |

|
#17
SW 52nd Avenue 1-1
Hollywood, FL 33023
|
1,326 sq. feet
|
2 baths 3 beds |
show details | |

|
#18
SE 5th St Apt 703
Miami, FL 33131
|
952 sq. feet
|
2 baths 1 beds |
show details | |

|
#19
NE 8th Ave Unit 905
Miami, FL 33138
|
1,282 sq. feet
|
2 baths 2 beds |
show details | |

|
#20
NW 102nd Ave Apt 101
Miami, FL 33178
|
926 sq. feet
|
2 baths 2 beds |
show details |
| Photo | Address | Area | Beds / Baths | Price | Details |
|---|---|---|---|---|---|

|
#21
NE 4th Ave
Miami, FL 33138
|
952 sq. feet
|
3 baths 3 beds |
show details | |

|
#22
NW 37th St
Fort Lauderdale, FL 33319
|
1,749 sq. feet
|
2 baths 4 beds |
show details | |

|
#23
W 80th Pl
Hialeah, FL 33014
|
1,747 sq. feet
|
3 baths 3 beds |
show details | |

|
#24
NW 77th Ct
Hialeah, FL 33015
|
1,980 sq. feet
|
2 baths 4 beds |
show details | |

|
#25
NW 31st Ct
Fort Lauderdale, FL 33351
|
1,478 sq. feet
|
2 baths 2 beds |
show details | |

|
#26
SW 25th Rd
Miami, FL 33129
|
2,410 sq. feet
|
2 baths 2 beds |
show details | |

|
#27
NW 89th St
Miami, FL 33147
|
1,327 sq. feet
|
1 baths 2 beds |
show details | |

|
#28
SW 38th St
Fort Lauderdale, FL 33314
|
963 sq. feet
|
1 baths 2 beds |
show details | |

|
#29
Little River Dr
Miami, FL 33150
|
2,075 sq. feet
|
1 baths 3 beds |
show details | |

|
#30
N Point Dr
Hollywood, FL 33026
|
1,587 sq. feet
|
2 baths 3 beds |
show details |
| Photo | Address | Area | Beds / Baths | Price | Details |
|---|---|---|---|---|---|

|
#31
E 58th St
Hialeah, FL 33013
|
2,078 sq. feet
|
3 baths 4 beds |
show details | |

|
#32
NW 12th Ave
Miami, FL 33169
|
1,673 sq. feet
|
2 baths 4 beds |
show details | |

|
#33
Sunrise Lakes Blvd Apt 311
Fort Lauderdale, FL 33322
|
850 sq. feet
|
1 baths 2 beds |
show details | |

|
#34
NW 95th Ter
Miami, FL 33147
|
1,224 sq. feet
|
2 baths 3 beds |
show details | |

|
#35
NE 14th Ter
Fort Lauderdale, FL 33334
|
1,959 sq. feet
|
3 baths 3 beds |
show details | |

|
#36
Tryall Dr
Hialeah, FL 33015
|
4,077 sq. feet
|
5 baths 6 beds |
show details | |

|
#37
NE 88th St
Miami, FL 33138
|
1,110 sq. feet
|
1 baths 2 beds |
show details | |

|
#38
Brickell Bay Dr Apt 2001
Miami, FL 33131
|
1,878 sq. feet
|
3 baths 2 beds |
show details | |

|
#39
Sunrise Lakes Blvd Apt 206
Fort Lauderdale, FL 33322
|
640 sq. feet
|
1 baths 1 beds |
show details | |

|
#40
NE 89th St
Miami, FL 33138
|
1,290 sq. feet
|
1 baths 2 beds |
show details |
| Photo | Address | Area | Beds / Baths | Price | Details |
|---|---|---|---|---|---|

|
#41
NW 14th Ave
Miami, FL 33167
|
3,144 sq. feet
|
3 baths 3 beds |
show details | |

|
#42
NW 89th St
Miami, FL 33150
|
1,080 sq. feet
|
1 baths 3 beds |
show details | |

|
#43
NW 10th St
Dania, FL 33004
|
2,447 sq. feet
|
2 baths 3 beds |
show details | |

|
#44
SW 90th Ave
Fort Lauderdale, FL 33328
|
1,393 sq. feet
|
2 baths 3 beds |
show details | |

|
#45
NW 59th Ave
Miami, FL 33126
|
1,960 sq. feet
|
1 baths 2 beds |
show details | |

|
#46
SW 39th St Apt F206
Fort Lauderdale, FL 33314
|
1,364 sq. feet
|
2 baths 3 beds |
show details | |

|
#47
E 56th St
Hialeah, FL 33013
|
1,193 sq. feet
|
2 baths 2 beds |
show details | |

|
#48
Inverrary Blvd W
Fort Lauderdale, FL 33319
|
1,656 sq. feet
|
2 baths 2 beds |
show details | |

|
#49
SW 135th Ave
Hollywood, FL 33027
|
1,953 sq. feet
|
2 baths 3 beds |
show details | |

|
Check over 1 million property listings on Foreclosure.com!
|
browse all offers | |||
Latest news about housing in Andover, FL collected exclusively by city-data.com from local newspapers, TV, and radio stations

 | Apartments/Homes for rent near UCF (10 replies) |
| Anything to say about these condos in Delray Beach?????? (10 replies) |
| Which are good and safe apartments in Winter Park? (0 replies) |
| Recommendations on Apartments? (16 replies) |
| Florida is turning into an environmental catastrophe (963 replies) |
| Apartments in New Tampa (3 replies) |

Household type by relationship:
Households: 2,456,378- In family households: 2,110,320 (364,641 male householders, 238,270 female householders)
380,241 spouses, 721,944 children (670,830 natural, 12,263 adopted, 38,851 stepchildren), 77,135 grandchildren, 45,441 brothers or sisters, 59,104 parents, foster children, 82,017 other relatives, 102,016 non-relatives
- In nonfamily households: 346,058 (129,381 male householders (94,284 living alone)), 135,060 female householders (109,939 living alone)), 81,617 nonrelatives
- In group quarters: 40,057 (20,640 institutionalized population)
319,467 married couples with children.
152,668 single-parent households (27,448 men, 125,220 women).
71.1% of residents of Andover speak English at home.
17.0% of residents speak Spanish at home (51% speak English very well, 22% speak English well, 19% speak English not well, 7% don't speak English at all).
8.9% of residents speak other Indo-European language at home (65% speak English very well, 19% speak English well, 13% speak English not well, 3% don't speak English at all).
1.8% of residents speak Asian or Pacific Island language at home (39% speak English very well, 58% speak English well, 3% speak English not well).
1.1% of residents speak other language at home (80% speak English very well, 20% speak English well).
Foreign born population: 3,922 (38.2%)
(66.5% of them are naturalized citizens)
| Here: | 4.4 |
| State: | 5.9 |
| Here: | 5.7 |
| State: | 4.2 |

- Bedrooms in owner-occupied houses and condos in Andover, Florida
- 86no bedroom
- 3161 bedroom
- 5622 bedrooms
- 5453 bedrooms
- 1524 bedrooms
- 375+ bedrooms

- Bedrooms in renter-occupied apartments in Andover, Florida
- 163no bedroom
- 8251 bedroom
- 6272 bedrooms
- 2173 bedrooms
- 94 bedrooms
- 05+ bedrooms

- Cars and other vehicles available in Andover in owner-occupied houses/condos
- 237no vehicle
- 6381 vehicle
- 5832 vehicles
- 1683 vehicles
- 654 vehicles
- 75+ vehicles

- Cars and other vehicles available in Andover in renter-occupied apartments
- 527no vehicle
- 9241 vehicle
- 3312 vehicles
- 393 vehicles
- 94 vehicles
- 115+ vehicles

- Rooms in owner-occupied houses in Andover, Florida
- 861 room
- 1412 rooms
- 3383 rooms
- 2244 rooms
- 3065 rooms
- 2026 rooms
- 2607 rooms
- 608 rooms
- 819+ rooms

- Rooms in renter-occupied apartments in Andover, Florida
- 1631 room
- 3172 rooms
- 4963 rooms
- 5594 rooms
- 1925 rooms
- 626 rooms
- 387 rooms
- 148 rooms
- 09+ rooms


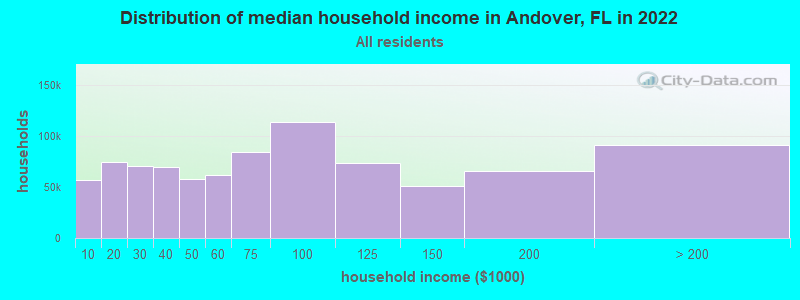
Andover, FL household income distribution

- 56,624Less than $10,000
- 73,981$10,000 to $19,999
- 70,817$20,000 to $29,999
- 69,533$30,000 to $39,999
- 57,350$40,000 to $49,999
- 61,808$50,000 to $59,999
- 84,180$60,000 to $74,999
- 113,473$75,000 to $99,999
- 73,452$100,000 to $124,999
- 51,021$125,000 to $149,999
- 65,793$150,000 to $199,999
- 90,983$200,000 or more
Percentage of workers working in this county: 71.3%
Number of people working at home: 853 (15.1% of all workers)
Travel time to work (commute)
- Less than 5 minutes: 33
- 5 to 9 minutes: 142
- 10 to 14 minutes: 190
- 15 to 19 minutes: 411
- 20 to 24 minutes: 730
- 25 to 29 minutes: 383
- 30 to 34 minutes: 878
- 35 to 39 minutes: 107
- 40 to 44 minutes: 156
- 45 to 59 minutes: 381
- 60 to 89 minutes: 291
- 90 or more minutes: 74
Means of transportation to work:
- Drove a car alone: 2,826 (74.6%)
- Carpooled: 624 (16.5%)
- Bus or trolley bus: 235 (6.2%)
- Taxi: 14 (0.4%)
- Walked: 34 (0.9%)
- Other means: 43 (1.1%)
- Worked at home: 12 (0.3%)


- Year of entry for the foreign-born population in Andover, Florida
- 4351995 to March 2000
- 6581990 to 1994
- 4671985 to 1989
- 4351980 to 1984
- 2141975 to 1979
- 3061970 to 1974
- 3121965 to 1969
- 274Before 1965
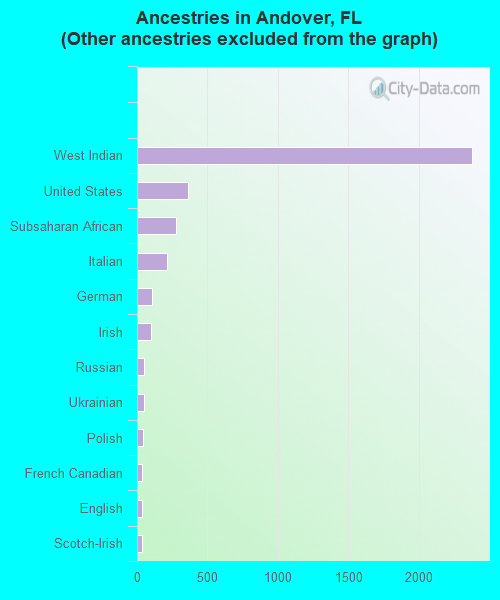
First ancestries reported:
- Other: 4,064 (51.7%)
- West Indian: 2,379 (30.3%)
- United States: 365 (4.6%)
- Subsaharan African: 280 (3.6%)
- Italian: 213 (2.7%)
- German: 108 (1.4%)
- Irish: 98 (1.2%)
- Russian: 53 (0.7%)
- Ukrainian: 49 (0.6%)
- Polish: 46 (0.6%)
- French Canadian: 35 (0.4%)
- English: 32 (0.4%)
- Scotch-Irish: 32 (0.4%)
- Swedish: 21 (0.3%)
- French: 19 (0.2%)
- Scottish: 19 (0.2%)
- Lithuanian: 18 (0.2%)
- Greek: 9 (0.1%)
- Norwegian: 9 (0.1%)
- Welsh: 9 (0.1%)
- Czech: 5 (0.06%)
Most common places of birth for foreign-born residents (%):
| Andover: | 41.8% (1,297) |
| Florida: | 5.3% (141,182) |
| Andover: | 10.4% (321) |
| Florida: | 6.8% (182,224) |
| Andover: | 8.4% (261) |
| Florida: | 24.1% (642,951) |
| Andover: | 5.2% (161) |
| Florida: | 1.4% (38,484) |
| Andover: | 3.2% (100) |
| Florida: | 5.9% (157,371) |
| Andover: | 2.4% (75) |
| Florida: | 2.5% (66,690) |
| Andover: | 2.2% (69) |
| Florida: | 1.1% (28,788) |
| Andover: | 2.2% (69) |
| Florida: | 2.0% (53,939) |
| Andover: | 1.7% (54) |
| Florida: | 1.1% (28,790) |
Place of birth for U.S.-born residents:
- This state: 3,038
- Other state: 2,120
- Northeast: 1,065
- Midwest: 265
- South: 778
- West: 12
42% of Andover residents lived in the same house 5 years ago.
Out of people who lived in different houses, 69% lived in this county.
Out of people who lived in different counties, 51% lived in Florida.
Education attainment for males 25 years and older:
- No schooling: 23
- Nursery to 4th grade: 16
- 5th and 6th grade: 91
- 7th and 8th grade: 33
- 9th grade: 77
- 10th grade: 108
- 11th grade: 61
- 12th grade, no diploma: 238
- High school graduate (or equivalency): 637
- Less than 1 year of college: 113
- Some college more than 1 year, no degree: 355
- Associate degree: 170
- Bachelor's degree: 225
- Master's degree: 83
- Professional school degree: 0
- Doctorate degree: 21

Education attainment for females 25 years and older:
- No schooling: 19
- Nursery to 4th grade: 0
- 5th and 6th grade: 36
- 7th and 8th grade: 130
- 9th grade: 123
- 10th grade: 82
- 11th grade: 55
- 12th grade, no diploma: 304
- High school graduate (or equivalency): 1,081
- Less than 1 year of college: 275
- Some college more than 1 year, no degree: 457
- Associate degree: 274
- Bachelor's degree: 397
- Master's degree: 134
- Professional school degree: 39
- Doctorate degree: 0


Housing units in structures:
- One, detached: 861
- One, attached: 150
- Two: 94
- 3 or 4: 131
- 5 to 9: 335
- 10 to 19: 654
- 20 to 49: 849
- 50 or more: 905

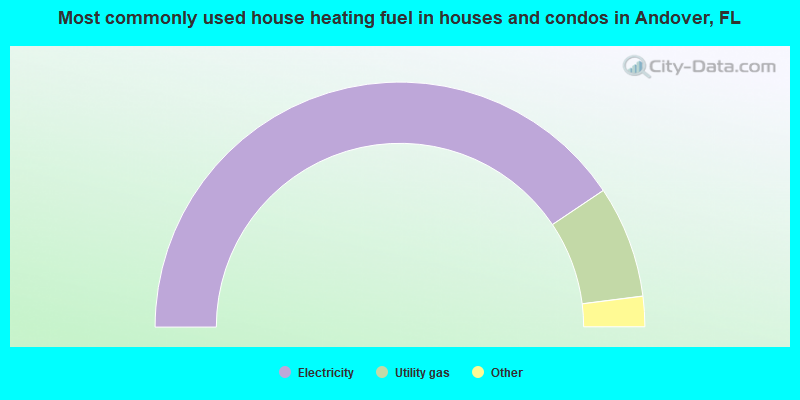
- 81.2%Electricity
- 14.8%Utility gas
- 2.1%Bottled, tank, or LP gas
- 1.3%No fuel used
- 0.6%Fuel oil, kerosene, etc.
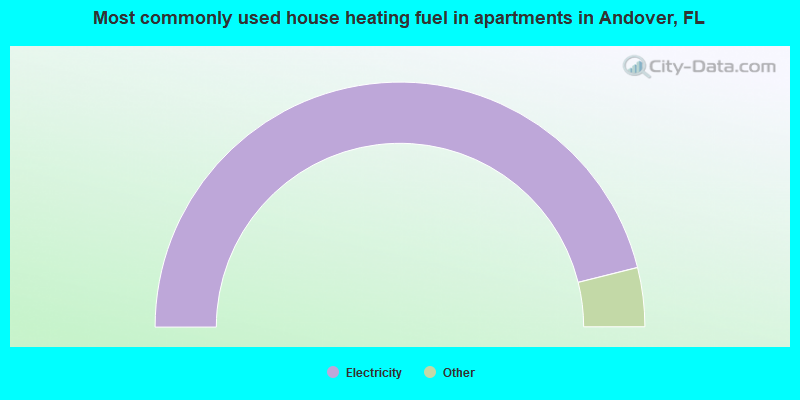
- 92.2%Electricity
- 3.9%No fuel used
- 3.9%Utility gas
Private vs. public school enrollment:
| Here: | 6.6% |
| Florida: | 11.7% |
| Here: | 4.4% |
| Florida: | 9.7% |
| Here: | 28.9% |
| Florida: | 21.0% |


