Anacortes, WA (Washington) Houses and Residents
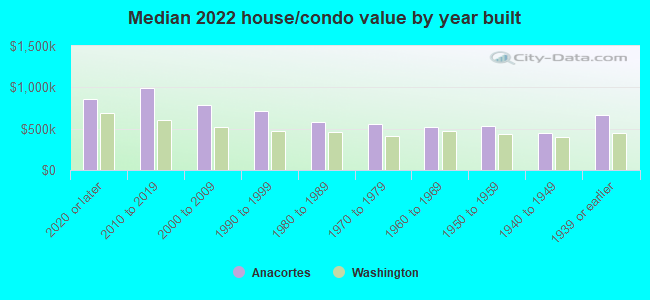
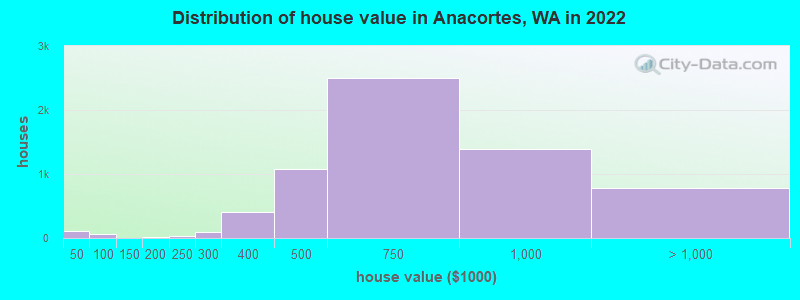
Estimated median house or condo value in 2022: $692,540 (it was $169,000 in 2000 )
Anacortes:
$692,540Washington:
$569,500
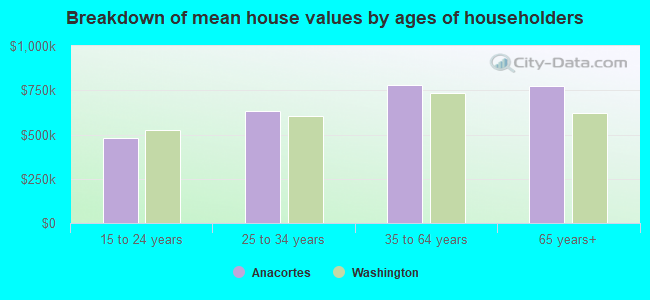
Lower value quartile - upper value quartile: $520,972 - $874,603Mean price in 2022: Detached houses: $737,196 Here:
$737,196State:
$734,307
Townhouses or other attached units: $552,059 Here:
$552,059State:
$657,697
In 2-unit structures: $744,728 Here:
$744,728State:
$534,634
In 3-to-4-unit structures: $399,888 Here:
$399,888State:
$510,239
In 5-or-more-unit structures: $741,952 Here:
$741,952State:
$503,183
Mobile homes: $346,400 Here:
$346,400State:
$218,362
Total population: 16,232 (Urban population: 14,086 (all inside urban clusters), Rural population: 621 (23 farm, 598 nonfarm ))
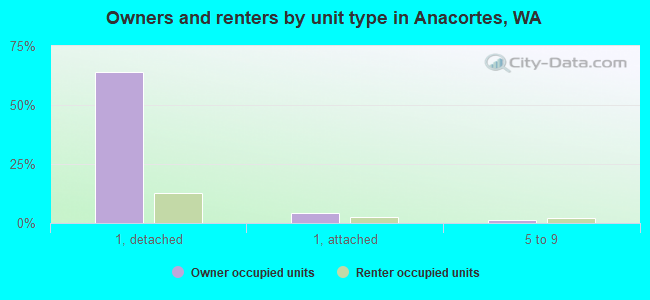
Houses: 8,713 (7,974 occupied: 5,344 owner occupied, 2,453 renter occupied )
% of renters here:
31%State:
36%
Housing density: 740 houses/condos per square mile
Median price asked for vacant for-sale houses and condos in 2022: $693,602.
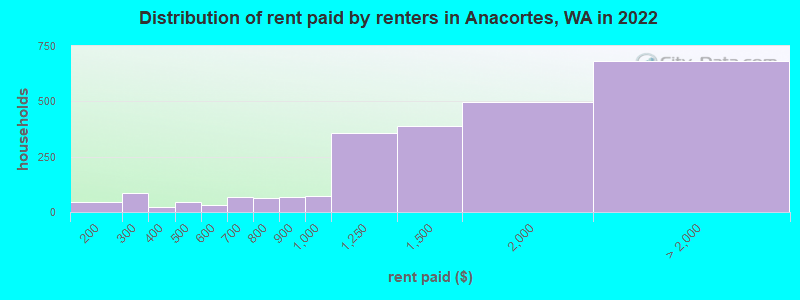
Median contract rent in 2022: $1,476 (lower quartile is $1,071, upper quartile is over $2,000)
Median rent asked for vacant for-rent units in 2022: $1,334
Median gross rent in Anacortes, WA in 2022: $1,675
Housing units in Anacortes with a mortgage: 3,194 (342 second mortgage, 16 home equity loan, 300 both second mortgage and home equity loan )Houses without a mortgage: 64
Median household income for houses/condos with a mortgage: $120,619
Median household income for apartments without a mortgage: $79,593
Median monthly housing costs: $1,561
Data:
Median house or condo value ($)
Median house or condo value ($ change since 2000)
Median house or condo value ($) - White
Median house or condo value ($) - Black or African American
Median house or condo value ($) - Asian
Median house or condo value ($) - Hispanic or Latino
Median house or condo value ($) - American Indian and Alaska Native
Median house or condo value ($) - Multirace
Median house or condo value ($) - Other Race
Median price asked for mobile homes ($)
Household density (households per square mile)
Mean house or condo value by units in structure - 1, detached ($)
Mean house or condo value by units in structure - 1, attached ($)
Mean house or condo value by units in structure - 2 ($)
Mean house or condo value by units in structure by units in structure - 3 or 4 ($)
Mean house or condo value by units in structure - 5 or more ($)
Mean house or condo value by units in structure - Boat, RV, van, etc. ($)
Mean house or condo value by units in structure - Mobile home ($)
Median contract rent ($)
Median contract rent - Lower quartile ($)
Median contract rent - Upper quartile ($)
Median gross rent ($)
Urban houses (%)
Rural houses (%)
Houses occupied (%)
Houses occupied (% change since 2000)
Houses owner occupied (%)
Houses owner occupied (% change since 2000)
Houses renter occupied (%)
Houses renter occupied (% change since 2000)
Vacant housing units - For rent (%)
Vacant housing units - For rent (% change since 2000)
Vacant housing units - For sale only (%)
Vacant housing units - For sale only (% change since 2000)
Vacant housing units - Rented or sold, not occupied (%)
Vacant housing units - Rented or sold, not occupied (% change since 2000)
Vacant housing units - For seasonal, recreational, or occasional use (%)
Vacant housing units - For seasonal, recreational, or occasional use (% change since 2000)
Vacant housing units - For migrant workers (%)
Vacant housing units - For migrant workers (% change since 2000)
Vacant housing units - Other vacant (%)
Vacant housing units - Other vacant (% change since 2000)
Median monthly housing costs ($)
Median household income for houses/condos with a mortgage ($)
Median household income for houses/condos without a mortgage ($)
Median household income ($)
Median household income ($) - White
Median household income ($) - Black or African American
Median household income ($) - Asian
Median household income ($) - Hispanic or Latino
Median household income ($) - American Indian and Alaska Native
Median household income ($) - Multirace
Median household income ($) - Other Race
Mortgage status - with mortgage (%)
Mortgage status - with second mortgage (%)
Mortgage status - with home equity loan (%)
Mortgage status - with both second mortgage and home equity loan (%)
Mortgage status - without a mortgage (%)
Median year house/condo built
Median year apartment built
Household type by relationship - Male householder living alone (%)
Household type by relationship - Male householder not living alone (%)
Household type by relationship - Female householder living alone (%)
Household type by relationship - Female householder not living alone (%)
Household type by relationship - Opposite-Sex spouse (%)
Household type by relationship - Same-Sex spouse (%)
Household type by relationship - Opposite-Sex unmarried partner (%)
Household type by relationship - Same-Sex unmarried partner (%)
Household type by relationship - In group quarters (%)
Size of family households - 2-person household (%)
Size of family households - 3-person household (%)
Size of family households - 4-person household (%)
Size of family households - 5-person household (%)
Size of family households - 6-person household (%)
Size of family households - 7-or-more-person household (%)
Size of nonfamily households - 1-person household (%)
Size of nonfamily households - 2-person household (%)
Size of nonfamily households - 3-person household (%)
Size of nonfamily households - 4-person household (%)
Size of nonfamily households - 5-person household (%)
Size of nonfamily households - 6-person household (%)
Size of nonfamily households - 7-or-moreperson household (%)
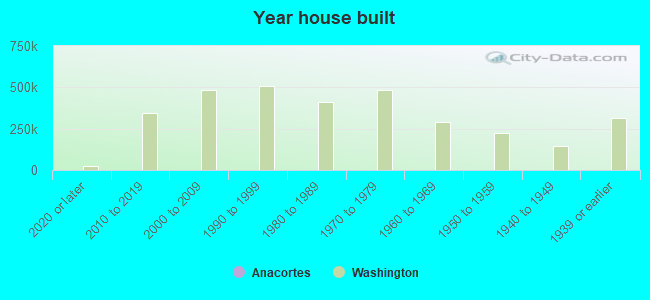
Year house built - Built 2010 or later (%)
Year house built - Built 2000 to 2009 (%)
Year house built - Built 1990 to 1999 (%)
Year house built - Built 1980 to 1989 (%)
Year house built - Built 1970 to 1979 (%)
Year house built - Built 1960 to 1969 (%)
Year house built - Built 1950 to 1959 (%)
Year house built - Built 1940 to 1949 (%)
Year house built - Built 1939 or earlier (%)
Median number of rooms in houses and condos
Median number of rooms in apartments
Median number of bedrooms in owner occupied houses
Mean number of bedrooms in owner occupied houses
Median number of bedrooms in renter occupied houses
Mean number of bedrooms in renter occupied houses
Median number of vehichles in owner occupied houses
Mean number of vehichles in owner occupied houses
Median number of vehichles in renter occupied houses
Mean number of vehichles in renter occupied houses
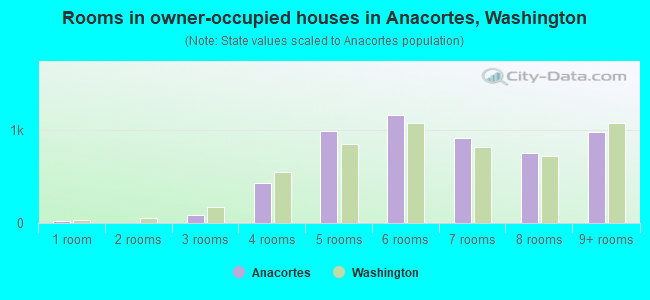
Rooms in owner-occupied houses - 1 room (%)
Rooms in owner-occupied houses - 2 rooms (%)
Rooms in owner-occupied houses - 3 rooms (%)
Rooms in owner-occupied houses - 4 rooms (%)
Rooms in owner-occupied houses - 5 rooms (%)
Rooms in owner-occupied houses - 6 rooms (%)
Rooms in owner-occupied houses - 7 rooms (%)
Rooms in owner-occupied houses - 8 rooms (%)
Rooms in owner-occupied houses - 9+ rooms (%)
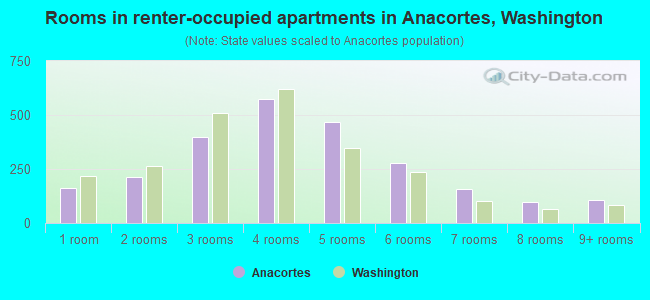
Rooms in renter-occupied houses - 1 room (%)
Rooms in renter-occupied houses - 2 rooms (%)
Rooms in renter-occupied houses - 3 rooms (%)
Rooms in renter-occupied houses - 4 rooms (%)
Rooms in renter-occupied houses - 5 rooms (%)
Rooms in renter-occupied houses - 6 rooms (%)
Rooms in renter-occupied houses - 7 rooms (%)
Rooms in renter-occupied houses - 8 rooms (%)
Rooms in renter-occupied houses - 9+ rooms (%)
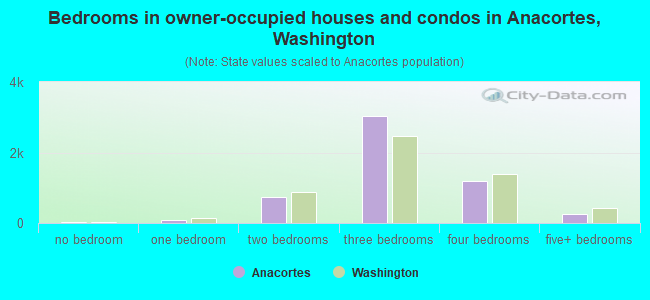
Bedrooms in owner-occupied houses - no bedrooms (%)
Bedrooms in owner-occupied houses - 1 bedroom (%)
Bedrooms in owner-occupied houses - 2 bedrooms (%)
Bedrooms in owner-occupied houses - 3 bedrooms (%)
Bedrooms in owner-occupied houses - 4 bedrooms (%)
Bedrooms in owner-occupied houses - 5+ bedrooms (%)
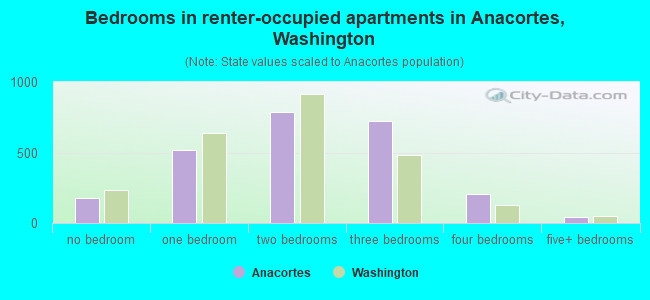
Bedrooms in renter-occupied houses - no bedrooms (%)
Bedrooms in renter-occupied houses - 1 bedroom (%)
Bedrooms in renter-occupied houses - 2 bedrooms (%)
Bedrooms in renter-occupied houses - 3 bedrooms (%)
Bedrooms in renter-occupied houses - 4 bedrooms (%)
Bedrooms in renter-occupied houses - 5+ bedrooms (%)
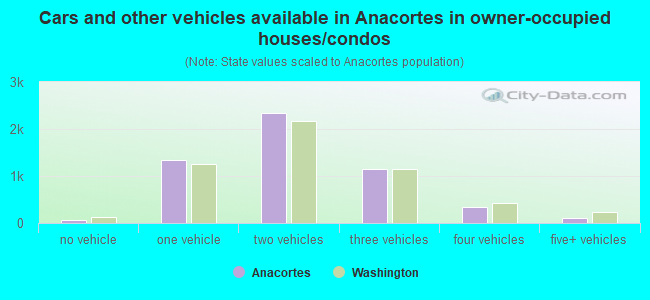
Vehicles available in owner-occupied houses - no vehicle available (%)
Vehicles available in owner-occupied houses - 1 vehicle available(%)
Vehicles available in owner-occupied houses - 2 Vehicles available (%)
Vehicles available in owner-occupied houses - 3 Vehicles available (%)
Vehicles available in owner-occupied houses - 4 Vehicles available (%)
Vehicles available in owner-occupied houses - 5+ Vehicles available (%)
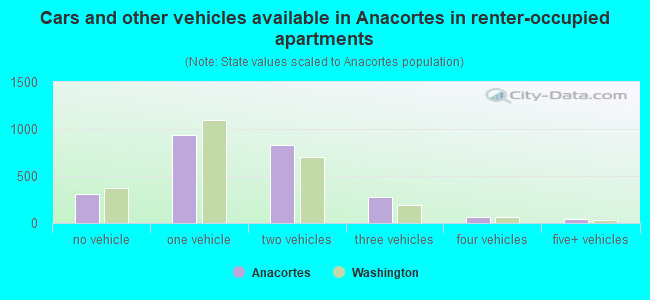
Vehicles available in renter-occupied houses - no vehicle available (%)
Vehicles available in renter-occupied houses - 1 vehicle available (%)
Vehicles available in renter-occupied houses - 2 Vehicles available (%)
Vehicles available in renter-occupied houses - 3 Vehicles available (%)
Vehicles available in renter-occupied houses - 4 Vehicles available (%)
Vehicles available in renter-occupied houses - 5+ Vehicles available (%)
Housing units in structures - 1, detached (%)
Housing units in structures - 1, attached (%)
Housing units in structures - 2 (%)
Housing units in structures - 3 or 4 (%)
Housing units in structures - 5 to 9 (%)
Housing units in structures - 10 to 19 (%)
Housing units in structures - 20 to 49 (%)
Housing units in structures - 50 or more (%)
Housing units in structures - Mobile home (%)
Housing units in structures - Boat, RV, van, etc. (%)
Housing units in structures - Owners - 1, detached (%)
Housing units in structures - Owners - 1, attached (%)
Housing units in structures - Owners - 2 (%)
Housing units in structures - Owners - 3 or 4 (%)
Housing units in structures - Owners - 5 to 9 (%)
Housing units in structures - Owners - 10 to 19 (%)
Housing units in structures - Owners - 20 to 49 (%)
Housing units in structures - Owners - 50 or more (%)
Housing units in structures - Owners - Mobile home (%)
Housing units in structures - Owners - Boat, RV, van, etc. (%)
Housing units in structures - Renters - 1, detached (%)
Housing units in structures - Renters - 1, attached (%)
Housing units in structures - Renters - 2 (%)
Housing units in structures - Renters - 3 or 4 (%)
Housing units in structures - Renters - 5 to 9 (%)
Housing units in structures - Renters - 10 to 19 (%)
Housing units in structures - Renters - 20 to 49 (%)
Housing units in structures - Renters - 50 or more (%)
Housing units in structures - Renters - Mobile home (%)
Housing units in structures - Renters - Boat, RV, van, etc. (%)
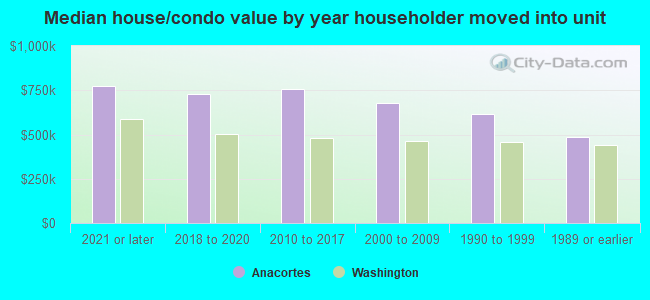
House/condo owner moved in on average (years ago)
Renter moved in on average (years ago)
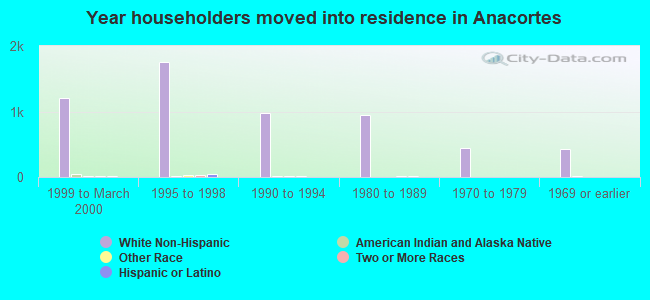
Year householder moved into unit - Moved in 1999 to March 2000 (%)
Year householder moved into unit - Moved in 1999 to March 2000 (%) - White
Year householder moved into unit - Moved in 1999 to March 2000 (%) - Black or African American
Year householder moved into unit - Moved in 1999 to March 2000 (%) - Asian
Year householder moved into unit - Moved in 1999 to March 2000 (%) - Hispanic or Latino
Year householder moved into unit - Moved in 1999 to March 2000 (%) - American Indian and Alaska Native
Year householder moved into unit - Moved in 1999 to March 2000 (%) - Multirace
Year householder moved into unit - Moved in 1999 to March 2000 (%) - Other Race
Year householder moved into unit - Moved in 1995 to 1998 (%)
Year householder moved into unit - Moved in 1995 to 1998 (%) - White
Year householder moved into unit - Moved in 1995 to 1998 (%) - Black or African American
Year householder moved into unit - Moved in 1995 to 1998 (%) - Asian
Year householder moved into unit - Moved in 1995 to 1998 (%) - Hispanic or Latino
Year householder moved into unit - Moved in 1995 to 1998 (%) - American Indian and Alaska Native
Year householder moved into unit - Moved in 1995 to 1998 (%) - Multirace
Year householder moved into unit - Moved in 1995 to 1998 (%) - Other Race
Year householder moved into unit - Moved in 1990 to 1994 (%)
Year householder moved into unit - Moved in 1990 to 1994 (%) - White
Year householder moved into unit - Moved in 1990 to 1994 (%) - Black or African American
Year householder moved into unit - Moved in 1990 to 1994 (%) - Asian
Year householder moved into unit - Moved in 1990 to 1994 (%) - Hispanic or Latino
Year householder moved into unit - Moved in 1990 to 1994 (%) - American Indian and Alaska Native
Year householder moved into unit - Moved in 1990 to 1994 (%) - Multirace
Year householder moved into unit - Moved in 1990 to 1994 (%) - Other Race
Year householder moved into unit - Moved in 1980 to 1989 (%)
Year householder moved into unit - Moved in 1980 to 1989 (%) - White
Year householder moved into unit - Moved in 1980 to 1989 (%) - Black or African American
Year householder moved into unit - Moved in 1980 to 1989 (%) - Asian
Year householder moved into unit - Moved in 1980 to 1989 (%) - Hispanic or Latino
Year householder moved into unit - Moved in 1980 to 1989 (%) - American Indian and Alaska Native
Year householder moved into unit - Moved in 1980 to 1989 (%) - Multirace
Year householder moved into unit - Moved in 1980 to 1989 (%) - Other Race
Year householder moved into unit - Moved in 1970 to 1979 (%)
Year householder moved into unit - Moved in 1970 to 1979 (%) - White
Year householder moved into unit - Moved in 1970 to 1979 (%) - Black or African American
Year householder moved into unit - Moved in 1970 to 1979 (%) - Asian
Year householder moved into unit - Moved in 1970 to 1979 (%) - Hispanic or Latino
Year householder moved into unit - Moved in 1970 to 1979 (%) - American Indian and Alaska Native
Year householder moved into unit - Moved in 1970 to 1979 (%) - Multirace
Year householder moved into unit - Moved in 1970 to 1979 (%) - Other Race
Year householder moved into unit - Moved in 1969 or earlier (%)
Year householder moved into unit - Moved in 1969 or earlier (%) - White
Year householder moved into unit - Moved in 1969 or earlier (%) - Black or African American
Year householder moved into unit - Moved in 1969 or earlier (%) - Asian
Year householder moved into unit - Moved in 1969 or earlier (%) - Hispanic or Latino
Year householder moved into unit - Moved in 1969 or earlier (%) - American Indian and Alaska Native
Year householder moved into unit - Moved in 1969 or earlier (%) - Multirace
Year householder moved into unit - Moved in 1969 or earlier (%) - Other Race
Housing units lacking complete plumbing facilities (%)
Housing units lacking complete kitchen facilities (%)
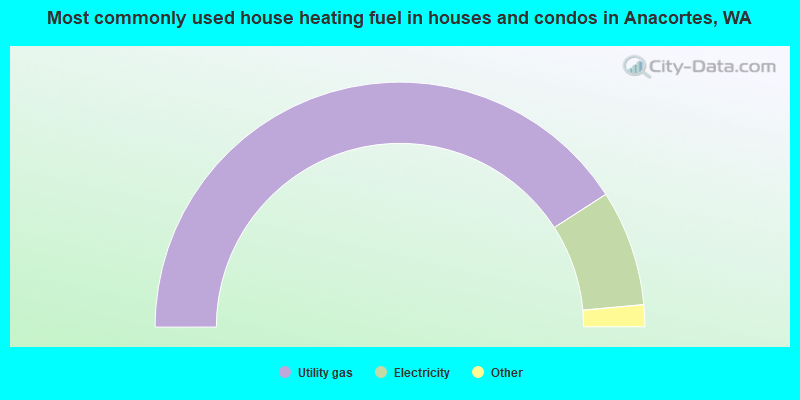
House heating fuel used in houses and condos - Utility gas (%)
House heating fuel used in houses and condos - Bottled, tank, or LP gas (%)
House heating fuel used in houses and condos - Electricity (%)
House heating fuel used in houses and condos - Fuel oil, kerosene, etc. (%)
House heating fuel used in houses and condos - Coal or coke (%)
House heating fuel used in houses and condos - Wood (%)
House heating fuel used in houses and condos - Solar energy (%)
House heating fuel used in houses and condos - Other fuel (%)
House heating fuel used in houses and condos - No fuel used (%)
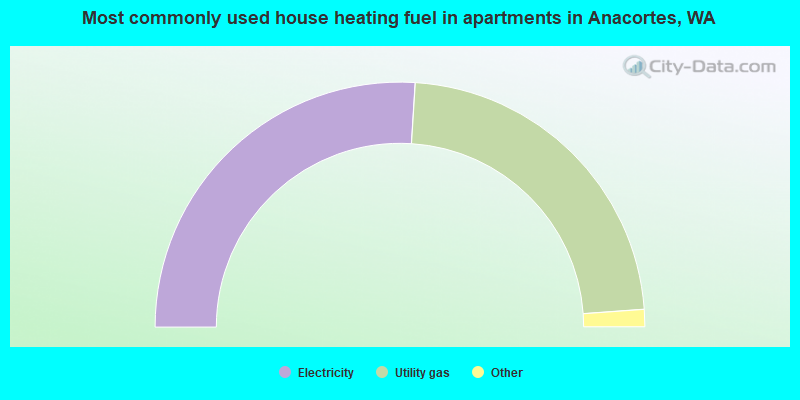
House heating fuel used in apartments - Utility gas (%)
House heating fuel used in apartments - Bottled, tank, or LP gas (%)
House heating fuel used in apartments - Electricity (%)
House heating fuel used in apartments - Fuel oil, kerosene, etc. (%)
House heating fuel used in apartments - Coal or coke (%)
House heating fuel used in apartments - Wood (%)
House heating fuel used in apartments - Solar energy (%)
House heating fuel used in apartments - Other fuel (%)
House heating fuel used in apartments - No fuel used (%)
Latest news about housing in Anacortes, WA collected exclusively by city-data.com from local newspapers, TV, and radio stations
Median year house/condo built: 1994Median year apartment built: 1983Household type by relationship:
Households: 17,898
Male householders: 3,892 (947 living alone ), Female householders: 4,008 (1,433 living alone )4,202 spouses (4,150 opposite-sex spouses ), 459 unmarried partners , (430 opposite-sex unmarried partners ), 4,016 children (3,730 natural , 113 adopted , 172 stepchildren ), 200 grandchildren , 70 brothers or sisters , 134 parents , 10 foster children , 136 other relatives , 589 non-relatives In group quarters: 176
Size of family households: 2,485 2-persons , 931 3-persons , 679 4-persons , 320 5-persons , 114 6-persons , 80 7-or-more-persons .
Size of nonfamily households: 2,511 1-person , 563 2-persons , 63 3-persons , 72 4-persons , 5 7-or-more-persons .
2,142 married couples with children. single-parent households (107 men , 455 women ).
93.9% of residents of Anacortes speak English at home. of residents speak Spanish at home (73% speak English very well , 10% speak English well , 13% speak English not well , 4% don't speak English at all ).of residents speak other Indo-European language at home (82% speak English very well , 8% speak English well , 8% speak English not well , 1% don't speak English at all ).of residents speak Asian or Pacific Island language at home (63% speak English very well , 25% speak English well , 10% speak English not well , 2% don't speak English at all ).of residents speak other language at home (73% speak English very well , 27% speak English well ).
Foreign born population: 1,126 (6.3%)of them are naturalized citizens )
Median number of rooms in houses and condos:
Median number of rooms in apartments
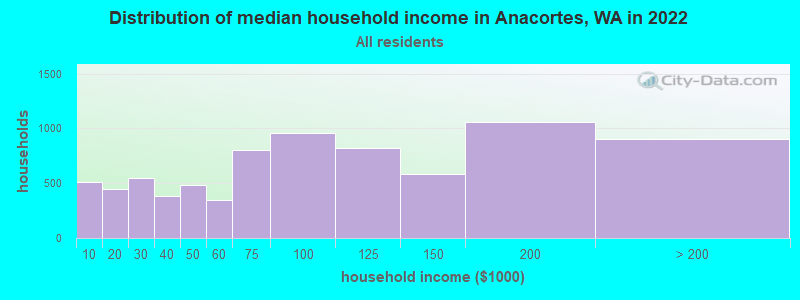
Anacortes, WA household income distribution 509 Less than $10,000448 $10,000 to $19,999548 $20,000 to $29,999379 $30,000 to $39,999483 $40,000 to $49,999349 $50,000 to $59,999803 $60,000 to $74,999963 $75,000 to $99,999822 $100,000 to $124,999581 $125,000 to $149,9991,059 $150,000 to $199,999907 $200,000 or more
Home value of owner - occupied houses in 2022 in Anacortes, WA 60 Less than $10,0003 $10,000 to $14,9992 $30,000 to $34,9992 $35,000 to $39,99936 $40,000 to $49,9996 $50,000 to $59,9993 $60,000 to $69,99915 $80,000 to $89,9991 $90,000 to $99,9990 $100,000 to $124,9992 $125,000 to $149,9998 $150,000 to $174,9999 $175,000 to $199,99932 $200,000 to $249,99995 $250,000 to $299,999409 $300,000 to $399,9991,082 $400,000 to $499,9992,501 $500,000 to $749,9991,384 $750,000 to $999,999554 $1,000,000 to $1,499,999114 $1,500,000 to $1,999,999109 $2,000,000 or moreRent paid by renters in 2022 in Anacortes, WA 1 Less than $1009 $100 to $14936 $150 to $19943 $200 to $24940 $250 to $2993 $300 to $34918 $350 to $39927 $400 to $44916 $450 to $49911 $500 to $54920 $550 to $59923 $600 to $64944 $650 to $69930 $700 to $74930 $750 to $79967 $800 to $89973 $900 to $999359 $1,000 to $1,249389 $1,250 to $1,499496 $1,500 to $1,999249 $2,000 to $2,499175 $2,500 to $2,999156 $3,000 to $3,49935 $3,500 or more66 No cash rent
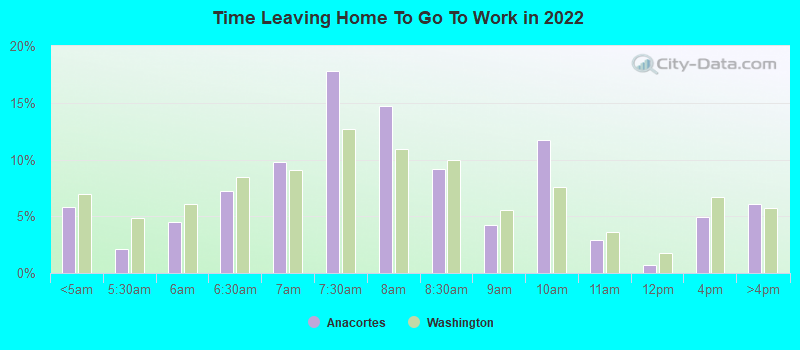
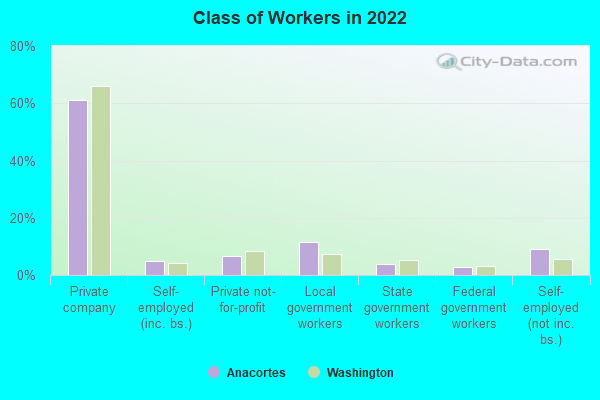
Percentage of workers working in this county: 80.7%Number of people working at home: 1,369 (17.7% of all workers )
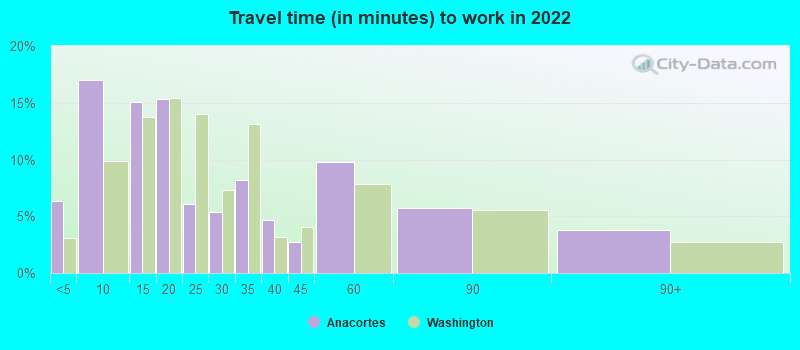
Travel time to work (commute)
Less than 5 minutes: 5195 to 9 minutes: 1,24910 to 14 minutes: 1,11615 to 19 minutes: 80220 to 24 minutes: 46325 to 29 minutes: 60330 to 34 minutes: 89835 to 39 minutes: 16740 to 44 minutes: 9445 to 59 minutes: 23260 to 89 minutes: 20990 or more minutes: 296
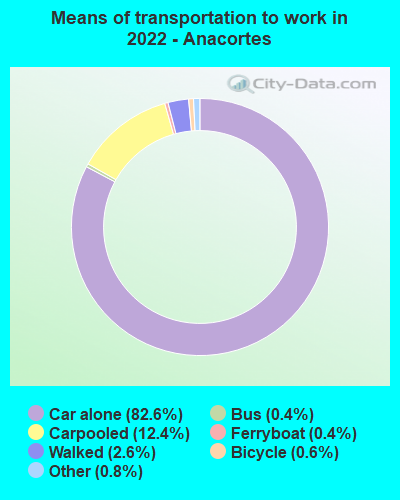
Means of transportation to work:
Drove a car alone: 6,754 (70.2%)Carpooled: 1,050 (10.9%)Bus : 23 (0.2%)Light rail, streetcar or trolley : 10 (0.1%)Ferryboat: 31 (0.3%)Taxi: 63 (0.7%)Bicycle: 46 (0.5%)Walked: 213 (2.2%)Worked at home: 1,369 (14.2%)
Unemployment by race in 2022
Unemployment rate for White non-Hispanic residents 4.5% Males3.7% FemalesUnemployment rate for American Indian and Alaska Native residents 6.2% FemalesUnemployment rate for Asian residents 3.9% MalesUnemployment rate for other race residents 2.6% FemalesUnemployment rate for two or more race residents 12.6% Males8.7% FemalesUnemployment rate for Hispanic or Latino residents 18.1% Males8.5% Females
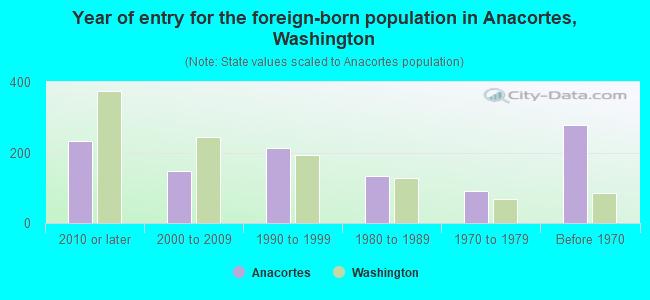
Year of entry for the foreign-born population in Anacortes, Washington
234 2010 or later 147 2000 to 2009 213 1990 to 1999 133 1980 to 1989 91 1970 to 1979 277 Before 1970
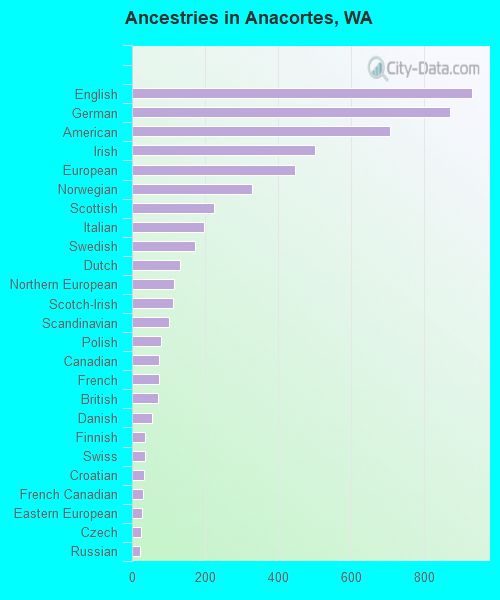
First ancestries reported:
English: 933 (12.8%)
German: 873 (12.0%)
American: 708 (9.7%)
Irish: 501 (6.9%)
European: 448 (6.1%)
Norwegian: 328 (4.5%)
Scottish: 226 (3.1%)
Italian: 198 (2.7%)
Swedish: 173 (2.4%)
Dutch: 131 (1.8%)
Northern European: 115 (1.6%)
Scotch-Irish: 113 (1.5%)
Scandinavian: 101 (1.4%)
Polish: 80 (1.1%)
Canadian: 75 (1.0%)
French: 73 (1.0%)
British: 72 (1.0%)
Danish: 54 (0.7%)
Finnish: 37 (0.5%)
Swiss: 35 (0.5%)
Croatian: 33 (0.5%)
French Canadian: 29 (0.4%)
Eastern European: 27 (0.4%)
Czech: 25 (0.3%)
Russian: 23 (0.3%)
Icelander: 17 (0.2%)
Basque: 17 (0.2%)
Welsh: 15 (0.2%)
Iranian: 13 (0.2%)
Celtic: 12 (0.2%)
Portuguese: 8 (0.1%)
Greek: 8 (0.1%)
Belgian: 8 (0.1%)
Czechoslovakian: 5 (0.07%)
Slovak: 5 (0.07%)
Lebanese: 4 (0.05%)
Serbian: 4 (0.05%)
Armenian: 3 (0.04%)
Hungarian: 3 (0.04%)
Ghanaian: 3 (0.04%)
Kenyan: 3 (0.04%)
Austrian: 3 (0.04%)
Ukrainian: 3 (0.04%)
Australian: 2 (0.03%)
Latvian: 2 (0.03%)
Lithuanian: 2 (0.03%)
Romanian: 2 (0.03%)
New Zealander: 1 (0.01%)
Bulgarian: 1 (0.01%)
Most common places of birth for foreign-born residents (%): Canada Anacortes:
15.1% (172)Washington:
4.1% (47,238)
Mexico Anacortes:
13.7% (156)Washington:
21.1% (241,655)
Philippines Anacortes:
9.6% (110)Washington:
6.3% (71,661)
Germany Anacortes:
5.4% (62)Washington:
1.6% (17,761)
United Kingdom, excluding England and Scotland Anacortes:
4.5% (51)Washington:
1.0% (10,943)
England Anacortes:
4.1% (47)Washington:
0.8% (9,457)
Korea Anacortes:
3.5% (40)Washington:
4.3% (48,886)
China, excluding Hong Kong and Taiwan Anacortes:
3.1% (35)Washington:
7.4% (84,470)
Hong Kong Anacortes:
3.1% (35)Washington:
0.8% (8,785)
Japan Anacortes:
2.7% (31)Washington:
1.5% (17,453)
Netherlands Anacortes:
2.5% (29)Washington:
0.3% (3,414)
Australia Anacortes:
2.5% (28)Washington:
0.4% (4,499)
Russia Anacortes:
2.5% (28)Washington:
1.9% (21,540)
India Anacortes:
1.8% (21)Washington:
8.9% (101,353)
Place of birth for U.S.-born residents:
This state: 7,370Other state: 9,001Northeast: 1,162Midwest: 1,837South: 1,656West: 4,369 87.1% of Anacortes residents lived in the same house 1 years ago.
Out of people who lived in different houses, 22.7% lived in this county.
Out of people who lived in different counties, 50.9% lived in Washington.
Anacortes:
87.1%State average:
85.2%
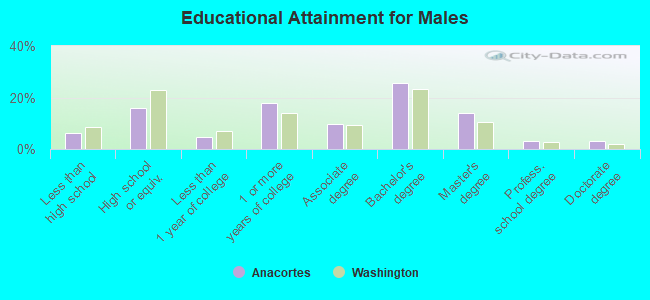
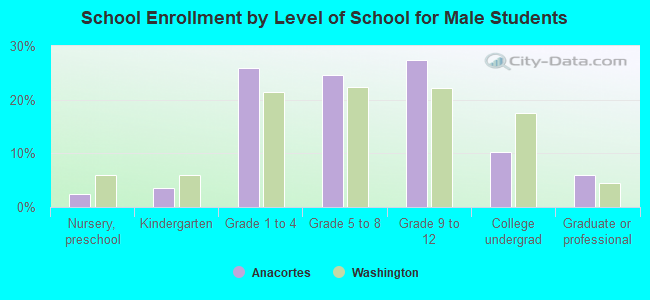
Education attainment for males 25 years and older:
No schooling: 71Nursery to 4th grade: 165th and 6th grade: 147th and 8th grade: 389th grade: 1010th grade: 1211th grade: 7012th grade, no diploma: 178High school graduate (or equivalency): 1,067Less than 1 year of college: 309Some college more than 1 year, no degree: 1,179Associate degree: 653Bachelor's degree: 1,703Master's degree: 921Professional school degree: 215Doctorate degree: 197
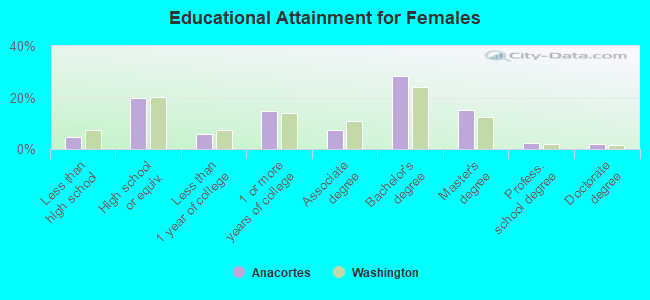
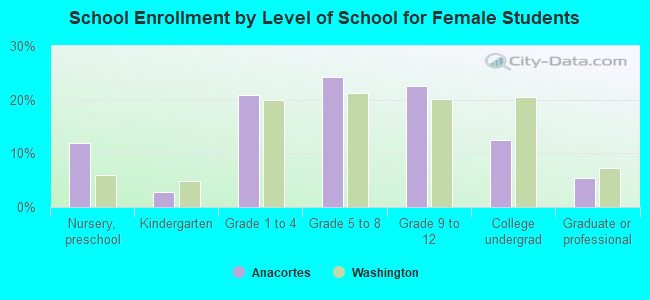
Education attainment for females 25 years and older:
No schooling: 65Nursery to 4th grade: 205th and 6th grade: 07th and 8th grade: 229th grade: 4410th grade: 2811th grade: 5712th grade, no diploma: 96High school graduate (or equivalency): 1,449Less than 1 year of college: 429Some college more than 1 year, no degree: 1,086Associate degree: 546Bachelor's degree: 2,099Master's degree: 1,103Professional school degree: 180Doctorate degree: 140
Housing units in structures:
One, detached: 6,727One, attached: 405Two: 2623 or 4: 3045 to 9: 27810 to 19: 26420 to 49: 20050 or more: 111Mobile homes: 152Boats, RVs, vans, etc.: 6Median worth of mobile homes: $451,340
Housing units lacking complete plumbing facilities in 2022: 0.4%Housing units lacking complete kitchen facilities in 2022: 0.8%House/condo owner moved in on average 9 years ago
Renter moved in on average 2 years ago
Private vs. public school enrollment:
Students in private schools in grades 1 to 8 (elementary and middle school): 210 Here:
14.1%Washington:
12.4%
Students in private schools in grades 9 to 12 (high school): 71 Students in private undergraduate colleges: 59 Here:
15.9%Washington:
16.5%