Albuquerque, NM (New Mexico) Houses and Residents
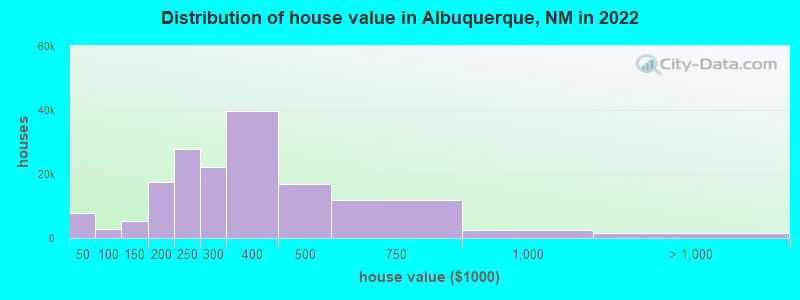
Estimated median house or condo value in 2022: $288,700 (it was $123,700 in 2000 )
Albuquerque:
$288,700New Mexico:
$243,100
Lower value quartile - upper value quartile: $210,900 - $384,900Mean price in 2022: Detached houses: $325,874 Here:
$325,874State:
$322,045
Townhouses or other attached units: $235,754 Here:
$235,754State:
$284,053
In 2-unit structures: $251,017 Here:
$251,017State:
$354,971
In 3-to-4-unit structures: $264,961 Here:
$264,961State:
$235,720
In 5-or-more-unit structures: $198,180 Here:
$198,180State:
$217,304
Mobile homes: $70,749 Here:
$70,749State:
$117,675
Occupied boats, RVs, vans, etc.: $28,286 Here:
$28,286State:
$78,635
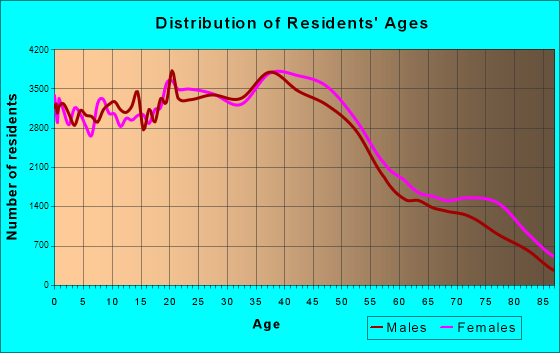
Total population: 557,169 (Urban population: 447,695, Rural population: 932 (all nonfarm) )
Houses: 258,335 (243,680 occupied: 154,980 owner occupied, 88,700 renter occupied )
% of renters here:
36%State:
29%
Housing density: 1,430 houses/condos per square mile
Median price asked for vacant for-sale houses and condos in 2022: $251,202.
Median contract rent in 2022: $918 (lower quartile is $712, upper quartile is $1,234)
Median rent asked for vacant for-rent units in 2022: $1,402
Median gross rent in Albuquerque, NM in 2022: $1,037
Housing units in Albuquerque with a mortgage: 102,989 (11,026 second mortgage, 161 home equity loan, 7,166 both second mortgage and home equity loan )Houses without a mortgage: 1,555
Median household income for houses/condos with a mortgage: $91,952
Median household income for apartments without a mortgage: $66,967
Median monthly housing costs: $1,101
Data:
Median house or condo value ($)
Median house or condo value ($ change since 2000)
Median house or condo value ($) - White
Median house or condo value ($) - Black or African American
Median house or condo value ($) - Asian
Median house or condo value ($) - Hispanic or Latino
Median house or condo value ($) - American Indian and Alaska Native
Median house or condo value ($) - Multirace
Median house or condo value ($) - Other Race
Median price asked for mobile homes ($)
Household density (households per square mile)
Mean house or condo value by units in structure - 1, detached ($)
Mean house or condo value by units in structure - 1, attached ($)
Mean house or condo value by units in structure - 2 ($)
Mean house or condo value by units in structure by units in structure - 3 or 4 ($)
Mean house or condo value by units in structure - 5 or more ($)
Mean house or condo value by units in structure - Boat, RV, van, etc. ($)
Mean house or condo value by units in structure - Mobile home ($)
Median contract rent ($)
Median contract rent - Lower quartile ($)
Median contract rent - Upper quartile ($)
Median gross rent ($)
Urban houses (%)
Rural houses (%)
Houses occupied (%)
Houses occupied (% change since 2000)
Houses owner occupied (%)
Houses owner occupied (% change since 2000)
Houses renter occupied (%)
Houses renter occupied (% change since 2000)
Vacant housing units - For rent (%)
Vacant housing units - For rent (% change since 2000)
Vacant housing units - For sale only (%)
Vacant housing units - For sale only (% change since 2000)
Vacant housing units - Rented or sold, not occupied (%)
Vacant housing units - Rented or sold, not occupied (% change since 2000)
Vacant housing units - For seasonal, recreational, or occasional use (%)
Vacant housing units - For seasonal, recreational, or occasional use (% change since 2000)
Vacant housing units - For migrant workers (%)
Vacant housing units - For migrant workers (% change since 2000)
Vacant housing units - Other vacant (%)
Vacant housing units - Other vacant (% change since 2000)
Median monthly housing costs ($)
Median household income for houses/condos with a mortgage ($)
Median household income for houses/condos without a mortgage ($)
Median household income ($)
Median household income ($) - White
Median household income ($) - Black or African American
Median household income ($) - Asian
Median household income ($) - Hispanic or Latino
Median household income ($) - American Indian and Alaska Native
Median household income ($) - Multirace
Median household income ($) - Other Race
Mortgage status - with mortgage (%)
Mortgage status - with second mortgage (%)
Mortgage status - with home equity loan (%)
Mortgage status - with both second mortgage and home equity loan (%)
Mortgage status - without a mortgage (%)
Median year house/condo built
Median year apartment built
Household type by relationship - Male householder living alone (%)
Household type by relationship - Male householder not living alone (%)
Household type by relationship - Female householder living alone (%)
Household type by relationship - Female householder not living alone (%)
Household type by relationship - Opposite-Sex spouse (%)
Household type by relationship - Same-Sex spouse (%)
Household type by relationship - Opposite-Sex unmarried partner (%)
Household type by relationship - Same-Sex unmarried partner (%)
Household type by relationship - In group quarters (%)
Size of family households - 2-person household (%)
Size of family households - 3-person household (%)
Size of family households - 4-person household (%)
Size of family households - 5-person household (%)
Size of family households - 6-person household (%)
Size of family households - 7-or-more-person household (%)
Size of nonfamily households - 1-person household (%)
Size of nonfamily households - 2-person household (%)
Size of nonfamily households - 3-person household (%)
Size of nonfamily households - 4-person household (%)
Size of nonfamily households - 5-person household (%)
Size of nonfamily households - 6-person household (%)
Size of nonfamily households - 7-or-moreperson household (%)
Year house built - Built 2010 or later (%)
Year house built - Built 2000 to 2009 (%)
Year house built - Built 1990 to 1999 (%)
Year house built - Built 1980 to 1989 (%)
Year house built - Built 1970 to 1979 (%)
Year house built - Built 1960 to 1969 (%)
Year house built - Built 1950 to 1959 (%)
Year house built - Built 1940 to 1949 (%)
Year house built - Built 1939 or earlier (%)
Median number of rooms in houses and condos
Median number of rooms in apartments
Median number of bedrooms in owner occupied houses
Mean number of bedrooms in owner occupied houses
Median number of bedrooms in renter occupied houses
Mean number of bedrooms in renter occupied houses
Median number of vehichles in owner occupied houses
Mean number of vehichles in owner occupied houses
Median number of vehichles in renter occupied houses
Mean number of vehichles in renter occupied houses
Rooms in owner-occupied houses - 1 room (%)
Rooms in owner-occupied houses - 2 rooms (%)
Rooms in owner-occupied houses - 3 rooms (%)
Rooms in owner-occupied houses - 4 rooms (%)
Rooms in owner-occupied houses - 5 rooms (%)
Rooms in owner-occupied houses - 6 rooms (%)
Rooms in owner-occupied houses - 7 rooms (%)
Rooms in owner-occupied houses - 8 rooms (%)
Rooms in owner-occupied houses - 9+ rooms (%)
Rooms in renter-occupied houses - 1 room (%)
Rooms in renter-occupied houses - 2 rooms (%)
Rooms in renter-occupied houses - 3 rooms (%)
Rooms in renter-occupied houses - 4 rooms (%)
Rooms in renter-occupied houses - 5 rooms (%)
Rooms in renter-occupied houses - 6 rooms (%)
Rooms in renter-occupied houses - 7 rooms (%)
Rooms in renter-occupied houses - 8 rooms (%)
Rooms in renter-occupied houses - 9+ rooms (%)
Bedrooms in owner-occupied houses - no bedrooms (%)
Bedrooms in owner-occupied houses - 1 bedroom (%)
Bedrooms in owner-occupied houses - 2 bedrooms (%)
Bedrooms in owner-occupied houses - 3 bedrooms (%)
Bedrooms in owner-occupied houses - 4 bedrooms (%)
Bedrooms in owner-occupied houses - 5+ bedrooms (%)
Bedrooms in renter-occupied houses - no bedrooms (%)
Bedrooms in renter-occupied houses - 1 bedroom (%)
Bedrooms in renter-occupied houses - 2 bedrooms (%)
Bedrooms in renter-occupied houses - 3 bedrooms (%)
Bedrooms in renter-occupied houses - 4 bedrooms (%)
Bedrooms in renter-occupied houses - 5+ bedrooms (%)
Vehicles available in owner-occupied houses - no vehicle available (%)
Vehicles available in owner-occupied houses - 1 vehicle available(%)
Vehicles available in owner-occupied houses - 2 Vehicles available (%)
Vehicles available in owner-occupied houses - 3 Vehicles available (%)
Vehicles available in owner-occupied houses - 4 Vehicles available (%)
Vehicles available in owner-occupied houses - 5+ Vehicles available (%)
Vehicles available in renter-occupied houses - no vehicle available (%)
Vehicles available in renter-occupied houses - 1 vehicle available (%)
Vehicles available in renter-occupied houses - 2 Vehicles available (%)
Vehicles available in renter-occupied houses - 3 Vehicles available (%)
Vehicles available in renter-occupied houses - 4 Vehicles available (%)
Vehicles available in renter-occupied houses - 5+ Vehicles available (%)
Housing units in structures - 1, detached (%)
Housing units in structures - 1, attached (%)
Housing units in structures - 2 (%)
Housing units in structures - 3 or 4 (%)
Housing units in structures - 5 to 9 (%)
Housing units in structures - 10 to 19 (%)
Housing units in structures - 20 to 49 (%)
Housing units in structures - 50 or more (%)
Housing units in structures - Mobile home (%)
Housing units in structures - Boat, RV, van, etc. (%)
Housing units in structures - Owners - 1, detached (%)
Housing units in structures - Owners - 1, attached (%)
Housing units in structures - Owners - 2 (%)
Housing units in structures - Owners - 3 or 4 (%)
Housing units in structures - Owners - 5 to 9 (%)
Housing units in structures - Owners - 10 to 19 (%)
Housing units in structures - Owners - 20 to 49 (%)
Housing units in structures - Owners - 50 or more (%)
Housing units in structures - Owners - Mobile home (%)
Housing units in structures - Owners - Boat, RV, van, etc. (%)
Housing units in structures - Renters - 1, detached (%)
Housing units in structures - Renters - 1, attached (%)
Housing units in structures - Renters - 2 (%)
Housing units in structures - Renters - 3 or 4 (%)
Housing units in structures - Renters - 5 to 9 (%)
Housing units in structures - Renters - 10 to 19 (%)
Housing units in structures - Renters - 20 to 49 (%)
Housing units in structures - Renters - 50 or more (%)
Housing units in structures - Renters - Mobile home (%)
Housing units in structures - Renters - Boat, RV, van, etc. (%)
House/condo owner moved in on average (years ago)
Renter moved in on average (years ago)
Year householder moved into unit - Moved in 1999 to March 2000 (%)
Year householder moved into unit - Moved in 1999 to March 2000 (%) - White
Year householder moved into unit - Moved in 1999 to March 2000 (%) - Black or African American
Year householder moved into unit - Moved in 1999 to March 2000 (%) - Asian
Year householder moved into unit - Moved in 1999 to March 2000 (%) - Hispanic or Latino
Year householder moved into unit - Moved in 1999 to March 2000 (%) - American Indian and Alaska Native
Year householder moved into unit - Moved in 1999 to March 2000 (%) - Multirace
Year householder moved into unit - Moved in 1999 to March 2000 (%) - Other Race
Year householder moved into unit - Moved in 1995 to 1998 (%)
Year householder moved into unit - Moved in 1995 to 1998 (%) - White
Year householder moved into unit - Moved in 1995 to 1998 (%) - Black or African American
Year householder moved into unit - Moved in 1995 to 1998 (%) - Asian
Year householder moved into unit - Moved in 1995 to 1998 (%) - Hispanic or Latino
Year householder moved into unit - Moved in 1995 to 1998 (%) - American Indian and Alaska Native
Year householder moved into unit - Moved in 1995 to 1998 (%) - Multirace
Year householder moved into unit - Moved in 1995 to 1998 (%) - Other Race
Year householder moved into unit - Moved in 1990 to 1994 (%)
Year householder moved into unit - Moved in 1990 to 1994 (%) - White
Year householder moved into unit - Moved in 1990 to 1994 (%) - Black or African American
Year householder moved into unit - Moved in 1990 to 1994 (%) - Asian
Year householder moved into unit - Moved in 1990 to 1994 (%) - Hispanic or Latino
Year householder moved into unit - Moved in 1990 to 1994 (%) - American Indian and Alaska Native
Year householder moved into unit - Moved in 1990 to 1994 (%) - Multirace
Year householder moved into unit - Moved in 1990 to 1994 (%) - Other Race
Year householder moved into unit - Moved in 1980 to 1989 (%)
Year householder moved into unit - Moved in 1980 to 1989 (%) - White
Year householder moved into unit - Moved in 1980 to 1989 (%) - Black or African American
Year householder moved into unit - Moved in 1980 to 1989 (%) - Asian
Year householder moved into unit - Moved in 1980 to 1989 (%) - Hispanic or Latino
Year householder moved into unit - Moved in 1980 to 1989 (%) - American Indian and Alaska Native
Year householder moved into unit - Moved in 1980 to 1989 (%) - Multirace
Year householder moved into unit - Moved in 1980 to 1989 (%) - Other Race
Year householder moved into unit - Moved in 1970 to 1979 (%)
Year householder moved into unit - Moved in 1970 to 1979 (%) - White
Year householder moved into unit - Moved in 1970 to 1979 (%) - Black or African American
Year householder moved into unit - Moved in 1970 to 1979 (%) - Asian
Year householder moved into unit - Moved in 1970 to 1979 (%) - Hispanic or Latino
Year householder moved into unit - Moved in 1970 to 1979 (%) - American Indian and Alaska Native
Year householder moved into unit - Moved in 1970 to 1979 (%) - Multirace
Year householder moved into unit - Moved in 1970 to 1979 (%) - Other Race
Year householder moved into unit - Moved in 1969 or earlier (%)
Year householder moved into unit - Moved in 1969 or earlier (%) - White
Year householder moved into unit - Moved in 1969 or earlier (%) - Black or African American
Year householder moved into unit - Moved in 1969 or earlier (%) - Asian
Year householder moved into unit - Moved in 1969 or earlier (%) - Hispanic or Latino
Year householder moved into unit - Moved in 1969 or earlier (%) - American Indian and Alaska Native
Year householder moved into unit - Moved in 1969 or earlier (%) - Multirace
Year householder moved into unit - Moved in 1969 or earlier (%) - Other Race
Housing units lacking complete plumbing facilities (%)
Housing units lacking complete kitchen facilities (%)
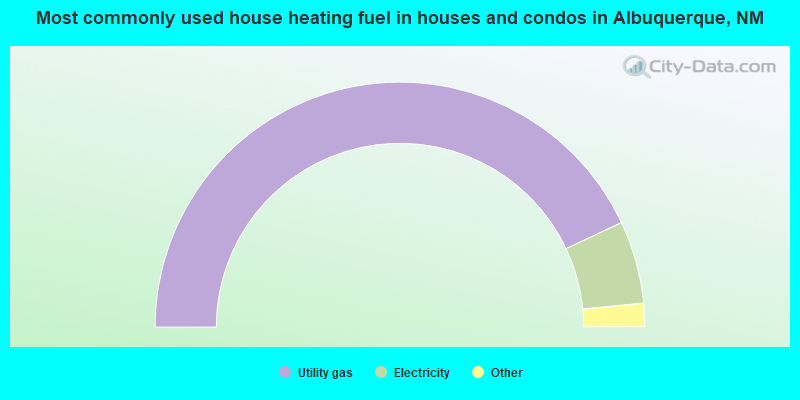
House heating fuel used in houses and condos - Utility gas (%)
House heating fuel used in houses and condos - Bottled, tank, or LP gas (%)
House heating fuel used in houses and condos - Electricity (%)
House heating fuel used in houses and condos - Fuel oil, kerosene, etc. (%)
House heating fuel used in houses and condos - Coal or coke (%)
House heating fuel used in houses and condos - Wood (%)
House heating fuel used in houses and condos - Solar energy (%)
House heating fuel used in houses and condos - Other fuel (%)
House heating fuel used in houses and condos - No fuel used (%)
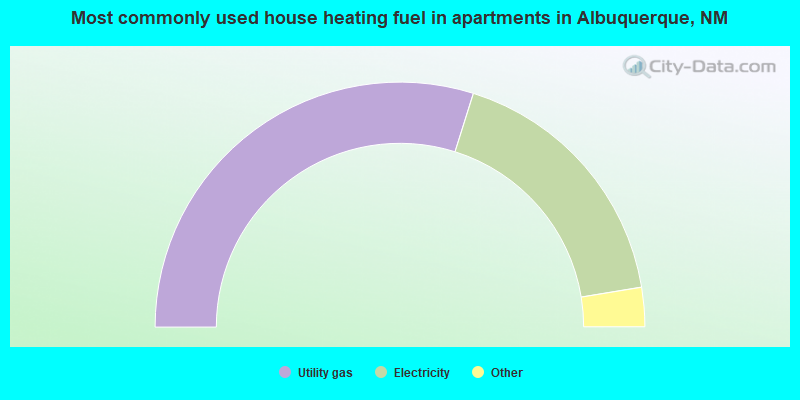
House heating fuel used in apartments - Utility gas (%)
House heating fuel used in apartments - Bottled, tank, or LP gas (%)
House heating fuel used in apartments - Electricity (%)
House heating fuel used in apartments - Fuel oil, kerosene, etc. (%)
House heating fuel used in apartments - Coal or coke (%)
House heating fuel used in apartments - Wood (%)
House heating fuel used in apartments - Solar energy (%)
House heating fuel used in apartments - Other fuel (%)
House heating fuel used in apartments - No fuel used (%)
Latest news about housing in Albuquerque, NM collected exclusively by city-data.com from local newspapers, TV, and radio stations
Median year house/condo built: 1984Median year apartment built: 1980Household type by relationship:
Households: 561,006
Male householders: 115,454 (40,774 living alone ), Female householders: 128,226 (50,239 living alone )86,423 spouses (84,423 opposite-sex spouses ), 23,836 unmarried partners , (20,956 opposite-sex unmarried partners ), 148,426 children (139,846 natural , 3,895 adopted , 4,685 stepchildren ), 14,307 grandchildren , 7,322 brothers or sisters , 8,008 parents , 335 foster children , 7,769 other relatives , 12,755 non-relatives In group quarters: 8,145
Size of family households: 60,534 2-persons , 31,515 3-persons , 23,783 4-persons , 10,712 5-persons , 3,873 6-persons , 1,458 7-or-more-persons .
Size of nonfamily households: 91,013 1-person , 18,757 2-persons , 1,598 3-persons , 323 4-persons , 53 5-persons , 61 7-or-more-persons .
57,509 married couples with children. single-parent households (13,558 men , 27,550 women ).
74.8% of residents of Albuquerque speak English at home. of residents speak Spanish at home (73% speak English very well , 15% speak English well , 8% speak English not well , 4% don't speak English at all ).of residents speak other Indo-European language at home (82% speak English very well , 15% speak English well , 3% speak English not well ).of residents speak Asian or Pacific Island language at home (68% speak English very well , 17% speak English well , 13% speak English not well , 1% don't speak English at all ).of residents speak other language at home (93% speak English very well , 5% speak English well , 1% speak English not well ).
Foreign born population: 54,400 (9.7%)of them are naturalized citizens )
Median number of rooms in houses and condos:
Median number of rooms in apartments
Owner-occupied Renter-occupied
Bedrooms in owner-occupied houses and condos in Albuquerque, New Mexico
1,604 no bedroom 1,873 1 bedroom 24,475 2 bedrooms 83,899 3 bedrooms 37,195 4 bedrooms 5,934 5+ bedrooms
Bedrooms in renter-occupied apartments in Albuquerque, New Mexico
7,434 no bedroom 25,962 1 bedroom 34,388 2 bedrooms 17,280 3 bedrooms 3,358 4 bedrooms 278 5+ bedrooms
Owner-occupied Renter-occupied
Cars and other vehicles available in Albuquerque in owner-occupied houses/condos
4,016 no vehicle 48,612 1 vehicle 63,398 2 vehicles 27,259 3 vehicles 8,847 4 vehicles 2,848 5+ vehicles
Cars and other vehicles available in Albuquerque in renter-occupied apartments
9,795 no vehicle 51,191 1 vehicle 22,071 2 vehicles 4,596 3 vehicles 853 4 vehicles 194 5+ vehicles
Owner-occupied Renter-occupied
Rooms in owner-occupied houses in Albuquerque, New Mexico
1,458 1 room 674 2 rooms 3,408 3 rooms 16,928 4 rooms 31,065 5 rooms 34,728 6 rooms 28,495 7 rooms 18,535 8 rooms 19,689 9+ rooms
Rooms in renter-occupied apartments in Albuquerque, New Mexico
6,895 1 room 6,437 2 rooms 20,755 3 rooms 23,622 4 rooms 14,640 5 rooms 9,131 6 rooms 3,905 7 rooms 1,758 8 rooms 1,557 9+ rooms
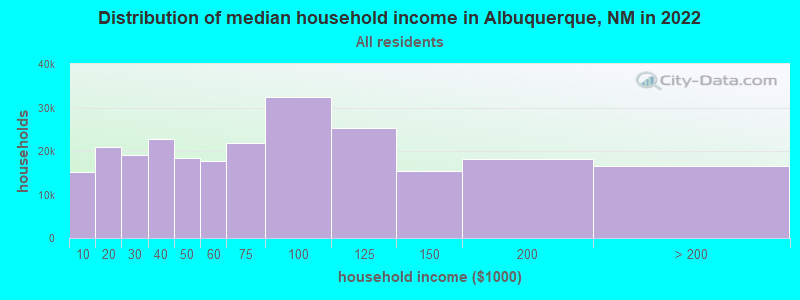
Albuquerque, NM household income distribution 15,130 Less than $10,00021,015 $10,000 to $19,99919,159 $20,000 to $29,99922,717 $30,000 to $39,99918,429 $40,000 to $49,99917,593 $50,000 to $59,99921,914 $60,000 to $74,99932,457 $75,000 to $99,99925,273 $100,000 to $124,99915,328 $125,000 to $149,99918,066 $150,000 to $199,99916,599 $200,000 or more
Home value of owner - occupied houses in 2022 in Albuquerque, NM 1,817 Less than $10,000884 $10,000 to $14,999763 $15,000 to $19,9991,223 $20,000 to $24,999335 $25,000 to $29,9991,337 $30,000 to $34,999749 $35,000 to $39,999731 $40,000 to $49,99964 $50,000 to $59,999545 $60,000 to $69,999295 $70,000 to $79,999881 $80,000 to $89,999397 $90,000 to $99,9993,332 $100,000 to $124,9991,991 $125,000 to $149,99910,121 $150,000 to $174,9997,271 $175,000 to $199,99927,683 $200,000 to $249,99922,075 $250,000 to $299,99939,719 $300,000 to $399,99916,985 $400,000 to $499,99911,777 $500,000 to $749,9992,437 $750,000 to $999,999949 $1,000,000 to $1,499,999237 $1,500,000 to $1,999,999382 $2,000,000 or moreRent paid by renters in 2022 in Albuquerque, NM 152 Less than $100836 $150 to $1991,016 $200 to $249723 $250 to $299417 $300 to $349969 $350 to $3991,006 $400 to $4491,256 $450 to $4993,987 $500 to $5492,152 $550 to $5993,841 $600 to $6493,552 $650 to $6995,284 $700 to $7494,387 $750 to $79911,129 $800 to $8999,263 $900 to $99914,535 $1,000 to $1,2496,713 $1,250 to $1,49910,244 $1,500 to $1,9991,680 $2,000 to $2,499527 $2,500 to $2,999120 $3,000 to $3,499974 $3,500 or more3,937 No cash rent
Percentage of workers working in this county: 92.7%Number of people working at home: 41,245 (14.6% of all workers )
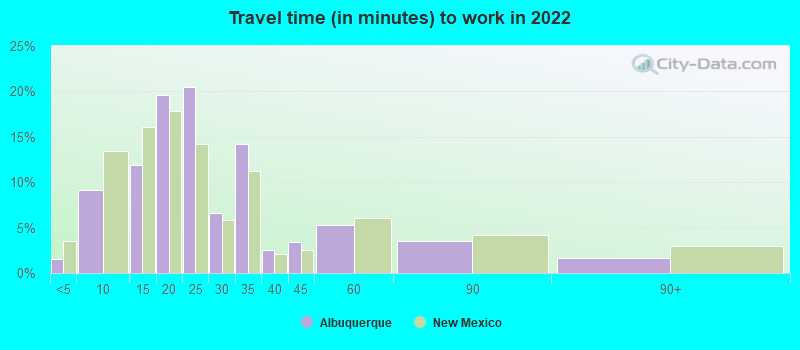
Travel time to work (commute)
Less than 5 minutes: 3,7585 to 9 minutes: 23,84610 to 14 minutes: 31,52515 to 19 minutes: 51,75020 to 24 minutes: 51,54825 to 29 minutes: 18,10630 to 34 minutes: 30,03935 to 39 minutes: 3,79340 to 44 minutes: 5,47145 to 59 minutes: 9,32660 to 89 minutes: 8,38790 or more minutes: 4,115
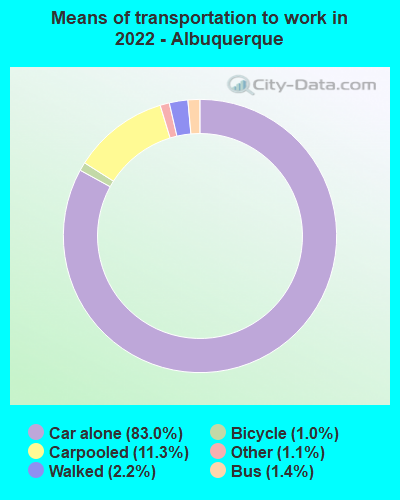
Means of transportation to work:
Drove a car alone: 215,854 (71.6%)Carpooled: 29,494 (9.8%)Bus : 3,515 (1.2%)Long-distance train or commuter rail : 66 (0.0%)Light rail, streetcar or trolley : 111 (0.0%)Taxi: 2,765 (0.9%)Bicycle: 2,642 (0.9%)Walked: 5,736 (1.9%)Worked at home: 41,245 (13.7%)
Unemployment by race in 2022
Unemployment rate for White non-Hispanic residents 2.3% Males2.4% FemalesUnemployment rate for Black residents 27.7% Males6.7% FemalesUnemployment rate for American Indian and Alaska Native residents 3.1% Males3.0% FemalesUnemployment rate for Asian residents 3.7% MalesUnemployment rate for other race residents 7.4% Males7.0% FemalesUnemployment rate for two or more race residents 3.7% Males2.0% FemalesUnemployment rate for Hispanic or Latino residents 5.8% Males3.9% Females
Year of entry for the foreign-born population in Albuquerque, New Mexico
10,806 2010 or later 12,720 2000 to 2009 14,375 1990 to 1999 10,081 1980 to 1989 6,345 1970 to 1979 5,694 Before 1970
First ancestries reported:
English: 18,224 (5.8%)
American: 13,379 (4.2%)
German: 12,293 (3.9%)
Irish: 11,145 (3.5%)
European: 6,298 (2.0%)
Italian: 5,456 (1.7%)
Scottish: 2,043 (0.6%)
Polish: 1,793 (0.6%)
French: 1,564 (0.5%)
Scotch-Irish: 1,446 (0.5%)
British: 1,326 (0.4%)
Norwegian: 1,154 (0.4%)
Dutch: 1,049 (0.3%)
Northern European: 1,022 (0.3%)
Scandinavian: 936 (0.3%)
African: 928 (0.3%)
Russian: 844 (0.3%)
Swedish: 843 (0.3%)
Greek: 789 (0.2%)
Iranian: 576 (0.2%)
Ukrainian: 555 (0.2%)
Nigerian: 552 (0.2%)
Eastern European: 535 (0.2%)
Czech: 512 (0.2%)
French Canadian: 491 (0.2%)
Danish: 485 (0.2%)
Welsh: 459 (0.1%)
Canadian: 389 (0.1%)
Portuguese: 375 (0.1%)
Iraqi: 370 (0.1%)
Hungarian: 361 (0.1%)
Palestinian: 344 (0.1%)
Lebanese: 320 (0.1%)
Afghan: 283 (0.09%)
Romanian: 265 (0.08%)
Belgian: 244 (0.08%)
Swiss: 236 (0.07%)
Arab: 216 (0.07%)
Turkish: 203 (0.06%)
Finnish: 180 (0.06%)
Lithuanian: 171 (0.05%)
Slavic: 161 (0.05%)
Czechoslovakian: 154 (0.05%)
Brazilian: 143 (0.05%)
Ethiopian: 139 (0.04%)
Celtic: 122 (0.04%)
Syrian: 118 (0.04%)
Cajun: 118 (0.04%)
Guyanese: 111 (0.04%)
Pennsylvania German: 103 (0.03%)
Liberian: 97 (0.03%)
Egyptian: 92 (0.03%)
Slovak: 85 (0.03%)
Croatian: 83 (0.03%)
Ghanaian: 81 (0.03%)
Haitian: 75 (0.02%)
Moroccan: 66 (0.02%)
Austrian: 66 (0.02%)
Jamaican: 50 (0.02%)
Yugoslavian: 49 (0.02%)
Slovene: 48 (0.02%)
Bulgarian: 48 (0.02%)
Australian: 48 (0.02%)
Serbian: 47 (0.01%)
Basque: 43 (0.01%)
Israeli: 40 (0.01%)
Kenyan: 40 (0.01%)
Armenian: 39 (0.01%)
Jordanian: 35 (0.01%)
South African: 29 (0.01%)
Sudanese: 29 (0.01%)
New Zealander: 24 (0.01%)
Ugandan: 22 (0.01%)
Icelander: 22 (0.01%)
German Russian: 21 (0.01%)
Dutch West Indian: 21 (0.01%)
U.S. Virgin Islander: 17 (0.01%)
Trinidadian and Tobagonian: 16 (0.01%)
Most common places of birth for foreign-born residents (%): Mexico Albuquerque:
48.5% (28,409)New Mexico:
66.5% (129,316)
Vietnam Albuquerque:
5.4% (3,160)New Mexico:
2.1% (4,150)
Philippines Albuquerque:
3.9% (2,258)New Mexico:
3.2% (6,181)
Cuba Albuquerque:
3.0% (1,744)New Mexico:
1.5% (2,989)
India Albuquerque:
3.0% (1,733)New Mexico:
1.5% (3,002)
Germany Albuquerque:
2.6% (1,530)New Mexico:
1.9% (3,753)
China, excluding Hong Kong and Taiwan Albuquerque:
2.5% (1,466)New Mexico:
1.6% (3,140)
Colombia Albuquerque:
1.6% (912)New Mexico:
0.6% (1,258)
Place of birth for U.S.-born residents:
This state: 299,008Other state: 198,740Northeast: 28,033Midwest: 47,699South: 53,114West: 69,894 86.7% of Albuquerque residents lived in the same house 1 years ago.
Out of people who lived in different houses, 37.9% lived in this county.
Out of people who lived in different counties, 22.7% lived in New Mexico.
Albuquerque:
86.7%State average:
88.2%
Education attainment for males 25 years and older:
No schooling: 3,239Nursery to 4th grade: 3625th and 6th grade: 2,1747th and 8th grade: 6769th grade: 3,05510th grade: 2,54711th grade: 1,64512th grade, no diploma: 3,490High school graduate (or equivalency): 42,040Less than 1 year of college: 11,515Some college more than 1 year, no degree: 26,535Associate degree: 18,368Bachelor's degree: 37,465Master's degree: 22,541Professional school degree: 4,983Doctorate degree: 6,865
Education attainment for females 25 years and older:
No schooling: 3,013Nursery to 4th grade: 3275th and 6th grade: 2,4807th and 8th grade: 1,3339th grade: 3,54210th grade: 2,00711th grade: 2,96612th grade, no diploma: 2,564High school graduate (or equivalency): 39,833Less than 1 year of college: 14,769Some college more than 1 year, no degree: 28,918Associate degree: 17,643Bachelor's degree: 47,635Master's degree: 28,492Professional school degree: 5,236Doctorate degree: 4,031
Housing units in structures:
One, detached: 165,801One, attached: 13,226Two: 3,4883 or 4: 13,6695 to 9: 9,55010 to 19: 12,23720 to 49: 9,33450 or more: 21,662Mobile homes: 8,974Boats, RVs, vans, etc.: 394Median worth of mobile homes: $31,800
Housing units lacking complete plumbing facilities in 2022: 0.5%Housing units lacking complete kitchen facilities in 2022: 0.7%House/condo owner moved in on average 11 years ago
Renter moved in on average 2 years ago
Private vs. public school enrollment:
Students in private schools in grades 1 to 8 (elementary and middle school): 6,473 Here:
12.5%New Mexico:
10.2%
Students in private schools in grades 9 to 12 (high school): 4,659 Here:
16.3%New Mexico:
10.0%
Students in private undergraduate colleges: 2,462 Here:
8.9%New Mexico:
12.3%