Aiken, SC (South Carolina) Houses and Residents
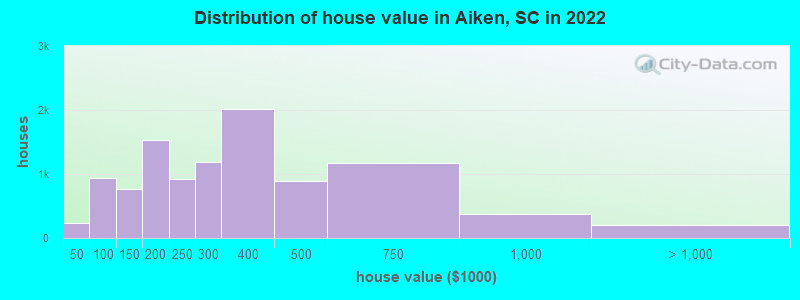
Estimated median house or condo value in 2022: $275,139 (it was $108,400 in 2000 )
Aiken:
$275,139South Carolina:
$254,600
Lower value quartile - upper value quartile: $159,685 - $439,916Mean price in 2022: Detached houses: $375,716 Here:
$375,716State:
$368,255
Townhouses or other attached units: $220,056 Here:
$220,056State:
$292,023
In 2-unit structures: $242,213 Here:
$242,213State:
$358,283
In 3-to-4-unit structures: $78,711 Here:
$78,711State:
$230,702
In 5-or-more-unit structures: $260,494 Here:
$260,494State:
$326,361
Mobile homes: $68,133 Here:
$68,133State:
$102,531
Total population: 30,258 (Urban population: 24,468, Rural population: 872 (6 farm, 866 nonfarm ))
Houses: 15,143 (13,349 occupied: 9,374 owner occupied, 4,243 renter occupied )
% of renters here:
31%State:
28%
Housing density: 936 houses/condos per square mile
Median price asked for vacant for-sale houses and condos in 2022: $433,810.
Median contract rent in 2022: $937 (lower quartile is $661, upper quartile is $1,235)
Median rent asked for vacant for-rent units in 2022: $2,725
Median gross rent in Aiken, SC in 2022: $1,109
Housing units in Aiken with a mortgage: 5,456 (379 second mortgage, 32 home equity loan, 305 both second mortgage and home equity loan )Houses without a mortgage: 64
Median household income for houses/condos with a mortgage: $92,229
Median household income for apartments without a mortgage: $69,005
Median monthly housing costs: $953
Data:
Median house or condo value ($)
Median house or condo value ($ change since 2000)
Median house or condo value ($) - White
Median house or condo value ($) - Black or African American
Median house or condo value ($) - Asian
Median house or condo value ($) - Hispanic or Latino
Median house or condo value ($) - American Indian and Alaska Native
Median house or condo value ($) - Multirace
Median house or condo value ($) - Other Race
Median price asked for mobile homes ($)
Household density (households per square mile)
Mean house or condo value by units in structure - 1, detached ($)
Mean house or condo value by units in structure - 1, attached ($)
Mean house or condo value by units in structure - 2 ($)
Mean house or condo value by units in structure by units in structure - 3 or 4 ($)
Mean house or condo value by units in structure - 5 or more ($)
Mean house or condo value by units in structure - Boat, RV, van, etc. ($)
Mean house or condo value by units in structure - Mobile home ($)
Median contract rent ($)
Median contract rent - Lower quartile ($)
Median contract rent - Upper quartile ($)
Median gross rent ($)
Urban houses (%)
Rural houses (%)
Houses occupied (%)
Houses occupied (% change since 2000)
Houses owner occupied (%)
Houses owner occupied (% change since 2000)
Houses renter occupied (%)
Houses renter occupied (% change since 2000)
Vacant housing units - For rent (%)
Vacant housing units - For rent (% change since 2000)
Vacant housing units - For sale only (%)
Vacant housing units - For sale only (% change since 2000)
Vacant housing units - Rented or sold, not occupied (%)
Vacant housing units - Rented or sold, not occupied (% change since 2000)
Vacant housing units - For seasonal, recreational, or occasional use (%)
Vacant housing units - For seasonal, recreational, or occasional use (% change since 2000)
Vacant housing units - For migrant workers (%)
Vacant housing units - For migrant workers (% change since 2000)
Vacant housing units - Other vacant (%)
Vacant housing units - Other vacant (% change since 2000)
Median monthly housing costs ($)
Median household income for houses/condos with a mortgage ($)
Median household income for houses/condos without a mortgage ($)
Median household income ($)
Median household income ($) - White
Median household income ($) - Black or African American
Median household income ($) - Asian
Median household income ($) - Hispanic or Latino
Median household income ($) - American Indian and Alaska Native
Median household income ($) - Multirace
Median household income ($) - Other Race
Mortgage status - with mortgage (%)
Mortgage status - with second mortgage (%)
Mortgage status - with home equity loan (%)
Mortgage status - with both second mortgage and home equity loan (%)
Mortgage status - without a mortgage (%)
Median year house/condo built
Median year apartment built
Household type by relationship - Male householder living alone (%)
Household type by relationship - Male householder not living alone (%)
Household type by relationship - Female householder living alone (%)
Household type by relationship - Female householder not living alone (%)
Household type by relationship - Opposite-Sex spouse (%)
Household type by relationship - Same-Sex spouse (%)
Household type by relationship - Opposite-Sex unmarried partner (%)
Household type by relationship - Same-Sex unmarried partner (%)
Household type by relationship - In group quarters (%)
Size of family households - 2-person household (%)
Size of family households - 3-person household (%)
Size of family households - 4-person household (%)
Size of family households - 5-person household (%)
Size of family households - 6-person household (%)
Size of family households - 7-or-more-person household (%)
Size of nonfamily households - 1-person household (%)
Size of nonfamily households - 2-person household (%)
Size of nonfamily households - 3-person household (%)
Size of nonfamily households - 4-person household (%)
Size of nonfamily households - 5-person household (%)
Size of nonfamily households - 6-person household (%)
Size of nonfamily households - 7-or-moreperson household (%)
Year house built - Built 2010 or later (%)
Year house built - Built 2000 to 2009 (%)
Year house built - Built 1990 to 1999 (%)
Year house built - Built 1980 to 1989 (%)
Year house built - Built 1970 to 1979 (%)
Year house built - Built 1960 to 1969 (%)
Year house built - Built 1950 to 1959 (%)
Year house built - Built 1940 to 1949 (%)
Year house built - Built 1939 or earlier (%)
Median number of rooms in houses and condos
Median number of rooms in apartments
Median number of bedrooms in owner occupied houses
Mean number of bedrooms in owner occupied houses
Median number of bedrooms in renter occupied houses
Mean number of bedrooms in renter occupied houses
Median number of vehichles in owner occupied houses
Mean number of vehichles in owner occupied houses
Median number of vehichles in renter occupied houses
Mean number of vehichles in renter occupied houses
Rooms in owner-occupied houses - 1 room (%)
Rooms in owner-occupied houses - 2 rooms (%)
Rooms in owner-occupied houses - 3 rooms (%)
Rooms in owner-occupied houses - 4 rooms (%)
Rooms in owner-occupied houses - 5 rooms (%)
Rooms in owner-occupied houses - 6 rooms (%)
Rooms in owner-occupied houses - 7 rooms (%)
Rooms in owner-occupied houses - 8 rooms (%)
Rooms in owner-occupied houses - 9+ rooms (%)
Rooms in renter-occupied houses - 1 room (%)
Rooms in renter-occupied houses - 2 rooms (%)
Rooms in renter-occupied houses - 3 rooms (%)
Rooms in renter-occupied houses - 4 rooms (%)
Rooms in renter-occupied houses - 5 rooms (%)
Rooms in renter-occupied houses - 6 rooms (%)
Rooms in renter-occupied houses - 7 rooms (%)
Rooms in renter-occupied houses - 8 rooms (%)
Rooms in renter-occupied houses - 9+ rooms (%)
Bedrooms in owner-occupied houses - no bedrooms (%)
Bedrooms in owner-occupied houses - 1 bedroom (%)
Bedrooms in owner-occupied houses - 2 bedrooms (%)
Bedrooms in owner-occupied houses - 3 bedrooms (%)
Bedrooms in owner-occupied houses - 4 bedrooms (%)
Bedrooms in owner-occupied houses - 5+ bedrooms (%)
Bedrooms in renter-occupied houses - no bedrooms (%)
Bedrooms in renter-occupied houses - 1 bedroom (%)
Bedrooms in renter-occupied houses - 2 bedrooms (%)
Bedrooms in renter-occupied houses - 3 bedrooms (%)
Bedrooms in renter-occupied houses - 4 bedrooms (%)
Bedrooms in renter-occupied houses - 5+ bedrooms (%)
Vehicles available in owner-occupied houses - no vehicle available (%)
Vehicles available in owner-occupied houses - 1 vehicle available(%)
Vehicles available in owner-occupied houses - 2 Vehicles available (%)
Vehicles available in owner-occupied houses - 3 Vehicles available (%)
Vehicles available in owner-occupied houses - 4 Vehicles available (%)
Vehicles available in owner-occupied houses - 5+ Vehicles available (%)
Vehicles available in renter-occupied houses - no vehicle available (%)
Vehicles available in renter-occupied houses - 1 vehicle available (%)
Vehicles available in renter-occupied houses - 2 Vehicles available (%)
Vehicles available in renter-occupied houses - 3 Vehicles available (%)
Vehicles available in renter-occupied houses - 4 Vehicles available (%)
Vehicles available in renter-occupied houses - 5+ Vehicles available (%)
Housing units in structures - 1, detached (%)
Housing units in structures - 1, attached (%)
Housing units in structures - 2 (%)
Housing units in structures - 3 or 4 (%)
Housing units in structures - 5 to 9 (%)
Housing units in structures - 10 to 19 (%)
Housing units in structures - 20 to 49 (%)
Housing units in structures - 50 or more (%)
Housing units in structures - Mobile home (%)
Housing units in structures - Boat, RV, van, etc. (%)
Housing units in structures - Owners - 1, detached (%)
Housing units in structures - Owners - 1, attached (%)
Housing units in structures - Owners - 2 (%)
Housing units in structures - Owners - 3 or 4 (%)
Housing units in structures - Owners - 5 to 9 (%)
Housing units in structures - Owners - 10 to 19 (%)
Housing units in structures - Owners - 20 to 49 (%)
Housing units in structures - Owners - 50 or more (%)
Housing units in structures - Owners - Mobile home (%)
Housing units in structures - Owners - Boat, RV, van, etc. (%)
Housing units in structures - Renters - 1, detached (%)
Housing units in structures - Renters - 1, attached (%)
Housing units in structures - Renters - 2 (%)
Housing units in structures - Renters - 3 or 4 (%)
Housing units in structures - Renters - 5 to 9 (%)
Housing units in structures - Renters - 10 to 19 (%)
Housing units in structures - Renters - 20 to 49 (%)
Housing units in structures - Renters - 50 or more (%)
Housing units in structures - Renters - Mobile home (%)
Housing units in structures - Renters - Boat, RV, van, etc. (%)
House/condo owner moved in on average (years ago)
Renter moved in on average (years ago)
Year householder moved into unit - Moved in 1999 to March 2000 (%)
Year householder moved into unit - Moved in 1999 to March 2000 (%) - White
Year householder moved into unit - Moved in 1999 to March 2000 (%) - Black or African American
Year householder moved into unit - Moved in 1999 to March 2000 (%) - Asian
Year householder moved into unit - Moved in 1999 to March 2000 (%) - Hispanic or Latino
Year householder moved into unit - Moved in 1999 to March 2000 (%) - American Indian and Alaska Native
Year householder moved into unit - Moved in 1999 to March 2000 (%) - Multirace
Year householder moved into unit - Moved in 1999 to March 2000 (%) - Other Race
Year householder moved into unit - Moved in 1995 to 1998 (%)
Year householder moved into unit - Moved in 1995 to 1998 (%) - White
Year householder moved into unit - Moved in 1995 to 1998 (%) - Black or African American
Year householder moved into unit - Moved in 1995 to 1998 (%) - Asian
Year householder moved into unit - Moved in 1995 to 1998 (%) - Hispanic or Latino
Year householder moved into unit - Moved in 1995 to 1998 (%) - American Indian and Alaska Native
Year householder moved into unit - Moved in 1995 to 1998 (%) - Multirace
Year householder moved into unit - Moved in 1995 to 1998 (%) - Other Race
Year householder moved into unit - Moved in 1990 to 1994 (%)
Year householder moved into unit - Moved in 1990 to 1994 (%) - White
Year householder moved into unit - Moved in 1990 to 1994 (%) - Black or African American
Year householder moved into unit - Moved in 1990 to 1994 (%) - Asian
Year householder moved into unit - Moved in 1990 to 1994 (%) - Hispanic or Latino
Year householder moved into unit - Moved in 1990 to 1994 (%) - American Indian and Alaska Native
Year householder moved into unit - Moved in 1990 to 1994 (%) - Multirace
Year householder moved into unit - Moved in 1990 to 1994 (%) - Other Race
Year householder moved into unit - Moved in 1980 to 1989 (%)
Year householder moved into unit - Moved in 1980 to 1989 (%) - White
Year householder moved into unit - Moved in 1980 to 1989 (%) - Black or African American
Year householder moved into unit - Moved in 1980 to 1989 (%) - Asian
Year householder moved into unit - Moved in 1980 to 1989 (%) - Hispanic or Latino
Year householder moved into unit - Moved in 1980 to 1989 (%) - American Indian and Alaska Native
Year householder moved into unit - Moved in 1980 to 1989 (%) - Multirace
Year householder moved into unit - Moved in 1980 to 1989 (%) - Other Race
Year householder moved into unit - Moved in 1970 to 1979 (%)
Year householder moved into unit - Moved in 1970 to 1979 (%) - White
Year householder moved into unit - Moved in 1970 to 1979 (%) - Black or African American
Year householder moved into unit - Moved in 1970 to 1979 (%) - Asian
Year householder moved into unit - Moved in 1970 to 1979 (%) - Hispanic or Latino
Year householder moved into unit - Moved in 1970 to 1979 (%) - American Indian and Alaska Native
Year householder moved into unit - Moved in 1970 to 1979 (%) - Multirace
Year householder moved into unit - Moved in 1970 to 1979 (%) - Other Race
Year householder moved into unit - Moved in 1969 or earlier (%)
Year householder moved into unit - Moved in 1969 or earlier (%) - White
Year householder moved into unit - Moved in 1969 or earlier (%) - Black or African American
Year householder moved into unit - Moved in 1969 or earlier (%) - Asian
Year householder moved into unit - Moved in 1969 or earlier (%) - Hispanic or Latino
Year householder moved into unit - Moved in 1969 or earlier (%) - American Indian and Alaska Native
Year householder moved into unit - Moved in 1969 or earlier (%) - Multirace
Year householder moved into unit - Moved in 1969 or earlier (%) - Other Race
Housing units lacking complete plumbing facilities (%)
Housing units lacking complete kitchen facilities (%)
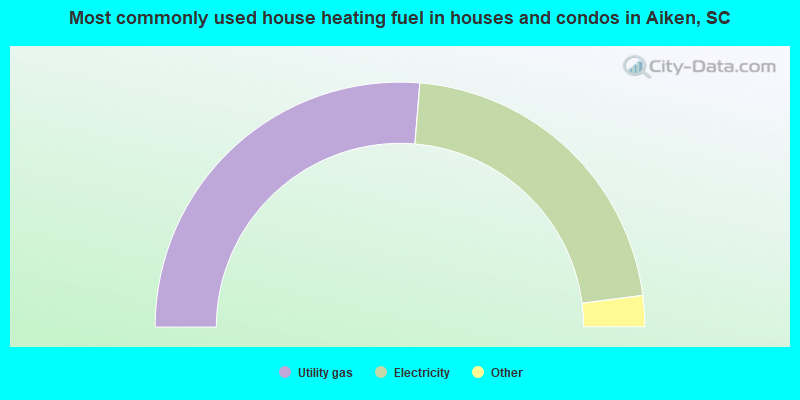
House heating fuel used in houses and condos - Utility gas (%)
House heating fuel used in houses and condos - Bottled, tank, or LP gas (%)
House heating fuel used in houses and condos - Electricity (%)
House heating fuel used in houses and condos - Fuel oil, kerosene, etc. (%)
House heating fuel used in houses and condos - Coal or coke (%)
House heating fuel used in houses and condos - Wood (%)
House heating fuel used in houses and condos - Solar energy (%)
House heating fuel used in houses and condos - Other fuel (%)
House heating fuel used in houses and condos - No fuel used (%)
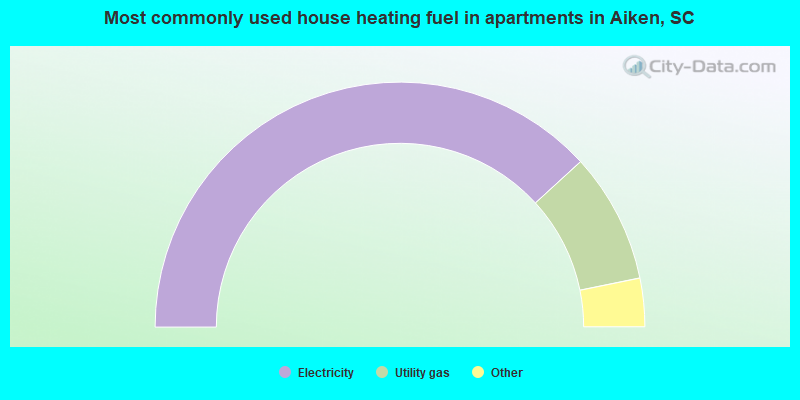
House heating fuel used in apartments - Utility gas (%)
House heating fuel used in apartments - Bottled, tank, or LP gas (%)
House heating fuel used in apartments - Electricity (%)
House heating fuel used in apartments - Fuel oil, kerosene, etc. (%)
House heating fuel used in apartments - Coal or coke (%)
House heating fuel used in apartments - Wood (%)
House heating fuel used in apartments - Solar energy (%)
House heating fuel used in apartments - Other fuel (%)
House heating fuel used in apartments - No fuel used (%)
Latest news about housing in Aiken, SC collected exclusively by city-data.com from local newspapers, TV, and radio stations
Median year house/condo built: 1989Median year apartment built: 1986Household type by relationship:
Households: 32,821
Male householders: 6,561 (1,880 living alone ), Female householders: 6,718 (2,683 living alone )6,021 spouses (5,934 opposite-sex spouses ), 778 unmarried partners , (757 opposite-sex unmarried partners ), 7,842 children (7,463 natural , 228 adopted , 150 stepchildren ), 1,273 grandchildren , 265 brothers or sisters , 419 parents , 0 foster children , 411 other relatives , 840 non-relatives In group quarters: 1,689
Size of family households: 4,291 2-persons , 1,682 3-persons , 1,196 4-persons , 681 5-persons , 163 6-persons , 44 7-or-more-persons .
Size of nonfamily households: 4,465 1-person , 782 2-persons , 36 3-persons , 71 4-persons , 15 7-or-more-persons .
2,347 married couples with children. single-parent households (545 men , 1,721 women ).
95.4% of residents of Aiken speak English at home. of residents speak Spanish at home (87% speak English very well , 5% speak English well , 8% speak English not well ).of residents speak other Indo-European language at home (79% speak English very well , 18% speak English well , 4% speak English not well ).of residents speak Asian or Pacific Island language at home (58% speak English very well , 33% speak English well , 9% speak English not well ).of residents speak other language at home (54% speak English very well , 46% speak English well ).
Foreign born population: 1,092 (3.3%)of them are naturalized citizens )
Median number of rooms in houses and condos:
Median number of rooms in apartments
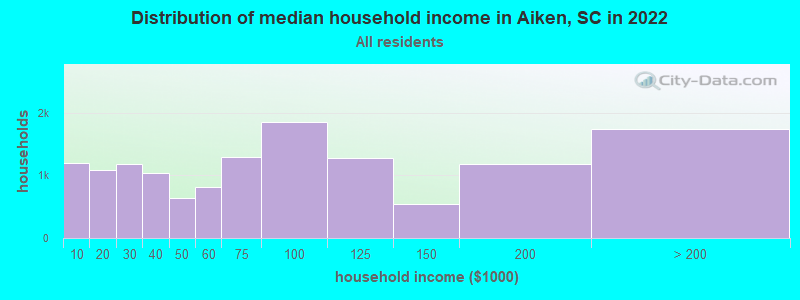
Aiken, SC household income distribution 1,193 Less than $10,0001,090 $10,000 to $19,9991,175 $20,000 to $29,9991,038 $30,000 to $39,999638 $40,000 to $49,999812 $50,000 to $59,9991,286 $60,000 to $74,9991,849 $75,000 to $99,9991,273 $100,000 to $124,999537 $125,000 to $149,9991,186 $150,000 to $199,9991,734 $200,000 or more
Home value of owner - occupied houses in 2022 in Aiken, SC 80 Less than $10,0006 $15,000 to $19,99916 $25,000 to $29,99950 $30,000 to $34,99919 $35,000 to $39,99964 $40,000 to $49,999115 $50,000 to $59,999119 $60,000 to $69,999219 $70,000 to $79,999156 $80,000 to $89,999259 $90,000 to $99,999369 $100,000 to $124,999403 $125,000 to $149,999803 $150,000 to $174,999728 $175,000 to $199,999922 $200,000 to $249,9991,182 $250,000 to $299,9992,021 $300,000 to $399,999893 $400,000 to $499,9991,173 $500,000 to $749,999374 $750,000 to $999,999112 $1,000,000 to $1,499,99926 $1,500,000 to $1,999,99970 $2,000,000 or moreRent paid by renters in 2022 in Aiken, SC 57 Less than $10075 $100 to $149137 $150 to $19914 $200 to $24913 $250 to $299132 $300 to $349111 $350 to $399251 $400 to $44967 $450 to $49944 $500 to $54951 $550 to $599136 $600 to $649107 $650 to $69965 $700 to $749347 $750 to $799230 $800 to $899780 $900 to $999697 $1,000 to $1,249574 $1,250 to $1,49944 $1,500 to $1,99976 $2,000 to $2,49926 $2,500 to $2,99925 $3,000 to $3,49944 $3,500 or more128 No cash rent
Percentage of workers working in this county: 76.5%Number of people working at home: 1,698 (11.5% of all workers )
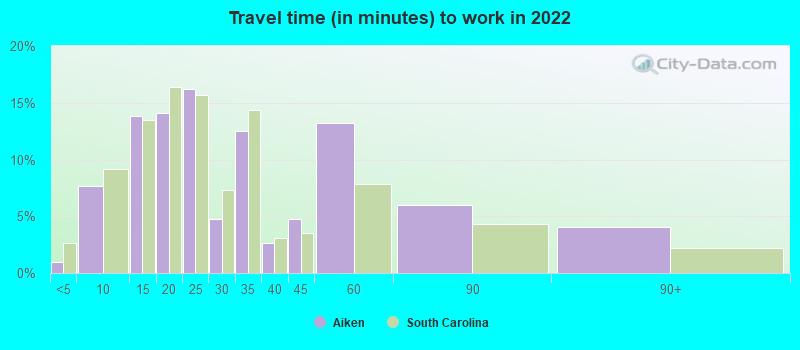
Travel time to work (commute)
Less than 5 minutes: 3655 to 9 minutes: 1,45810 to 14 minutes: 2,03315 to 19 minutes: 2,21320 to 24 minutes: 1,44525 to 29 minutes: 84330 to 34 minutes: 1,21435 to 39 minutes: 54840 to 44 minutes: 63845 to 59 minutes: 1,31460 to 89 minutes: 36090 or more minutes: 213
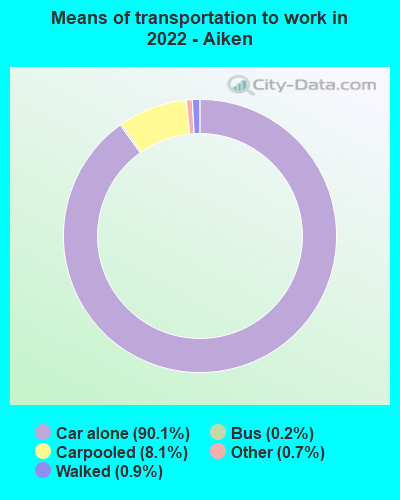
Means of transportation to work:
Drove a car alone: 25,051 (83.1%)Carpooled: 2,351 (7.8%)Bus : 57 (0.2%)Taxi: 214 (0.7%)Bicycle: 9 (0.0%)Walked: 241 (0.8%)Worked at home: 1,698 (5.6%)
Unemployment by race in 2022
Unemployment rate for White non-Hispanic residents 1.2% Males2.4% FemalesUnemployment rate for Black residents 5.8% Males0.6% FemalesUnemployment rate for Asian residents 6.0% MalesUnemployment rate for two or more race residents 8.4% Males30.5% FemalesUnemployment rate for Hispanic or Latino residents 13.7% Males
Year of entry for the foreign-born population in Aiken, South Carolina
651 2010 or later 178 2000 to 2009 116 1990 to 1999 145 1980 to 1989 85 1970 to 1979 94 Before 1970
First ancestries reported:
American: 5,485 (29.0%)
English: 1,833 (9.7%)
Irish: 1,107 (5.9%)
German: 1,009 (5.3%)
Scottish: 680 (3.6%)
African: 676 (3.6%)
Scotch-Irish: 429 (2.3%)
Italian: 374 (2.0%)
Dutch: 267 (1.4%)
French: 265 (1.4%)
European: 225 (1.2%)
Jamaican: 175 (0.9%)
Welsh: 169 (0.9%)
Albanian: 145 (0.8%)
Polish: 133 (0.7%)
Croatian: 117 (0.6%)
Cajun: 70 (0.4%)
Greek: 54 (0.3%)
Russian: 54 (0.3%)
Slovak: 45 (0.2%)
Bahamian: 43 (0.2%)
Hungarian: 40 (0.2%)
Slavic: 39 (0.2%)
Austrian: 35 (0.2%)
Canadian: 30 (0.2%)
Guyanese: 26 (0.1%)
Norwegian: 25 (0.1%)
Eastern European: 23 (0.1%)
Northern European: 23 (0.1%)
Portuguese: 19 (0.1%)
Iranian: 19 (0.1%)
Scandinavian: 17 (0.09%)
British: 16 (0.08%)
Serbian: 16 (0.08%)
Pennsylvania German: 15 (0.08%)
Israeli: 14 (0.07%)
Czech: 13 (0.07%)
Swiss: 9 (0.05%)
Egyptian: 7 (0.04%)
French Canadian: 7 (0.04%)
Swedish: 6 (0.03%)
Basque: 1 (0.01%) Most common places of birth for foreign-born residents (%): Philippines Aiken:
14.1% (193)South Carolina:
4.1% (11,031)
Jamaica Aiken:
11.0% (150)South Carolina:
2.6% (7,073)
Canada Aiken:
9.0% (123)South Carolina:
3.0% (8,193)
Cameroon Aiken:
8.8% (121)South Carolina:
0.1% (386)
Japan Aiken:
7.7% (105)South Carolina:
0.8% (2,055)
China, excluding Hong Kong and Taiwan Aiken:
5.8% (80)South Carolina:
3.2% (8,721)
Netherlands Aiken:
5.8% (79)South Carolina:
0.3% (727)
Greece Aiken:
5.6% (77)South Carolina:
0.5% (1,296)
Germany Aiken:
5.5% (75)South Carolina:
3.7% (9,982)
Iran Aiken:
4.2% (58)South Carolina:
0.5% (1,270)
Russia Aiken:
2.7% (37)South Carolina:
1.3% (3,522)
India Aiken:
2.2% (30)South Carolina:
6.8% (18,307)
Guyana Aiken:
2.0% (27)South Carolina:
0.2% (598)
Serbia Aiken:
1.8% (24)South Carolina:
0.1% (136)
Honduras Aiken:
1.8% (24)South Carolina:
4.8% (12,834)
Korea Aiken:
1.5% (21)South Carolina:
1.7% (4,513)
Vietnam Aiken:
1.5% (21)South Carolina:
2.3% (6,308)
Place of birth for U.S.-born residents:
This state: 11,966Other state: 19,056Northeast: 4,181Midwest: 3,434South: 10,521West: 791 85.3% of Aiken residents lived in the same house 1 years ago.
Out of people who lived in different houses, 26.8% lived in this county.
Out of people who lived in different counties, 31.2% lived in South Carolina.
Aiken:
85.3%State average:
86.5%
Education attainment for males 25 years and older:
No schooling: 94Nursery to 4th grade: 225th and 6th grade: 547th and 8th grade: 189th grade: 17910th grade: 21811th grade: 3612th grade, no diploma: 400High school graduate (or equivalency): 2,745Less than 1 year of college: 446Some college more than 1 year, no degree: 1,073Associate degree: 610Bachelor's degree: 3,101Master's degree: 1,151Professional school degree: 229Doctorate degree: 449
Education attainment for females 25 years and older:
No schooling: 65Nursery to 4th grade: 455th and 6th grade: 907th and 8th grade: 1809th grade: 9310th grade: 11811th grade: 20612th grade, no diploma: 105High school graduate (or equivalency): 2,599Less than 1 year of college: 785Some college more than 1 year, no degree: 2,032Associate degree: 1,190Bachelor's degree: 3,731Master's degree: 1,707Professional school degree: 174Doctorate degree: 322
Housing units in structures:
One, detached: 11,169One, attached: 776Two: 8053 or 4: 8005 to 9: 89110 to 19: 7120 to 49: 20250 or more: 339Mobile homes: 87Median worth of mobile homes: $87,467
Housing units lacking complete plumbing facilities in 2022: 3.1%Housing units lacking complete kitchen facilities in 2022: 3.9%House/condo owner moved in on average 9 years ago
Renter moved in on average 2 years ago
Private vs. public school enrollment:
Students in private schools in grades 1 to 8 (elementary and middle school): 579 Here:
19.4%South Carolina:
14.4%
Students in private schools in grades 9 to 12 (high school): 87 Here:
8.3%South Carolina:
11.1%
Students in private undergraduate colleges: 747 Here:
24.9%South Carolina:
21.9%