Yuma: Fire Incidents, Arizona (AZ)
Where are fire incidents reported in Yuma, AZ
Something went wrong! Please refresh the page.
| Fire incidents reported | |
|---|---|
| Sreet name | Count |
| 4 AVE | 334 |
| 32 ST | 300 |
| 24 ST | 258 |
| 16 ST | 250 |
| AVENUE A | 222 |
| AVENUE B | 212 |
| 8 AVE | 128 |
| 8 ST | 122 |
| 4TH AVE | 120 |
| MADISON AVE | 118 |
| 1 AVE | 108 |
| 20 ST | 104 |
| ARIZONA AVE | 104 |
| 32ND ST | 102 |
| 5 AVE | 96 |
| 7 AVE | 94 |
| 6 AVE | 90 |
| 9 AVE | 90 |
| 12 ST | 88 |
| WINTERHAVEN | 84 |
| 10 AVE | 80 |
| AVENUE 3 E | 80 |
| PACIFIC AVE | 80 |
| 1 ST | 78 |
| 16TH ST | 78 |
| 3 ST | 78 |
| MAGNOLIA AVE | 78 |
| 17 AVE | 68 |
| B | 68 |
| MAPLE AVE | 68 |
| Other | 785 |
2003 - 2018 National Fire Incident Reporting System (NFIRS) incidents
- Incident types reported to NFIRS in Yuma, AZ
- 51,87873.5%Rescue & EMS
- 5,5897.9%Good Intent Call
- 4,5656.5%Fire
- 3,0464.3%False Alarm
- 2,9684.2%Hazardous Condition
- 2,3633.4%Service Call
- Fire incident types reported to NFIRS in Yuma, AZ
- 2,10646.1%Outside Fires
- 1,18826.0%Structure Fires
- 1,04622.9%Mobile Property/Vehicle Fires
- 2254.9%Other
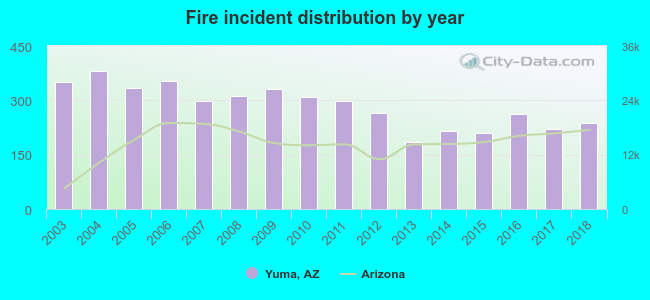 Based on the data from the years 2003 - 2018 the average number of fires per year is 285. The highest number of reported fires - 382 took place in 2004, and the least - 186 in 2013. The data has a dropping trend.
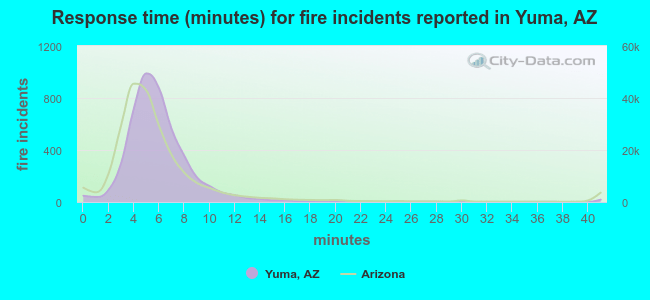 The median response time based on all reported fire incidents is 6 minutes. This is comparable to the Arizona median value.
The median response time in Yuma, AZ compared to nearest cities:
(Note: Based on data for all years, including only cities with at least 500 fire incidents)
| Yuma: | 6 minutes |
| Tonopah: | 11 minutes |
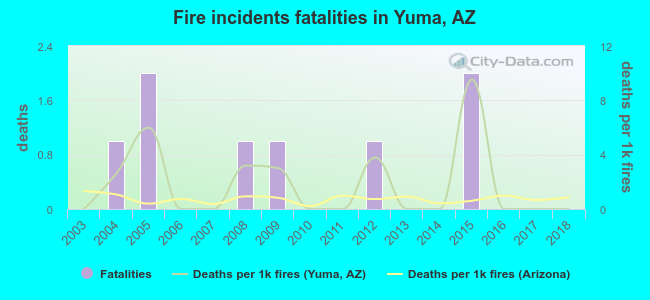 Based on the data from the years 2003 - 2018 the average number of fire-related fatalities per year is 1. The highest number of deaths - 2 took place in 2005, and the lowest - 0 in 2003. The data has a constant trend.
The average number of fatalities per 1,000 fire incidents is 2. This indicator was the highest - 10 in 2015, and the lowest 0 in 2003. The trend for deaths per 1,000 fires is constant. Compared to the state value the number of deaths per 1,000 fires is much higher.
Based on the data from the years 2003 - 2018 the average number of fire-related fatalities per year is 1. The highest number of deaths - 2 took place in 2005, and the lowest - 0 in 2003. The data has a constant trend.
The average number of fatalities per 1,000 fire incidents is 2. This indicator was the highest - 10 in 2015, and the lowest 0 in 2003. The trend for deaths per 1,000 fires is constant. Compared to the state value the number of deaths per 1,000 fires is much higher.Deaths per 1,000 incidents in Yuma, AZ compared to nearest cities:
(Note: Based on data for all years, including only cities with at least 2,500 fire incidents)
| Yuma: | 1.8 |
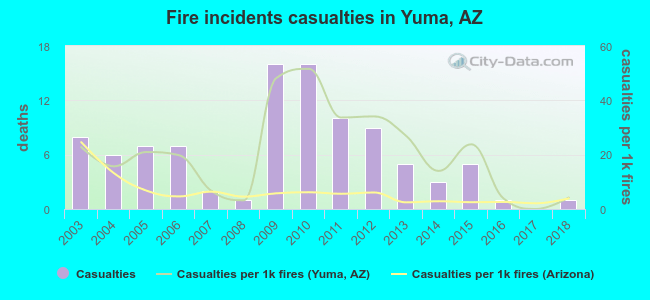 According to the reports from the years 2003 - 2018 the average number of fire-related casualties per year is 6. The highest number of injuries - 16 took place in 2009, and the lowest - 0 in 2017. The data has a declining trend.
The average number of casualties per 1,000 fires is 21. This indicator was the highest - 52 in 2010, and the lowest 0 in 2017. The trend for casualties per 1,000 incidents is decreasing. Compared to the state value the number of casualties per 1,000 fires is much higher.
According to the reports from the years 2003 - 2018 the average number of fire-related casualties per year is 6. The highest number of injuries - 16 took place in 2009, and the lowest - 0 in 2017. The data has a declining trend.
The average number of casualties per 1,000 fires is 21. This indicator was the highest - 52 in 2010, and the lowest 0 in 2017. The trend for casualties per 1,000 incidents is decreasing. Compared to the state value the number of casualties per 1,000 fires is much higher.Casualties per 1,000 incidents in Yuma, AZ compared to nearest cities:
(Note: Based on data for all years, including only cities with at least 500 fire incidents)
| Yuma: | 21.2 |
| Tonopah: | 1.3 |
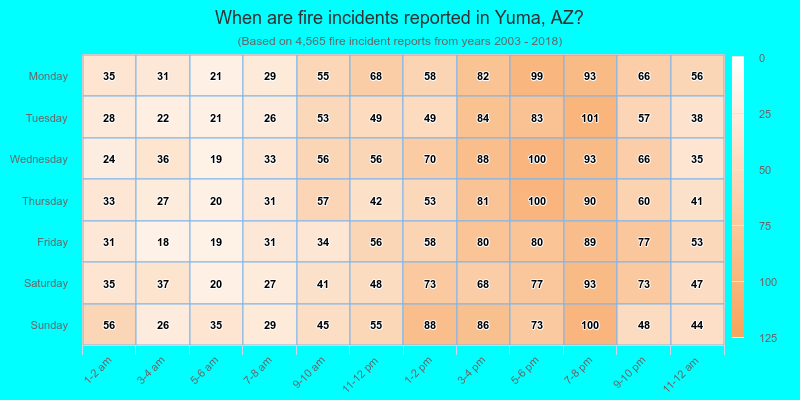
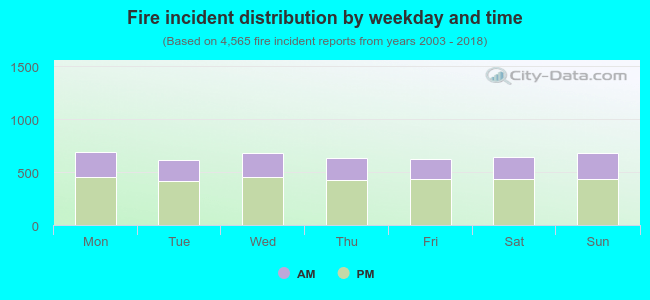 33.2% incidents where reported in the morning and 66.8% in the evening. The most fires (15.2%) took place on Monday, and the least (13.4%) on Tuesday.
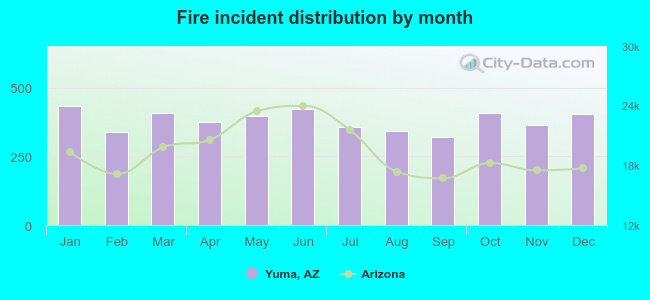 Based on the 4,565 fire incident reports from years 2003 - 2018 most fires (9.5%) took place during January, and the least (7.0%) in September.
 Out of all 70,537 cases reported during the years 2003 - 2018, the most belonged to the categories: Rescue & EMS (73.5%), Good Intent Call (7.9%), and Fire (6.5%).
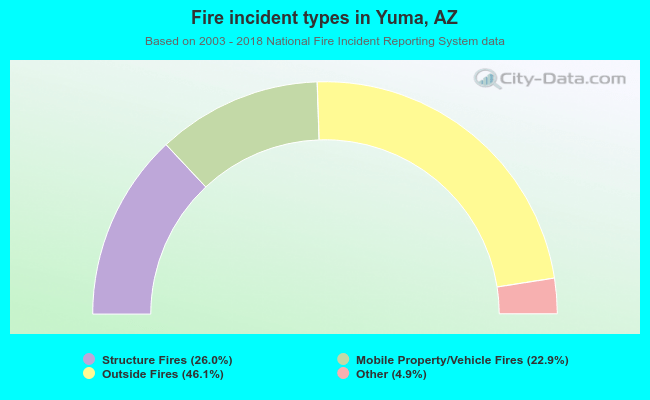 When looking into fire subcategories, the most reports belonged to: Outside Fires (46.1%), and Structure Fires (26.0%).