Yorktown: Fire Incidents, Indiana (IN)
Where are fire incidents reported in Yorktown, IN
Something went wrong! Please refresh the page.
|
| |||||||||||||||||||||||||||||||||||||||||||||||||||||||||||||||||||||||||||||||||||||||||||||||||||||||||||||
| Other | 44 | |||||||||||||||||||||||||||||||||||||||||||||||||||||||||||||||||||||||||||||||||||||||||||||||||||||||||||||
2002 - 2018 National Fire Incident Reporting System (NFIRS) incidents
- Incident types reported to NFIRS in Yorktown, IN
- 1,58241.3%Rescue & EMS
- 96225.1%Fire
- 66517.4%Hazardous Condition
- 1824.8%Good Intent Call
- 1734.5%Service Call
- 1664.3%False Alarm
- 802.1%Special Incident
- 140.4%Severe Weather
- 50.1%Overpressure Rupture
- Fire incident types reported to NFIRS in Yorktown, IN
- 40742.3%Structure Fires
- 35637.0%Outside Fires
- 12613.1%Mobile Property/Vehicle Fires
- 737.6%Other
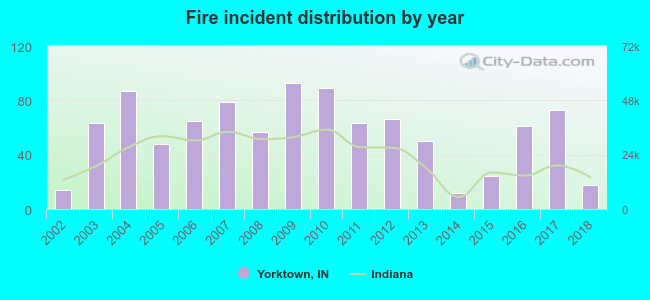 According to the data from the years 2002 - 2018 the average number of fires per year is 57. The highest number of reported fires - 93 took place in 2009, and the least - 12 in 2014. The data has a growing trend.
The average number of yearly fire incidents per 10k residents in Yorktown, IN compared to nearest cities:
(Note: Based on data for the last 3 years, including only cities with population 5,000 and above)
| Yorktown: | 45.2 |
| Muncie: | 25.5 |
| Anderson: | 8.4 |
| Alexandria: | 16.4 |
| New Castle: | 30.4 |
| Elwood: | 24.8 |
| Hartford City: | 21.5 |
| Gas City: | 58.0 |
| Marion: | 53.6 |
 The median response time based on all reported fire incidents is 9 minutes. This is higher than the state median value.
The median response time in Yorktown, IN compared to nearest cities:
(Note: Based on data for all years, including only cities with at least 500 fire incidents)
| Yorktown: | 9 minutes |
| Muncie: | 5 minutes |
| Daleville: | 8 minutes |
| Chesterfield: | 8 minutes |
| Middletown: | 6 minutes |
| Gaston: | 8 minutes |
| Anderson: | 7 minutes |
| Alexandria: | 5 minutes |
| Pendleton: | 8 minutes |
 28.9% incidents where reported in the morning and 71.1% in the evening. The most fires (15.9%) took place on Saturday, and the least (12.7%) on Tuesday.
 According to the 962 fires from years 2002 - 2018 most fires (13.0%) took place during April, and the least (4.8%) in December.
 Out of all 3,829 cases reported during the years 2002 - 2018, the most belonged to the categories: Rescue & EMS (41.3%), Fire (25.1%), and Hazardous Condition (17.4%).
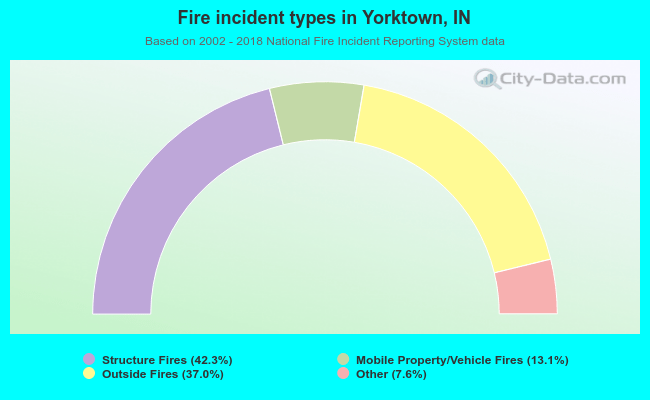 When looking into fire subcategories, the most reports belonged to: Structure Fires (42.3%), and Outside Fires (37.0%).