Yarmouth: Fire Incidents, Massachusetts (MA)
Where are fire incidents reported in Yarmouth, MA
Something went wrong! Please refresh the page.
|
| |||||||||||||||||||||||||||||||||||||||||||||||||||||||||||||||||||||||||||||||||||||||||||||||||||||||||||||
2002 - 2018 National Fire Incident Reporting System (NFIRS) incidents
- Incident types reported to NFIRS in Yarmouth, MA
- 20232.8%Hazardous Condition
- 18329.7%Rescue & EMS
- 10016.2%Fire
- 6811.0%Service Call
- 467.5%Good Intent Call
- 101.6%False Alarm
- 50.8%Special Incident
- 20.3%Severe Weather
- Fire incident types reported to NFIRS in Yarmouth, MA
- 4949.0%Structure Fires
- 3131.0%Outside Fires
- 1212.0%Mobile Property/Vehicle Fires
- 88.0%Other
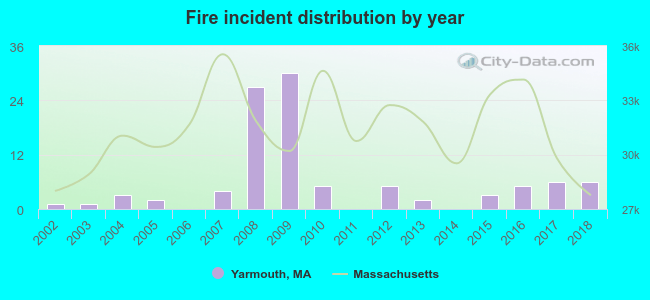 Based on the data from the years 2002 - 2018 the average number of fires per year is 6. The highest number of reported fires - 30 took place in 2009, and the least - 0 in 2006. The data has a growing trend.
The average number of yearly fire incidents per 10k residents in Yarmouth, MA compared to nearest cities:
(Note: Based on data for the last 3 years, including only cities with population 5,000 and above)
| Yarmouth: | 2.4 |
| South Yarmouth: | 34.9 |
| West Yarmouth: | 31.6 |
| Yarmouth Port: | 16.3 |
| Harwich: | 42.2 |
| Mashpee: | 34.7 |
| East Falmouth: | 53.5 |
| Wareham: | 46.6 |
| Nantucket: | 62.2 |
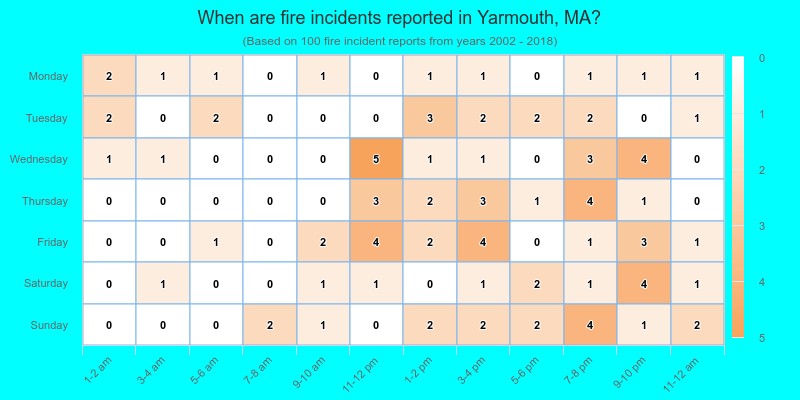
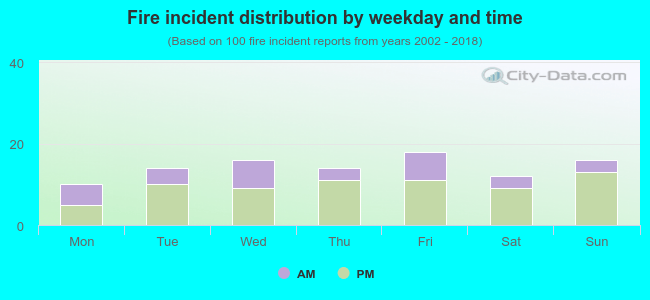 32.0% incidents where reported in the morning and 68.0% in the evening. The most fires (18.0%) took place on Friday, and the least (10.0%) on Monday.
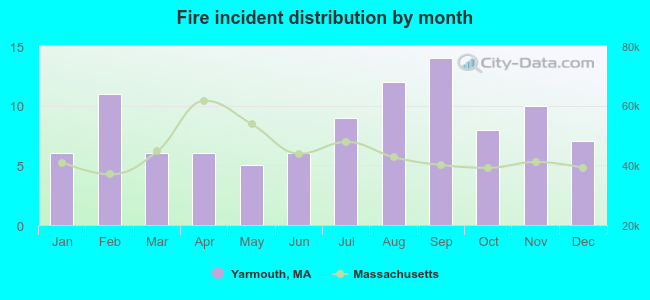 Based on the 100 incident reports from years 2002 - 2018 most fires (14.0%) took place during September, and the least (5.0%) in May.
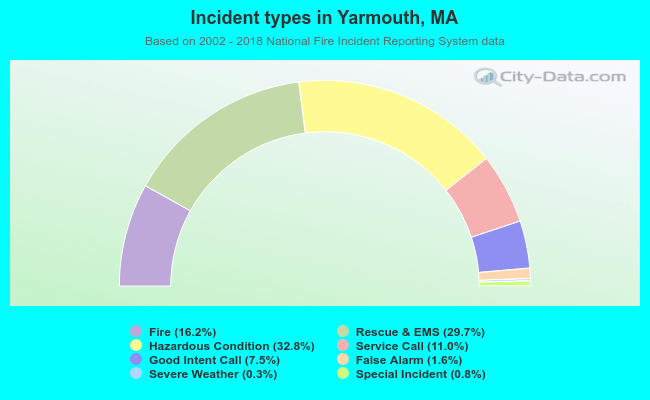 Out of all 616 cases reported during the years 2002 - 2018, the most belonged to the categories: Rescue & EMS (32.8%), Overpressure Rupture (29.7%), and Fire (16.2%).
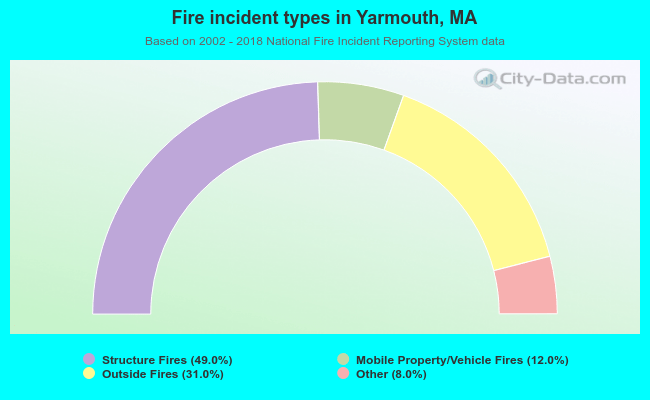 When looking into fire subcategories, the most reports belonged to: Structure Fires (49.0%), and Outside Fires (31.0%).