Woodstock: Fire Incidents, Connecticut (CT)
Where are fire incidents reported in Woodstock, CT
Something went wrong! Please refresh the page.
|
| |||||||||||||||||||||||||||||||||||||||||||||||||||||||||||||||||||||||||||||||||||||||||||||||||||||||||||||
2002 - 2018 National Fire Incident Reporting System (NFIRS) incidents
- Incident types reported to NFIRS in Woodstock, CT
- 1,29349.7%Rescue & EMS
- 46417.8%Fire
- 40115.4%Hazardous Condition
- 2449.4%Service Call
- 1455.6%False Alarm
- 391.5%Good Intent Call
- 60.2%Severe Weather
- 50.2%Overpressure Rupture
- 40.2%Special Incident
- Fire incident types reported to NFIRS in Woodstock, CT
- 25955.8%Structure Fires
- 13228.4%Outside Fires
- 469.9%Mobile Property/Vehicle Fires
- 275.8%Other
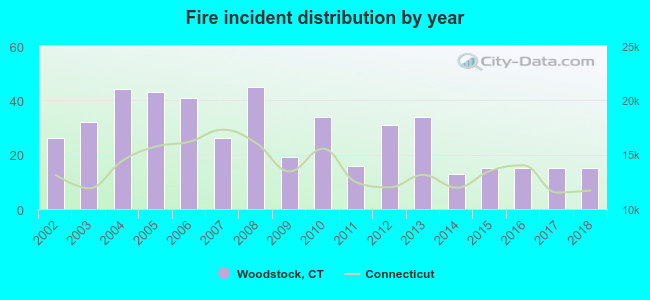 Based on the data from the years 2002 - 2018 the average number of fire incidents per year is 27. The highest number of fires - 45 took place in 2008, and the least - 13 in 2014. The data has a dropping trend.
The average number of yearly fire incidents per 10k residents in Woodstock, CT compared to nearest cities:
(Note: Based on data for the last 3 years, including only cities with population 5,000 and above)
| Woodstock: | 18.8 |
| Thompson: | 27.5 |
| Putnam: | 41.7 |
| Killingly: | 3.6 |
| Brooklyn: | 54.4 |
| Willington: | 14.3 |
| Stafford: | 10.2 |
| Storrs: | 26.1 |
| Mansfield: | 6.8 |

 According to the reports from the years 2002 - 2018 the average number of fire-related yearly casualties is 0. The highest number of reported casualties - 2 took place in 2018, and the lowest - 0 in 2002. The data has a growing trend.
 33.0% incidents where reported in the morning and 67.0% in the evening. The most fires (17.0%) took place on Friday, and the least (9.7%) on Thursday.
 Based on the 464 fire incidents from years 2002 - 2018 most fires (13.8%) took place during April, and the least (4.7%) in October.
 Out of all 2,601 cases reported during the years 2002 - 2018, the most belonged to the categories: Rescue & EMS (49.7%), Fire (17.8%), and Hazardous Condition (15.4%).
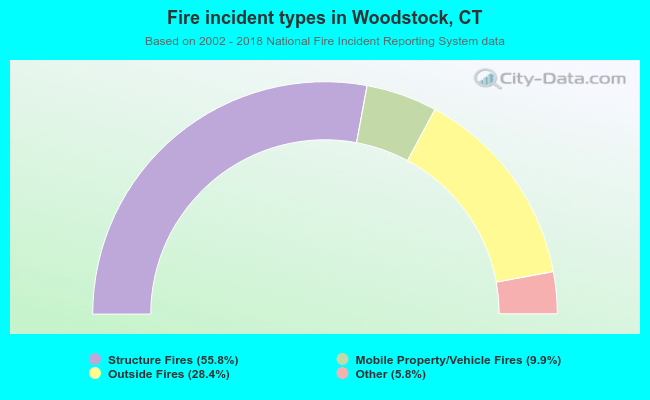 When looking into fire subcategories, the most reports belonged to: Structure Fires (55.8%), and Outside Fires (28.4%).