Williamsport: Fire Incidents, Pennsylvania (PA)
Where are fire incidents reported in Williamsport, PA
Something went wrong! Please refresh the page.
| Fire incidents reported | |
|---|---|
| Sreet name | Count |
| W FOURTH ST | 170 |
| MEMORIAL AVE | 92 |
| W THIRD ST | 72 |
| HEPBURN ST | 48 |
| HIGH ST | 48 |
| PARK AVE | 48 |
| WASHINGTON BLVD | 48 |
| SECOND ST | 42 |
| MARKET ST | 36 |
| E THIRD ST | 34 |
| DOVE ST | 32 |
| LYCOMING CREEK ROAD | 32 |
| VINE AVE | 32 |
| CAMPBELL ST | 28 |
| TRENTON AVE | 28 |
| LYCOMING CREEK RD | 26 |
| PINE ST | 26 |
| CENTER ST | 24 |
| LINN ST | 24 |
| MAYNARD ST | 24 |
| W EDWIN ST | 24 |
| ARCH ST | 22 |
| DIAMOND ST | 22 |
| ELMIRA ST | 22 |
| NORTHWAY RD | 22 |
| LLOYD ST | 20 |
| LYCOMING ST | 20 |
| RURAL AVE | 20 |
| EAST THIRD ST | 18 |
| HILLSIDE AVE | 18 |
| Other | 648 |
2005 - 2018 National Fire Incident Reporting System (NFIRS) incidents
- Incident types reported to NFIRS in Williamsport, PA
- 2,89129.1%Rescue & EMS
- 1,77017.8%Fire
- 1,50215.1%Service Call
- 1,44314.5%Hazardous Condition
- 1,26912.8%False Alarm
- 8098.2%Good Intent Call
- 1321.3%Severe Weather
- 981.0%Special Incident
- Fire incident types reported to NFIRS in Williamsport, PA
- 87149.2%Structure Fires
- 44725.3%Outside Fires
- 23113.1%Mobile Property/Vehicle Fires
- 22112.5%Other
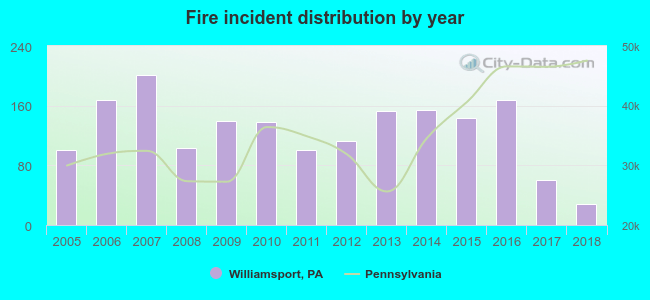 According to the data from the years 2005 - 2018 the average number of fire incidents per year is 126. The highest number of fires - 201 took place in 2007, and the least - 28 in 2018. The data has a dropping trend.
The average number of yearly fire incidents per 10k residents in Williamsport, PA compared to nearest cities:
(Note: Based on data for the last 3 years, including only cities with population 5,000 and above)
| Williamsport: | 29.2 |
| South Williamsport: | 14.2 |
| Milton: | 30.6 |
| Lewisburg: | 39.8 |
| Lock Haven: | 70.0 |
| Sunbury: | 34.9 |
| Selinsgrove: | 29.4 |
 The median response time based on all reported fire incidents is 5 minutes. This is lower compared to the Pennsylvania median value.
The median response time in Williamsport, PA compared to nearest cities:
(Note: Based on data for all years, including only cities with at least 500 fire incidents)
| Williamsport: | 5 minutes |
| Lock Haven: | 3 minutes |
 According to the data from the years 2005 - 2018 the average number of fire-related fatalities per year is 1. The highest number of deaths - 3 took place in 2007, and the lowest - 0 in 2005. The data has a constant trend.
 According to the data from the years 2005 - 2018 the average number of fire-related casualties per year is 4. The highest number of reported injuries - 12 took place in 2006, and the lowest - 0 in 2011. The data has a rising trend.
The average number of casualties per 1,000 fire incidents is 34. This indicator was the highest - 80 in 2012, and the lowest 0 in 2011. The trend for casualties per 1,000 fire incidents is increasing. Compared to the Pennsylvania value the number of injuries per 1,000 fires is much higher.
According to the data from the years 2005 - 2018 the average number of fire-related casualties per year is 4. The highest number of reported injuries - 12 took place in 2006, and the lowest - 0 in 2011. The data has a rising trend.
The average number of casualties per 1,000 fire incidents is 34. This indicator was the highest - 80 in 2012, and the lowest 0 in 2011. The trend for casualties per 1,000 fire incidents is increasing. Compared to the Pennsylvania value the number of injuries per 1,000 fires is much higher.Casualties per 1,000 incidents in Williamsport, PA compared to nearest cities:
(Note: Based on data for all years, including only cities with at least 500 fire incidents)
| Williamsport: | 32.8 |
| Lock Haven: | 3.0 |
 36.0% incidents where reported in the morning and 64.0% in the evening. The most fires (16.6%) took place on Sunday, and the least (12.4%) on Saturday.
 Based on the 1,770 fire incidents from years 2005 - 2018 most fires (13.7%) took place during April, and the least (5.3%) in December.
 Out of all 9,923 cases reported during the years 2005 - 2018, the most belonged to the categories: Rescue & EMS (29.1%), Fire (17.8%), and Service Call (15.1%).
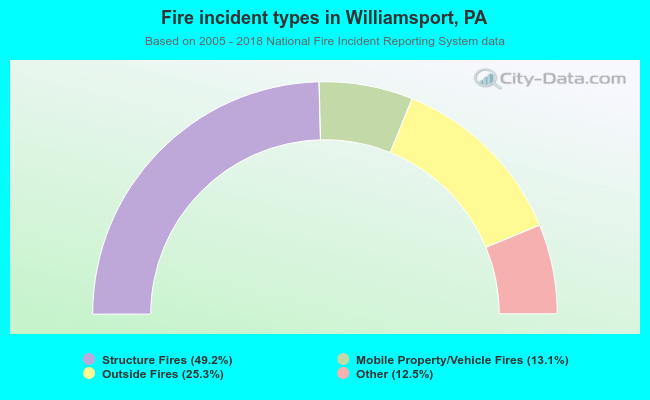 When looking into fire subcategories, the most incidents belonged to: Structure Fires (49.2%), and Outside Fires (25.3%).