Westerville: Fire Incidents, Ohio (OH)
Where are fire incidents reported in Westerville, OH
Something went wrong! Please refresh the page.
| Fire incidents reported | |
|---|---|
| Sreet name | Count |
| STATE ST | 170 |
| FANCHER RD | 110 |
| SUNBURY RD | 68 |
| HUBER VILLAGE BLVD | 64 |
| MAXTOWN RD | 56 |
| SCHROCK RD | 56 |
| CLEVELAND AVE | 44 |
| WESTERVILLE RD | 42 |
| FREEMAN RD | 38 |
| WORTHINGTON RD | 36 |
| HARLEM RD | 34 |
| MAIN ST | 32 |
| HOME ST | 30 |
| MOUNT ROYAL AVE | 26 |
| FROST RD | 24 |
| STATE ROUTE 3 | 24 |
| WALNUT ST | 24 |
| COLONY DR | 22 |
| OLD 3C HWY | 22 |
| OTTERBEIN AVE | 22 |
| ROBINS RD | 22 |
| SPRING RD | 22 |
| COLLEGE AVE | 18 |
| EASTWIND DR | 18 |
| POLARIS PKY | 18 |
| WESTERVILLE ROAD | 18 |
| 3C HWY | 16 |
| COUNTY LINE RD | 16 |
| PARK BEND DR | 16 |
| RED BANK RD | 16 |
| Other | 547 |
2002 - 2018 National Fire Incident Reporting System (NFIRS) incidents
- Incident types reported to NFIRS in Westerville, OH
- 7,56141.6%Rescue & EMS
- 2,58914.3%Hazardous Condition
- 2,31312.7%Good Intent Call
- 2,17312.0%False Alarm
- 1,7589.7%Service Call
- 1,6719.2%Fire
- 480.3%Overpressure Rupture
- 350.2%Special Incident
- 190.1%Severe Weather
- Fire incident types reported to NFIRS in Westerville, OH
- 76745.9%Structure Fires
- 62837.6%Outside Fires
- 24714.8%Mobile Property/Vehicle Fires
- 291.7%Other
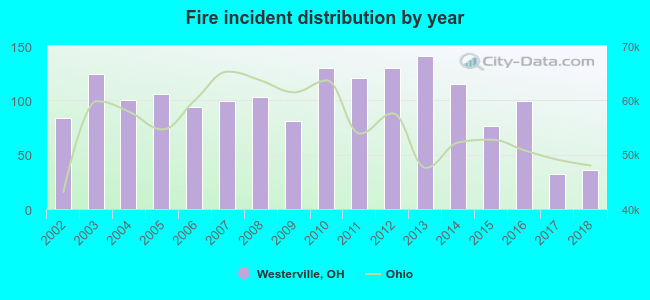 According to the data from the years 2002 - 2018 the average number of fires per year is 98. The highest number of reported fires - 141 took place in 2013, and the least - 32 in 2017. The data has a declining trend.
The average number of yearly fire incidents per 10k residents in Westerville, OH compared to nearest cities:
(Note: Based on data for the last 3 years, including only cities with population 5,000 and above)
| Westerville: | 14.8 |
| Worthington: | 24.6 |
| New Albany: | 42.0 |
| Gahanna: | 20.2 |
| Powell: | 33.0 |
| Columbus: | 38.2 |
| Upper Arlington: | 17.7 |
| Bexley: | 9.6 |
| Whitehall: | 50.3 |
 The median response time based on all reported fire incidents is 6 minutes. This is close to the Ohio median value.
The median response time in Westerville, OH compared to nearest cities:
(Note: Based on data for all years, including only cities with at least 500 fire incidents)
| Westerville: | 6 minutes |
| Worthington: | 4 minutes |
| Galena: | 7 minutes |
| Gahanna: | 5 minutes |
| Powell: | 6 minutes |
| Sunbury: | 9 minutes |
| Columbus: | 4 minutes |
| Upper Arlington: | 5 minutes |
| Whitehall: | 4 minutes |
 Based on the data from the years 2002 - 2018 the average number of fire-related yearly casualties is 2. The highest number of injuries - 4 took place in 2003, and the lowest - 0 in 2008. The data has a decreasing trend.
The average number of injuries per 1,000 fires is 19. This indicator was the highest - 125 in 2017, and the lowest 0 in 2008. The trend for casualties per 1,000 fire incidents is decreasing. Compared to the state value the number of casualties per 1,000 incidents is similar.
Based on the data from the years 2002 - 2018 the average number of fire-related yearly casualties is 2. The highest number of injuries - 4 took place in 2003, and the lowest - 0 in 2008. The data has a decreasing trend.
The average number of injuries per 1,000 fires is 19. This indicator was the highest - 125 in 2017, and the lowest 0 in 2008. The trend for casualties per 1,000 fire incidents is decreasing. Compared to the state value the number of casualties per 1,000 incidents is similar.Casualties per 1,000 incidents in Westerville, OH compared to nearest cities:
(Note: Based on data for all years, including only cities with at least 500 fire incidents)
| Westerville: | 15.6 |
| Worthington: | 10.2 |
| Galena: | 5.2 |
| Gahanna: | 7.5 |
| Powell: | 11.1 |
| Sunbury: | 4.1 |
| Columbus: | 13.4 |
| Upper Arlington: | 15.7 |
| Whitehall: | 9.9 |
 29.4% incidents where reported in the morning and 70.6% in the evening. The most fires (16.3%) took place on Sunday, and the least (12.7%) on Friday.
 Based on the 1,671 incident reports from years 2002 - 2018 most fires (11.4%) took place during June, and the least (5.7%) in February.
 Out of all 18,167 cases reported during the years 2002 - 2018, the most belonged to the categories: Rescue & EMS (41.6%), Hazardous Condition (14.3%), and Good Intent Call (12.7%).
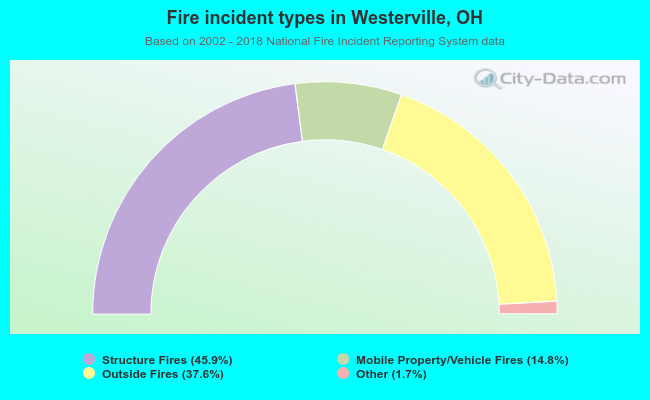 When looking into fire subcategories, the most reports belonged to: Structure Fires (45.9%), and Outside Fires (37.6%).