Waynesboro: Fire Incidents, Virginia (VA)
Where are fire incidents reported in Waynesboro, VA
Something went wrong! Please refresh the page.
| Fire incidents reported | |
|---|---|
| Sreet name | Count |
| COUNTY AUGUSTA | 244 |
| MAIN ST | 166 |
| ROSSER AVE | 94 |
| DELPHINE AVE | 84 |
| HOPEMAN PKY | 80 |
| WAYNE AVE | 78 |
| BROAD ST | 76 |
| SIDE HWY | 68 |
| CALF MOUNTAIN RD | 56 |
| BAYARD AVE | 52 |
| NEW HOPE RD | 52 |
| LYNDHURST RD | 50 |
| CHARLOTTE AVE | 44 |
| KING AVE | 44 |
| LUCY LN | 42 |
| CATTLE SCALES RD | 38 |
| COMMERCE AVE | 34 |
| LEW DEWITT BLVD | 34 |
| BOOKERDALE RD | 32 |
| DOOMS CROSSING RD | 32 |
| FLORENCE AVE | 32 |
| OAK AVE | 32 |
| WINCHESTER AVE | 32 |
| ALBEMARLE AVE | 30 |
| OLD WHITE BRIDGE RD | 30 |
| POPLAR AVE | 30 |
| ROCKFISH RD | 30 |
| AUGUSTA AVE | 28 |
| AUGUSTA FARMS RD | 28 |
| ARCH AVE | 26 |
| Other | 595 |
2002 - 2018 National Fire Incident Reporting System (NFIRS) incidents
- Incident types reported to NFIRS in Waynesboro, VA
- 5,06336.2%Rescue & EMS
- 2,54418.2%Hazardous Condition
- 2,29316.4%Fire
- 1,63211.7%Good Intent Call
- 1,2779.1%False Alarm
- 1,0727.7%Service Call
- 520.4%Severe Weather
- 300.2%Special Incident
- 210.2%Overpressure Rupture
- Fire incident types reported to NFIRS in Waynesboro, VA
- 1,13949.7%Structure Fires
- 68629.9%Outside Fires
- 40317.6%Mobile Property/Vehicle Fires
- 652.8%Other
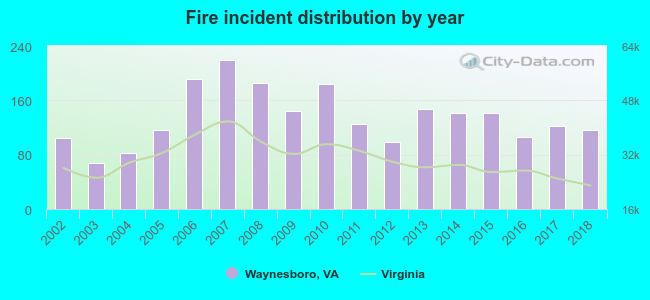 According to the data from the years 2002 - 2018 the average number of fires per year is 135. The highest number of reported fires - 220 took place in 2007, and the least - 67 in 2003. The data has a rising trend.
The average number of yearly fire incidents per 10k residents in Waynesboro, VA compared to nearest cities:
(Note: Based on data for the last 3 years, including only cities with population 5,000 and above)
| Waynesboro: | 53.7 |
| Fishersville: | 39.8 |
| Stuarts Draft: | 41.9 |
| Crozet: | 24.0 |
| Staunton: | 46.5 |
| Bridgewater: | 29.7 |
| Charlottesville: | 70.8 |
| Harrisonburg: | 17.0 |
| Buena Vista: | 75.7 |
 The median response time based on all reported fire incidents is 7 minutes. This is close to the state median value.
The median response time in Waynesboro, VA compared to nearest cities:
(Note: Based on data for all years, including only cities with at least 500 fire incidents)
| Waynesboro: | 7 minutes |
| Fishersville: | 8 minutes |
| Stuarts Draft: | 11 minutes |
| Verona: | 9 minutes |
| Staunton: | 7 minutes |
| Grottoes: | 9 minutes |
| Greenville: | 15 minutes |
| Churchville: | 12 minutes |
| Bridgewater: | 11 minutes |
 Based on the reports from the years 2002 - 2018 the average number of fire-related yearly deaths is 0. The highest number of deaths - 2 took place in 2009, and the lowest - 0 in 2002. The data has a constant trend.
 According to the data from the years 2002 - 2018 the average number of fire-related yearly casualties is 2. The highest number of casualties - 7 took place in 2010, and the lowest - 0 in 2002. The data has an increasing trend.
The average number of casualties per 1,000 fire incidents is 17. This indicator was the highest - 49 in 2017, and the lowest 0 in 2002. The trend for casualties per 1,000 incidents is increasing. Compared to the state value the number of injuries per 1,000 incidents is higher.
According to the data from the years 2002 - 2018 the average number of fire-related yearly casualties is 2. The highest number of casualties - 7 took place in 2010, and the lowest - 0 in 2002. The data has an increasing trend.
The average number of casualties per 1,000 fire incidents is 17. This indicator was the highest - 49 in 2017, and the lowest 0 in 2002. The trend for casualties per 1,000 incidents is increasing. Compared to the state value the number of injuries per 1,000 incidents is higher.Casualties per 1,000 incidents in Waynesboro, VA compared to nearest cities:
(Note: Based on data for all years, including only cities with at least 500 fire incidents)
| Waynesboro: | 18.3 |
| Fishersville: | 3.7 |
| Stuarts Draft: | 4.1 |
| Verona: | 16.2 |
| Staunton: | 13.2 |
| Grottoes: | 4.8 |
| Greenville: | 1.9 |
| Churchville: | 3.1 |
| Bridgewater: | 10.1 |
 29.6% incidents where reported in the morning and 70.4% in the evening. The most fires (15.3%) took place on Sunday, and the least (12.7%) on Tuesday.
 According to the 2,293 fire incidents from years 2002 - 2018 most fires (10.8%) took place during April, and the least (5.9%) in September.
 Out of all 13,984 cases reported during the years 2002 - 2018, the most belonged to the categories: Rescue & EMS (36.2%), Hazardous Condition (18.2%), and Fire (16.4%).
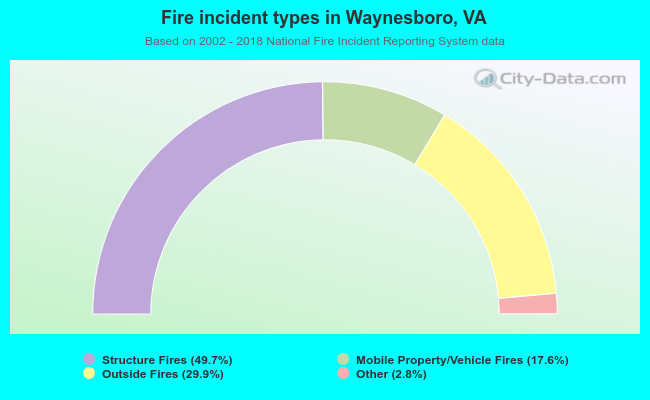 When looking into fire subcategories, the most reports belonged to: Structure Fires (49.7%), and Outside Fires (29.9%).